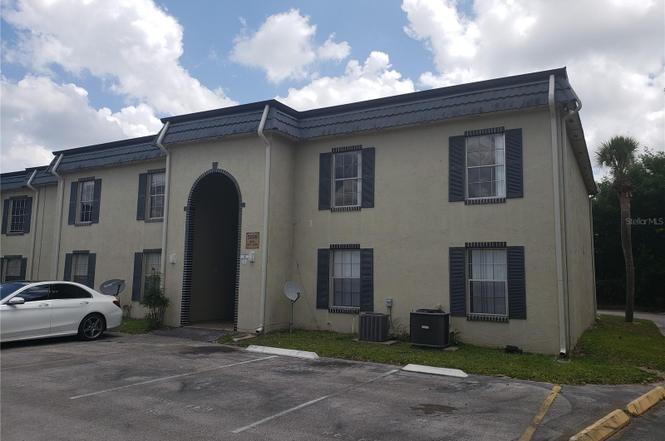
5228 Curry Ford Rd #320 · Orlando, FL
Flood risk No data
- FEMA flood zone
- —
- Chance of flooding over 30 yrs
- —
- Est. flood insurance / yr
- —
Fire risk No data
- Est. fire insurance / yr
- —
Heat risk No data
- Hot days now (above threshold)
- —
- Hot days in 30 yrs
- —
Wind risk No data
- Chance of severe wind over 30 yrs
- —
Air-quality risk No data
- Unhealthy air days now
- —
- Unhealthy air days in 30 yrs
- —
Risk factors via First Street. Map © Google.
Why this score? — see what drove the D grade
The composite is a weighted blend of 9 inputs, each scored 0–100. Each bar is that input's sub-score; the figure is the points it added to the 100-point composite (weight × sub-score).
- Cash flow +10.6/30.0
- ARV discount +7.5/15.0
- 1% rule +6.4/10.0
- Livability +4.3/5.0
- Schools +4.1/10.0
- DSCR +3.0/10.0
- Condition / age +2.5/5.0
- Rent growth +2.0/5.0
- Appreciation +0.0/10.0
$139,900
🖨 Deal sheet 📄 Offer letter ✓ Due diligence
Listing remarks
FOR SALE 2 BEDROOM, 2 BATHROOMS CONDO * * 2ND FLOOR WITH BALCONY * * GREAT INVESTMENT UNIT * * SCHEDULE A SHOWING TODAY
Key facts
- Balcony
- Corner unit
- 2nd floor
Tags
Property features AI
Finance
- Other: No lease restrictions indicated
- Financial info: Total monthly fees $360; total annual fees $4,320
- HOA & community: Association: HACIENDA DEL SOL; Monthly condo/association fee $360 (includes recreational facilities, trash, water); Clubhouse; Community pool; Pets allowed (cats and dogs, with number limit)
Exterior
- Parking: Open parking
- Security: Smoke detector(s)
- Utilities: Public water; Public sewer; Cable available
- Home design: Residential condominium; Single-story unit within a two-level building; Faces west; Located on 2nd floor
- Construction: Block construction; Shingle roof; Slab foundation; Built area ~1052 (public records)
- Exterior features: Balcony; In-ground pool; Paved road access; Located within city limits
Interior
- Kitchen: Dishwasher; Range; Refrigerator
- Bedrooms: 2 bedrooms
- Flooring: Ceramic tile
- Bathrooms: 2 full bathrooms
- Heating & cooling: Central heating; Central air conditioning
- Interior features: Thermostat; Blinds; Smoke detector(s)
- Laundry & utility: Laundry closet
Neighborhood map
What this means for you Summary
Snapshot
- This is a 2-bed/2.0-bath condo listed at $140k.
Deal economics
- At list price, monthly cash flow is $-70 ($-837/yr) — negative.
- To cash-flow at today's rent, offer at most $128k (8.8% below list).
- Meets the 1% rule at list price ($2k rent vs $140k).
- Recommended offer: $123k (12.0% below list) — sets the bar for market timing.
- Cap rate 5.7% vs local median 3.0% in Orlando — top-decile yield for the area; either an underpriced asset or a hidden risk that comps aren't pricing in. Stress-test before assuming the spread holds.
Location & tenants
- Location reads 86/100 on livability (#12 in FL, #360 nationally) — a professional / high-income tenant draw. Strengths: amenities A+, commute A+, housing A+.
- Orange (suburban): math 46% / reading 51% proficiency, ranked #43 of 73 in FL (top 59%) — families likely to look elsewhere, expect single-tenant / working-renter base with shorter leases.
- Market conditions: Rents soft (-2.0%/yr); 214 active listings in the ZIP; 40 comparable units currently listed for rent nearby; rentals at typical pace (median 16d on market — plan ~3-4 weeks tenant-placement turnaround); 8,053 units permitted in Orange County in 2024 (3,133 in 5+ unit buildings).
Forward outlook
- Local home prices are declining (-3.0%/yr); year-one equity from $967 of loan paydown is wiped out by about $4k of value loss. Plan a longer hold.
- Orange County population projected at +52% by 2050 — long-run rental-demand tailwind backs the buy-and-hold thesis.
Negotiation context
- It's been on market 188 days — a 12% lower offer ($123k) is reasonable based on typical stale-listing flexibility.
- 2 sale attempts; this cycle's ask has dropped $20k (13%) from the opening price — seller is motivated, your offer sets the floor, not the list.
- Current owner paid $46k; list at $140k implies a 205% gain — meaningful room to come down on a strong offer.
Risks & watch-outs
- Watch-outs: HOA is 23% of rent.
Questions for the listing agent
- What do current leases actually rent for vs. the listed asking? Can we see a recent rent roll and the last 12 months of T-12 income?
- It's been on market 188 days. Have you received any prior offers? Is the seller open to a 12% concession, seller financing, or rate buy-down credit?
- Built in 1973 — when were the roof, HVAC, electrical panel, plumbing, and water heater last replaced?
- What does the HOA fee cover, when was the last increase, and are there any pending special assessments or reserve-fund shortfalls?
- Any open or pending special assessments — roof, HVAC, plumbing, elevator, façade? What's the per-unit balance and payoff schedule, and is the seller paying it off at close or rolling it to the buyer?
- Why hasn't it sold? Are there any deal-killer items the seller is aware of (foundation, flood, title, zoning, code violations)?
- Is there a deadline driving the sale (1031 exchange, divorce, estate, relocation)? That informs how much negotiation room exists.
- Schools are B-rated — typically a magnet for longer-tenancy family renters. What's the average tenant stay here, and is there a school-zone premium baked into asking?
- The area grade is low — what's the realistic commute time and amenity access for the typical tenant pool here? Any planned neighborhood developments (good or bad) we should know about?
- What's the average days-on-market for RENTAL listings here right now (not sales)? A rising rental-DOM trend means longer vacancies and softer asking-rent achievability than the comps imply.
- What's the recent tenant-quality profile in this submarket — average credit score on applications, eviction rate, late-payment / NSF rate, and stable-employment percentage? A property-management company in the area should have these aggregated.
- How much new apartment / multifamily construction is in the pipeline within 1–3 miles? Heavy new supply (>2% of stock underway) typically softens rents 12–24 months out; light construction supports rent growth.
Investment metrics
- 1% rule
- 1.14% ✓
- Cap rate
- 5.69%
- Cash-on-cash
- -2.14%
- DSCR
- 0.90
- GRM
- 7.3
CMA / ARV
No comps found within radius.
Projected returns pro-forma
-3.0% appreciation · 0.0% rent growth · sell at horizon
- IRR
- -24.5%
- Equity multiple
- 0.20×
- Total profit
- $-31,529
- Equity at exit
- $20,860
- IRR
- -40.4%
- Equity multiple
- -0.28×
- Total profit
- $-50,190
- Equity at exit
- $12,096
Cash invested: $39,172 (down + closing). Projections, not guarantees.
Landlord ↔ Tenant lean methodology
- Overall (STATE)
- 87 Strongly Landlord-Friendly
- State Florida
- 87 Strongly Landlord-Friendly · R+3
- County
- — inherits STATE
- City
- — inherits STATE
ZIP-level market 32812
- Rents YoY
- -2.0%
- Active inventory
- 214
- Price-to-rent
- 7.3×
Monthly cashflow live
- Estimated rent
- $1,590 high interval (Pro) →
- Mortgage (P&I)
- −$734
- Tax from tax record
- −$174 /mo · $2,087/yr
- Insurance
- −$58
- HOA
- −$360
- Vacancy / Maint / Mgmt
- −$334
- Net cashflow
- $-70
Break-even live
UW: 25.0% down · 7.5% · 30yr · 1.5% tax · 5.0% vac · 8.0% maint · 8.0% mgmt
Financing live
Cash to close
- Down payment
- $34,975
- Closing costs
- $4,197
- Reserves months
- —
- Total cash needed
- —
Loan-product check · same deal, 3 products live
Conventional
25% down · 7.5% · 30yr
- Down + closing
- —
- Monthly P&I
- —
- Monthly cashflow
- —
- DSCR
- —
- Eligible?
- —
Personal DTI + credit; lowest rate.
DSCR
20% down · 8.5% · 30yr
- Down + closing
- —
- Monthly P&I
- —
- Monthly cashflow
- —
- DSCR
- —
- Eligible?
- —
No personal income docs; deal must DSCR.
Hard money
10% down · 12.0% · 12mo
- Down + closing
- —
- Monthly P&I
- —
- Monthly cashflow
- —
- DSCR
- —
- Eligible?
- —
Short-term bridge; refi at stabilization.
Rent comps 40 comps
| Address | Beds | Baths | Sqft | Rent | $/sqft | DOM | Units | Dist |
|---|---|---|---|---|---|---|---|---|
| 5234 Curry Ford Rd #412 Orlando, FL | 2.0 | 1.0 | 984 | $1,200 | $1.22 | 23d | 1 | 0.03mi |
| 5230 Curry Ford Rd Orlando, FL | 2.0 | 1.0 | 984 | $1,250 | $1.27 | 4d | 1 | 0.03mi |
| 5301 White Cliff Ln Unit 1004 Orlando, FL | 2.0 | 2.0 | 1071 | $1,800 | $1.68 | 14d | 1 | 0.20mi |
| 5325 Curry Ford Rd Unit H101 Orlando, FL | 1.0 | 1.0 | 777 | $1,199 | $1.54 | 23d | 1 | 0.21mi |
| 1625 Larkin Ave Orlando, FL | 3.0 | 2.0 | 1202 | $1,850 | $1.54 | 11d | 1 | 0.22mi |
| 5273 Tunbridge Wells Ln #1601 Orlando, FL | 3.0 | 2.0 | 1395 | $2,000 | $1.43 | 21d | 1 | 0.24mi |
| 1448 Adriel Ln Orlando, FL | 1.0–2.0 | 1.0–2.0 | 712 | $1,550 | $2.18 | 21d | 1 | 0.27mi |
| 4895 E Wind St Unit 2 Orlando, FL | 2.0 | 1.0 | 1000 | $1,499 | $1.50 | 16d | 1 | 0.36mi |
| 1997 Dixie Belle Dr Unit D Orlando, FL | 3.0 | 2.0 | 993 | $1,750 | $1.76 | 17d | 1 | 0.38mi |
| 2007 Dixie Belle Dr Apt T Orlando, FL | 1.0 | 1.5 | 830 | $1,375 | $1.66 | 23d | 1 | 0.43mi |
| 2007 Dixie Belle Dr Unit 2007D Orlando, FL | 2.0 | 1.5 | 830 | $1,400 | $1.69 | 17d | 1 | 0.44mi |
| 2013 Dixie Belle Dr Unit 2013B Orlando, FL | 2.0 | 2.0 | 993 | $1,700 | $1.71 | 4d | 1 | 0.45mi |
| 2013 Dixie Belle Dr Orlando, FL | 2.0–3.0 | 2.0 | 993 | $1,700 | $1.71 | 2d | 2 | 0.46mi |
| 2025 Dixie Belle Dr Orlando, FL | 3.0 | 2.0 | 993 | $1,500 | $1.51 | 7d | 1 | 0.46mi |
| 5317 Curry Ford Rd Orlando, FL | 1.0–2.0 | 1.0 | 661 | $1,300 | $1.97 | 2d | 3 | 0.47mi |
| 2065 Dixie Belle Dr Apt N Orlando, FL | 2.0 | 2.0 | 993 | $1,695 | $1.71 | 23d | 1 | 0.48mi |
| 2019 Dixie Belle Dr Unit G Orlando, FL | 3.0 | 2.0 | 993 | $1,595 | $1.61 | 23d | 1 | 0.49mi |
| 1450 Terre Cia Ave Orlando, FL | 3.0 | 2.0 | 1166 | $2,095 | $1.80 | 4d | 1 | 0.50mi |
| 2031 Dixie Belle Dr Unit 2031L Orlando, FL | 1.0 | 1.5 | 830 | $1,550 | $1.87 | 4d | 1 | 0.50mi |
| 2053 Dixie Belle Dr Orlando, FL | 3.0 | 2.0 | 993 | $1,550 | $1.56 | 12d | 1 | 0.54mi |
| 2053 Dixie Belle Dr Unit 2053J Orlando, FL | 3.0 | 2.0 | 993 | $1,550 | $1.56 | 23d | 1 | 0.54mi |
| 4928 E Michigan St Orlando, FL | 1.0–2.0 | 1.0–2.0 | 1102 | $2,050 | $1.86 | 1d | 6 | 0.70mi |
| 5408 E Michigan St Orlando, FL | 1.0 | 1.0 | 851 | $1,388 | $1.63 | 23d | 2 | 0.70mi |
| 5452 E Michigan St Unit 5452-1 Orlando, FL | 2.0 | 2.0 | 1103 | $1,800 | $1.63 | 21d | 1 | 0.70mi |
| 4310 Yorkshire Ln Orlando, FL | 3.0 | 2.0 | 1271 | $2,095 | $1.65 | 4d | 1 | 0.72mi |
| 5444 E Michigan St Unit 5444-6 Orlando, FL | 2.0 | 2.0 | 1126 | $1,800 | $1.60 | 23d | 1 | 0.72mi |
| 5424 E Michigan St Orlando, FL | 2.0 | 2.0 | 1126 | $1,499 | $1.33 | 7d | 1 | 0.74mi |
| 5550 E Michigan St Orlando, FL | 1.0–2.0 | 1.0–2.0 | 950 | $1,600 | $1.68 | 7d | 3 | 0.75mi |
| 5550 E Michigan St Orlando, FL | 2.0 | 2.0 | 1027 | $1,598 | $1.56 | 14d | 2 | 0.75mi |
| 5550 E Michigan St Orlando, FL | 1.0–2.0 | 1.0–2.0 | 913 | $1,600 | $1.75 | 19d | 3 | 0.75mi |
| 5436 E Michigan St Orlando, FL | 2.0 | 2.0 | 1114 | $1,775 | $1.59 | 16d | 2 | 0.77mi |
| 5436 E Michigan St Orlando, FL | 2.0 | 2.0 | 1114 | $1,725 | $1.55 | 4d | 1 | 0.77mi |
| 5835 La Costa Dr #104 Orlando, FL | 2.0 | 2.0 | 1115 | $1,600 | $1.43 | 23d | 1 | 0.77mi |
| 2320 S Conway Rd Orlando, FL | 3.0 | 1.0–2.0 | 760 | $1,703 | $2.24 | 2d | 23 | 0.78mi |
| 1228 Virginian Dr Orlando, FL | 1.0 | 1.0 | 865 | $850 | $0.98 | 16d | 1 | 0.80mi |
| 2948 S Semoran Blvd #1202 Orlando, FL | 1.0 | 1.0 | 925 | $900 | $0.97 | 23d | 1 | 0.80mi |
| 1926 Conway Rd #5 Orlando, FL | 3.0 | 2.0 | 1302 | $1,750 | $1.34 | 23d | 1 | 0.81mi |
| 5762 Folkstone Ln Orlando, FL | 1.0–3.0 | 1.0–2.0 | 1081 | $1,967 | $1.82 | 1d | 17 | 0.82mi |
| 2100 Conway Rd Orlando, FL | 1.0–3.0 | 1.0–2.0 | 1022 | $2,326 | $2.28 | 2d | 20 | 0.86mi |
| 1637 Watauga Ave Orlando, FL | 2.0 | 2.0 | 951 | $1,432 | $1.51 | 7d | 2 | 0.86mi |
HOA detail condo
- Monthly dues
- $360 · $4,320/yr
- Assessments
- None detected in remarks — confirm with the listing agent.
Listing history 12 events
-
2026-05-13status Pending
-
2026-04-27price $139,900
-
2026-02-05price $144,900
-
2026-01-23price $149,900
-
2026-01-17status Active
-
2026-01-07status Pending
-
2025-12-03price $154,900
-
2025-10-27$159,900 Active
-
2016-03-08soldstatus $45,800
-
2006-11-01soldstatus $115,000
-
2005-09-08soldstatus $88,000
-
1998-08-21soldstatus $70,000
ⓘ Source: listings_history table (triggers on properties + properties_extension) + one-shot
backfill from property_details.listing_events for pre-trigger history.
Tax reassessment forecast FL · Resets to sale price
- Current annual tax
- $2,087 · $174/mo
- Projected year-2 tax
- $2,087 · $174/mo
- Expected delta
- $0/yr ($0/mo · 0.0%)
ⓘ Screening estimate from a state-policy table — verify with the county assessor before closing.
Nearby sold comps map
Loading sold comps map…
Walkable amenities ~0.75 mi
Loading nearby amenities…
Taxation est. · year 1
- Rental income
- $19,079
- − Mortgage interest
- −$7,837
- − Property taxes
- −$2,087
- − Insurance
- −$700
- − Repairs & maintenance
- −$1,526
- − Management
- −$1,526
- − HOA
- −$4,320
- − Depreciation
- −$4,070
- Taxable loss
- −$2,986
- Est. tax savings @ 24.0%
- +$717
- After-tax cash flow
- $-121/yr
For passive investors: Depreciation is non-cash, so a rental often shows a tax loss while cash-flowing — sheltering income. Rental losses are passive: they offset passive income freely, and up to $25,000/yr can offset ordinary (W-2) income if you actively participate and your MAGI is under $100k (phasing out to $0 by $150k); unused losses carry forward. On sale, claimed depreciation is recaptured at up to 25%, and gains may owe capital-gains tax (a 1031 exchange can defer both). Figures are a year-1 estimate at your 24.0% rate — not tax advice; consult a CPA.
Schools (NCES district)
- District
- Orange
- NCES district ID
- 1201440
- Math proficiency
- 46% ▼ -9.00%
- Reading proficiency
- 51% ▼ -2.00%
- Median HH income
- $49,350
- Composite
- 41.47/100
- National rank
- #3461
- State rank
- #43 of 73 in FL
Livability — Orlando
- Score
- 86/100
- State rank
- #12
- US rank
- #360
Category grades
Schools grade is shown separately in the Schools card above.
Census & demographics
- Census place
- Orlando, FL
- County
- Orange County · 1,471,359 people
- City population
- 964,969
- Metro
- Orlando-Kissimmee-Sanford, FL
- Population (ZIP)
- 34,686
- Household income
- $73,149
- Rent vs Own
- Severe rent burden
- 1653.0
Population outlook (Orange County) Hauer SSP2
- Today (2025)
- 1,618,226 people
- By 2030
- 1,787,404 · +10.5%
- By 2040
- 2,125,621 · +31.4%
- By 2050
- 2,454,016 · +51.6%
- By 2075
- 3,173,711 · +96.1%
- By 2100
- 3,607,781 · +122.9%
Race, ethnicity, and origin ACS 2023
- Neighborhood character
- Diverse neighborhood (Simpson 0.63)
- Race & ethnicity
- White 49% Hispanic / Latino 34% Two or more races 18% Black 8% Asian 4%
- Hispanic origin (detail)
- Mexican 3% Puerto Rican 18% Cuban 3% Dominican 2%
- Common ancestry
- Romanian 3% Slovak 2% Iranian 2%
- Foreign-born
- 13% · Canada, Jamaica, Vietnam
- Languages at home
- 66% English-only · Spanish 28% Chinese 2% Other Indo-European 1%
Political lean MEDSL · Orange
- 2024 margin
- D (+13.6) · D 56.1% · R 42.5% · Other 1.3%
- 2008→2024 swing
- -5.0pp toward R · 2008: 18.6pp · 2024: 13.6pp
- All cycles
- 2024: D+13.6 2020: D+23.1 2016: D+24.6 2012: D+18.2 2008: D+18.6
Not yet ingested
- Civics
- —
Market trends
- HPI YoY
- ▼ -202.16%
- Current HPI
- 352.6841
- Rent YoY
- ▼ -2.00%
- Metro
- Orlando-Kissimmee-Sanford, FL
- State GDP YoY
- ▲ 3.28%
- F500 in state
- 36
Industry mix (Fortune 500 HQ in FL)
| Industry | F500 HQs | Revenue |
|---|---|---|
| Industrial Technology | 2 | $29B |
|
||
| Insurance | 2 | $17B |
|
||
| Retail | 1 | $60B |
|
||
| Technology Distribution | 1 | $58B |
|
||
| Homebuilding | 1 | $35B |
|
||
| Technology Manufacturing | 1 | $35B |
|
||
Price history
+99.9% since first listed12 events — show timeline
- 2026-05-13 Pending — Stellar MLS as Distributed by MLS Grid
- 2026-04-27 Price Changed $139,900 Stellar MLS as Distributed by MLS Grid
- 2026-02-05 Price Changed $144,900 Stellar MLS as Distributed by MLS Grid
- 2026-01-23 Price Changed $149,900 Stellar MLS as Distributed by MLS Grid
- 2026-01-17 Relisted — Stellar MLS as Distributed by MLS Grid
- 2026-01-07 Pending — Stellar MLS as Distributed by MLS Grid
- 2025-12-03 Price Changed $154,900 Stellar MLS as Distributed by MLS Grid
- 2025-10-27 Listed $159,900 Stellar MLS as Distributed by MLS Grid
- 2016-03-08 Sold (Public Records) $45,800 Public Records
- 2006-11-01 Sold (Public Records) $115,000 Public Records
- 2005-09-08 Sold (Public Records) $88,000 Public Records
- 1998-08-21 Sold (Public Records) $70,000 Public Records
Property tax history
+8.8%/yrLatest (2025): $2,087 · +14.7% YoY. Source: county tax records.
Cash-flow waterfall
monthlySold comps — $/sqft
last 12 mo · ≤1 miLoading sold comps…