 Multi-family
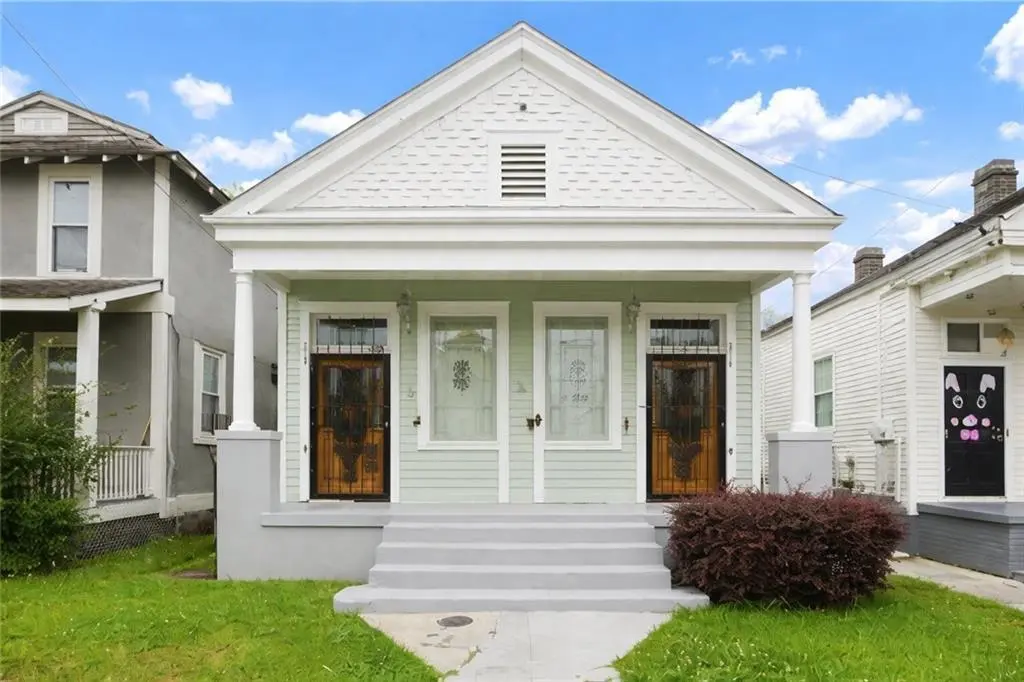
2709 Milan St · New Orleans, LA
Flood risk 8/10 · Major
- FEMA flood zone
- AE
- Chance of flooding over 30 yrs
- 0.77%
- Est. flood insurance / yr
- $1,737 – $8,500
Fire risk 1/10 · Minimal
- Est. fire insurance / yr
- $1,269 – $2,357
Heat risk 10/10 · Severe
- Hot days now (above 109°F)
- 7 days/yr
- Hot days in 30 yrs
- 21 days/yr
Wind risk 10/10 · Severe
- Chance of severe wind over 30 yrs
- 99.0%
Air-quality risk 3/10 · Minor
- Unhealthy air days now
- 3 days/yr
- Unhealthy air days in 30 yrs
- 4 days/yr
Risk factors via First Street. Map © Google.
Why this score? — see what drove the B grade
The composite is a weighted blend of 9 inputs, each scored 0–100. Each bar is that input's sub-score; the figure is the points it added to the 100-point composite (weight × sub-score).
- Cash flow +29.3/30.0
- ARV discount +15.0/15.0
- DSCR +10.0/10.0
- 1% rule +7.6/10.0
- Livability +4.0/5.0
- Condition / age +2.5/5.0
- Rent growth +2.1/5.0
- Schools +1.6/10.0
- Appreciation +0.0/10.0
$349,000
🖨 Deal sheet 📄 Offer letter ✓ Due diligence
Multi-family units
County records classify this as Multi-Family (2-4 Unit). Listing-text estimate: 1 unit. estimate disagrees with records
Listing remarks MLS
This spacious home has a flexible floor plan, perfect for entertaining! * * Special Financing and Grants available! No money down and No PMI! Inquire for details! * * NEWER ROOF (2022), fresh interior paint (2024), new carpet, and a new fence. * * Soaring 11-ft ceilings highlight the stunning architectural details, including ornate light fixtures, elegant fireplace mantels and vintage tile surrounds. Ample closet space and storage areas ensure convenience, while the eat-in kitchen shines with granite countertops, a breakfast bar, and stainless steel appliances. Enjoy the enclosed front porch, indoor laundry hookups, and energy-efficient windows. Major updates include a Security system with cameras for peace of mind. Fantastic location—just steps from hospitals, grocery stores, and the vibrant Freret St. corridor, now featuring a brand-new Trader Joe’s! Don’t miss this gem!
Key facts
- New carpet
- Newer roof
- 11-ft ceilings
Tags
Neighborhood map
What this means for you Summary
Snapshot
- This is a 6-bed/2.0-bath multifamily listed at $349k.
Deal economics
- At list price, monthly cash flow is $798 ($10k/yr) — positive.
- The deal already cash-flows at list — no discount required.
- Meets the 1% rule at list price ($4k rent vs $349k).
- Recommended offer: $328k (6.0% below list) — sets the bar for market timing.
- Cap rate 10.5% vs local median 4.4% in New Orleans — top-decile yield for the area; either an underpriced asset or a hidden risk that comps aren't pricing in. Stress-test before assuming the spread holds.
Location & tenants
- Location reads 81/100 on livability (#3 in LA, #1,383 nationally) — a professional / high-income tenant draw. Strengths: amenities A+, commute A+, health & safety A+; Watch: crime C-, employment D.
- Orleans Parish (urban): math 11% / reading 27% proficiency, ranked #69 of 98 in LA (top 70%) — low school quality limits family demand, transient renter base, plan for 1-2y turnover; 68% free/reduced lunch — lower-income household profile, screen leases tightly.
- Market conditions: Rents soft (-1.4%/yr); 278 active listings in the ZIP; 16 comparable units currently listed for rent nearby; rentals lingering (median 44d on market — plan ~5-8 weeks vacancy on turnover, expect pricing pressure); 62% of comp listings sitting > 30 days — soft ceiling on asking rent; solid renter incomes; 710 units permitted in Orleans Parish in 2024 (244 in 5+ unit buildings).
- At $4,392/mo this rent would consume 58% of the median local household income ($90k/yr) (locally 1756% of renters already pay >50% of income on rent) — very limited rent-growth headroom before tenants either downsize or default.
Forward outlook
- Local home prices are declining (-3.0%/yr); year-one equity from $2k of loan paydown is wiped out by about $10k of value loss. Plan a longer hold.
- Orleans County population projected at +61% by 2050 — long-run rental-demand tailwind backs the buy-and-hold thesis.
Negotiation context
- It's been on market 83 days — a 6% lower offer ($328k) is reasonable based on typical stale-listing flexibility.
- 6 sale attempts since 2y ago with the ask held roughly flat each time — persistent listings suggest the price (not the market) is what's stuck; bring a comps-based counter.
- Current owner paid $54k; list at $349k implies a 551% gain — meaningful room to come down on a strong offer.
Risks & watch-outs
- Watch-outs: flood insurance adds $427/mo.
- Climate carrying-cost: in FEMA flood zone AE (mandatory federal flood insurance); severe wind risk, 99% chance of damaging wind over 30y; extreme-heat days projected 7→21/yr by 2055 (HVAC capex compounding) — expect insurance premiums to compound above CPI over the hold.
Questions for the listing agent
- It's been on market 83 days. Have you received any prior offers? Is the seller open to a 6% concession, seller financing, or rate buy-down credit?
- Built in 1960 — when were the roof, HVAC, electrical panel, plumbing, and water heater last replaced?
- What's the actual annual flood-insurance premium (NFIP or private), and is the property in a SFHA with mandatory coverage?
- Why hasn't it sold? Are there any deal-killer items the seller is aware of (foundation, flood, title, zoning, code violations)?
- Is there a deadline driving the sale (1031 exchange, divorce, estate, relocation)? That informs how much negotiation room exists.
- What's the average days-on-market for RENTAL listings here right now (not sales)? A rising rental-DOM trend means longer vacancies and softer asking-rent achievability than the comps imply.
- What's the recent tenant-quality profile in this submarket — average credit score on applications, eviction rate, late-payment / NSF rate, and stable-employment percentage? A property-management company in the area should have these aggregated.
- How much new apartment / multifamily construction is in the pipeline within 1–3 miles? Heavy new supply (>2% of stock underway) typically softens rents 12–24 months out; light construction supports rent growth.
Investment metrics
- 1% rule
- 1.26% ✓
- Cap rate
- 10.50%
- Cash-on-cash
- 15.03%
- DSCR
- 1.67
- GRM
- 6.6
CMA / ARV
- ARV (median comp)
- $504,357
- List price
- $349,000
- Delta
- -30.80%
- Verdict
- UNDERPRICED
- Comps
- 20 within 1.0 mi
Show comp detail 12 sales within ~0.75 mi
| Address | Dist | Beds/Ba | Sqft | Sold | Price | $/sf | Match |
|---|---|---|---|---|---|---|---|
| 3721 23 Willow St | 0.17mi | 6/2.0 | 2,281 (+0%) | 3mo | $117,000 | $51 | 89 |
| 3429 31 Magnolia St | 0.21mi | 6/2.0 | 2,225 (-2%) | 12mo | $140,000 | $63 | 77 |
| 4617 19 Clara St | 0.21mi | 6/2.0 | 2,037 (-10%) | 0mo | $140,000 | $69 | 72 |
| 4617-19 Clara St | 0.34mi | 6/2.0 | 2,036 (-10%) | 0mo | $140,000 | $69 | 66 |
| 4324 26 Freret St | 0.21mi | 5/3.0 (-1) | 2,522 (+11%) | 8mo | $240,000 | $95 | 56 |
| 3505-07 07 Dryades St | 0.57mi | 5/3.5 (-1) | 2,214 (-3%) | 2mo | $220,000 | $99 | 56 |
| 2537-39 Amelia St | 0.21mi | 6/4.0 | 2,592 (+14%) | 6mo | $475,000 | $183 | 54 |
| 3725-27 Willow St | 0.17mi | 6/4.0 | 1,996 (-12%) | 12mo | $299,000 | $150 | 53 |
| 3329 General Taylor St | 0.44mi | 5/3.5 (-1) | 2,314 (+2%) | 18mo | $320,000 | $138 | 50 |
| 2308-10 Marengo St | 0.27mi | 5/3.0 (-1) | 2,086 (-8%) | 20mo | $445,000 | $213 | 48 |
| 3316 18 Delachaise St | 0.42mi | 6/6.0 | 2,462 (+8%) | 14mo | $389,000 | $158 | 39 |
| 2634-36 Joseph St | 0.72mi | 5/3.5 (-1) | 2,560 (+12%) | 1mo | $275,000 | $107 | 34 |
Match score weights: distance 35% · size 25% · config 20% · recency 20%. Top-matched comps best support the ARV.
Projected returns pro-forma
-3.0% appreciation · 0.0% rent growth · sell at horizon
- IRR
- -5.2%
- Equity multiple
- 0.81×
- Total profit
- $-18,389
- Equity at exit
- $52,037
- IRR
- 0.1%
- Equity multiple
- 1.01×
- Total profit
- $591
- Equity at exit
- $30,175
Cash invested: $97,720 (down + closing). Projections, not guarantees.
Landlord ↔ Tenant lean methodology
- Overall (STATE)
- 90 Strongly Landlord-Friendly
- State Louisiana
- 90 Strongly Landlord-Friendly · R+12
- County
- — inherits STATE
- City
- — inherits STATE
ZIP-level market 70115
- Rents YoY
- -1.4%
- Active inventory
- 278
- Price-to-rent
- 6.6×
Monthly cashflow live
- Estimated rent
- $4,392 high interval (Pro) →
- Mortgage (P&I)
- −$1,830
- Tax from tax record
- −$269 /mo · $3,233/yr
- Insurance
- −$145
- Flood insurance flood zone
- −$427 /mo · $5,118/yr
- HOA
- −$0
- Vacancy / Maint / Mgmt
- −$922
- Net cashflow
- $798
Break-even live
UW: 25.0% down · 7.5% · 30yr · 1.5% tax · 5.0% vac · 8.0% maint · 8.0% mgmt
Financing live
Cash to close
- Down payment
- $87,250
- Closing costs
- $10,470
- Reserves months
- —
- Total cash needed
- —
Loan-product check · same deal, 3 products live
Conventional
25% down · 7.5% · 30yr
- Down + closing
- —
- Monthly P&I
- —
- Monthly cashflow
- —
- DSCR
- —
- Eligible?
- —
Personal DTI + credit; lowest rate.
DSCR
20% down · 8.5% · 30yr
- Down + closing
- —
- Monthly P&I
- —
- Monthly cashflow
- —
- DSCR
- —
- Eligible?
- —
No personal income docs; deal must DSCR.
Hard money
10% down · 12.0% · 12mo
- Down + closing
- —
- Monthly P&I
- —
- Monthly cashflow
- —
- DSCR
- —
- Eligible?
- —
Short-term bridge; refi at stabilization.
Rent comps 16 comps
| Address | Beds | Baths | Sqft | Rent | $/sqft | DOM | Units | Dist |
|---|---|---|---|---|---|---|---|---|
| 3112 Upperline St New Orleans, LA | 5.0 | 3.5 | 2800 | $3,650 | $1.30 | 23d | 1 | 0.46mi |
| 1927 Napoleon Ave New Orleans, LA | 5.0 | 2.0 | 3350 | $3,600 | $1.07 | 43d | 1 | 0.54mi |
| 2325 State St New Orleans, LA | 5.0 | 3.0 | 1800 | $4,000 | $2.22 | 23d | 1 | 0.83mi |
| 2703 Palmer Ave New Orleans, LA | 5.0 | 2.0 | 2349 | $5,500 | $2.34 | 43d | 1 | 0.86mi |
| 2715 Palmer Ave New Orleans, LA | 5.0 | 2.0 | 2184 | $4,900 | $2.24 | 43d | 1 | 0.87mi |
| 2818 Palmer Ave New Orleans, LA | 5.0 | 2.0 | 1832 | $4,900 | $2.67 | 43d | 1 | 0.90mi |
| 2117 S Lopez St New Orleans, LA | 5.0 | 2.0 | 1920 | $2,000 | $1.04 | 23d | 1 | 0.91mi |
| 2808 Calhoun St New Orleans, LA | 6.0 | 4.0 | 3037 | $7,500 | $2.47 | 21d | 1 | 0.95mi |
| 6326 S Johnson St Unit 1 New Orleans, LA | 5.0 | 2.0 | 2013 | $3,950 | $1.96 | 43d | 1 | 0.96mi |
| 6321 S Prieur St New Orleans, LA | 6.0 | 2.0 | 1900 | $4,200 | $2.21 | 43d | 1 | 0.97mi |
| 4 Cromwell Pl New Orleans, LA | 5.0 | 2.0 | 2600 | $7,000 | $2.69 | 43d | 1 | 1.03mi |
| 7011 Jeannette St Unit A New Orleans, LA | 5.0 | 3.0 | 2200 | $5,000 | $2.27 | 43d | 1 | 1.20mi |
| 7015 Willow St New Orleans, LA | 5.0 | 3.0 | 2000 | $4,200 | $2.10 | 43d | 1 | 1.21mi |
| 1609 Broadway St New Orleans, LA | 5.0 | 2.0 | 1776 | $5,000 | $2.82 | 43d | 1 | 1.25mi |
| 1519 Pine St New Orleans, LA | 5.0 | 3.0 | 3000 | $4,000 | $1.33 | 23d | 1 | 1.32mi |
| 939 Broadway St New Orleans, LA | 5.0 | 3.0 | 1900 | $4,000 | $2.11 | 3d | 1 | 1.39mi |
Listing history 30 events
-
2026-06-18days on market $349,000 Active 83 DOM
-
2026-06-17days on market $349,000 Active 82 DOM
-
2026-06-16days on market $349,000 Active 81 DOM
-
2026-06-15days on market $349,000 Active 80 DOM
-
2026-06-13days on market $349,000 Active 78 DOM
-
2026-06-10days on market $349,000 Active 75 DOM
-
2026-06-09days on market $349,000 Active 74 DOM
-
2026-06-08days on market $349,000 Active 73 DOM
-
2026-06-07days on market $349,000 Active 72 DOM
-
2026-06-05days on market $349,000 Active 69 DOM
-
2026-06-03days on market $349,000 Active 68 DOM
-
2026-06-02days on market $349,000 Active 67 DOM
-
2026-06-01days on market $349,000 Active 66 DOM
-
2026-05-31days on market $349,000 Active 65 DOM
-
2026-03-27$349,000 Active 915-char remark
Show marketing remark (852 chars)
<br><br> **Special Financing and Grants available! No money down and No PMI! Inquire for details! <br><br> **NEWER ROOF (2022), fresh interior paint (2024), new carpet, and a new fence.** <br><br> Soaring 11-ft ceilings highlight the stunning architectural details, including ornate light fixtures, elegant fireplace mantels and vintage tile surrounds. <br><br>Ample closet space and storage areas ensure convenience, while the eat-in kitchen shines with granite countertops, a breakfast bar, and stainless steel appliances. Enjoy the enclosed front porch, indoor laundry hookups, and energy-efficient windows. Major updates include a Security system with cameras for peace of mind. <br><br> Fantastic location--just steps from hospitals, grocery stores, and the vibrant Freret St. corridor, now featuring a brand-new Trader Joe's! Don't miss this gem!
-
2026-03-27$349,000 Active 852-char remark
Show marketing remark (852 chars)
<br><br> **Special Financing and Grants available! No money down and No PMI! Inquire for details! <br><br> **NEWER ROOF (2022), fresh interior paint (2024), new carpet, and a new fence.** <br><br> Soaring 11-ft ceilings highlight the stunning architectural details, including ornate light fixtures, elegant fireplace mantels and vintage tile surrounds. <br><br>Ample closet space and storage areas ensure convenience, while the eat-in kitchen shines with granite countertops, a breakfast bar, and stainless steel appliances. Enjoy the enclosed front porch, indoor laundry hookups, and energy-efficient windows. Major updates include a Security system with cameras for peace of mind. <br><br> Fantastic location--just steps from hospitals, grocery stores, and the vibrant Freret St. corridor, now featuring a brand-new Trader Joe's! Don't miss this gem!
-
2026-02-23price $349,000
-
2026-02-23price $349,000
-
2026-01-17historical $2,200
-
2025-11-21price $385,000
-
2025-11-17price $385,000
-
2025-07-17$2,200
-
2025-07-15price $415,000
-
2025-07-15price $415,000
-
2025-05-24price $424,000
-
2025-05-24price $424,000
-
2025-03-17$450,000 Active
-
2025-03-17$415,000 Active
-
2024-10-11$525,000 Active
-
1979-05-29soldstatus $53,630
ⓘ Source: listings_history table (triggers on properties + properties_extension) + one-shot
backfill from property_details.listing_events for pre-trigger history.
Tax reassessment forecast LA · Resets to sale price
- Current annual tax
- $3,233 · $269/mo
- Projected year-2 tax
- $3,233 · $269/mo
- Expected delta
- $0/yr ($0/mo · 0.0%)
ⓘ Screening estimate from a state-policy table — verify with the county assessor before closing.
Climate risk First Street
- Flood 8/10 Severe FEMA zone AE · 77% chance over 30 yrs
- Wildfire 1/10 Low
- Heat 10/10 Extreme 7 d/yr ≥109°F today · 21 d/yr by 30 yrs out
- Wind 10/10 Extreme 99% chance of damaging wind over 30 yrs
- Air quality 3/10 Moderate 3 unhealthy d/yr today · 4 by 30 yrs out
Nearby sold comps map
Loading sold comps map…
Walkable amenities ~0.75 mi
Loading nearby amenities…
Taxation est. · year 1
- Rental income
- $52,698
- − Mortgage interest
- −$19,549
- − Property taxes
- −$3,233
- − Insurance
- −$6,864
- − Repairs & maintenance
- −$4,216
- − Management
- −$4,216
- − Depreciation
- −$10,153
- Taxable income
- $4,468
- Est. tax owed @ 24.0%
- −$1,072
- After-tax cash flow
- $8,500/yr
For passive investors: Depreciation is non-cash, so a rental often shows a tax loss while cash-flowing — sheltering income. Rental losses are passive: they offset passive income freely, and up to $25,000/yr can offset ordinary (W-2) income if you actively participate and your MAGI is under $100k (phasing out to $0 by $150k); unused losses carry forward. On sale, claimed depreciation is recaptured at up to 25%, and gains may owe capital-gains tax (a 1031 exchange can defer both). Figures are a year-1 estimate at your 24.0% rate — not tax advice; consult a CPA.
Schools (NCES district)
- District
- Orleans Parish
- NCES district ID
- 2201170
- Math proficiency
- 11% ▼ -52.00%
- Reading proficiency
- 27% ▼ -46.00%
- Median HH income
- $37,011
- Composite
- 15.78/100
- National rank
- #9271
- State rank
- #69 of 98 in LA
Livability — New Orleans
- Score
- 81/100
- State rank
- #3
- US rank
- #1383
Category grades
Schools grade is shown separately in the Schools card above.
Census & demographics
- Census place
- New Orleans, LA
- County
- Orleans Parish · 338,817 people
- City population
- 338,817
- Metro
- New Orleans-Metairie, LA
- Population (ZIP)
- 31,183
- Household income
- $90,182
- Rent vs Own
- Severe rent burden
- 1756.0
Population outlook (Orleans County) Hauer SSP2
- Today (2025)
- 513,025 people
- By 2030
- 575,781 · +12.2%
- By 2040
- 700,174 · +36.5%
- By 2050
- 826,541 · +61.1%
- By 2075
- 1,123,374 · +119.0%
- By 2100
- 1,355,609 · +164.2%
Race, ethnicity, and origin ACS 2023
- Neighborhood character
- Diverse neighborhood (Simpson 0.58)
- Race & ethnicity
- White 59% Black 26% Two or more races 8% Hispanic / Latino 7% Asian 3%
- Hispanic origin (detail)
- Mexican 1%
- Common ancestry
- Lithuanian 8% Italian 3% Slovak 3%
- Foreign-born
- 5% · Canada, China
- Languages at home
- 91% English-only · Spanish 4% French/Haitian/Cajun 2% Other Indo-European 1%
Political lean MEDSL · Orleans
- 2024 margin
- Solid D (+67.0) · D 82.2% · R 15.2% · Other 2.7%
- 2008→2024 swing
- +6.7pp toward D · 2008: 60.3pp · 2024: 67.0pp
- All cycles
- 2024: D+67.0 2020: D+68.2 2016: D+66.2 2012: D+62.5 2008: D+60.3
Not yet ingested
- Civics
- —
Market trends
- HPI YoY
- ▼ -272.08%
- Current HPI
- 287.2138
- Rent YoY
- ▼ -1.42%
- Metro
- New Orleans-Metairie, LA
- State GDP YoY
- ▲ 3.29%
- F500 in state
- 10
Industry mix (Fortune 500 HQ in LA)
| Industry | F500 HQs | Revenue |
|---|---|---|
| Telecommunications | 2 | $23B |
|
||
| Utilities | 1 | $12B |
|
||
| Wholesale / Distribution | 1 | $5B |
|
||
| Advertising | 1 | $2B |
|
||
Price history
+550.8% since first listed16 events — show timeline
- 2026-03-27 Listed $349,000 AcadianaMLS
- 2026-03-27 Listed $349,000 GSREIN
- 2026-02-23 Price Changed $349,000 AcadianaMLS
- 2026-02-23 Price Changed $349,000 GSREIN
- 2026-01-17 Rental Removed $2,200 GSREIN
- 2025-11-21 Price Changed $385,000 AcadianaMLS
- 2025-11-17 Price Changed $385,000 GSREIN
- 2025-07-17 Listed for Rent $2,200 GSREIN
- 2025-07-15 Price Changed $415,000 AcadianaMLS
- 2025-07-15 Price Changed $415,000 GSREIN
- 2025-05-24 Price Changed $424,000 AcadianaMLS
- 2025-05-24 Price Changed $424,000 GSREIN
- 2025-03-17 Listed $415,000 AcadianaMLS
- 2025-03-17 Listed $450,000 AcadianaMLS
- 2024-10-11 Listed $525,000 AcadianaMLS
- 1979-05-29 Sold (Public Records) $53,630 Public Records
Property tax history
+16.4%/yrLatest (2026): $3,233 · +1.1% YoY. Source: county tax records.
Cash-flow waterfall
monthlySold comps — $/sqft
last 12 mo · ≤1 miLoading sold comps…