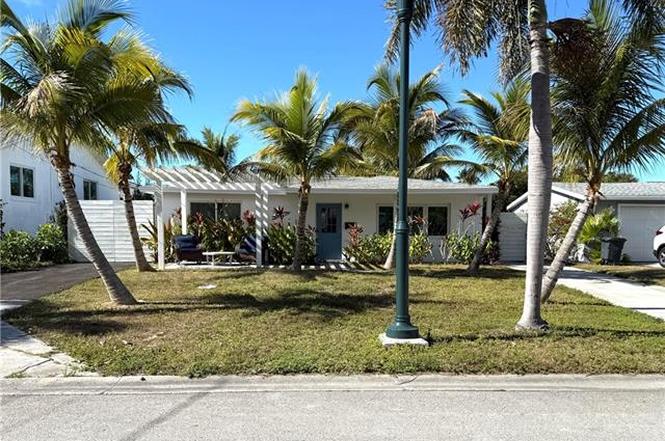
555 14th St N · Naples, FL
Flood risk 9/10 · Severe
- FEMA flood zone
- AE
- Chance of flooding over 30 yrs
- 0.99%
- Est. flood insurance / yr
- $1,737 – $8,500
Fire risk 1/10 · Minimal
- Est. fire insurance / yr
- $947 – $1,759
Heat risk 10/10 · Severe
- Hot days now (above 107°F)
- 7 days/yr
- Hot days in 30 yrs
- 27 days/yr
Wind risk 10/10 · Severe
- Chance of severe wind over 30 yrs
- 99.0%
Air-quality risk 2/10 · Minimal
- Unhealthy air days now
- 2 days/yr
- Unhealthy air days in 30 yrs
- 2 days/yr
Risk factors via First Street. Map © Google.
Why this score? — see what drove the C+ grade
The composite is a weighted blend of 9 inputs, each scored 0–100. Each bar is that input's sub-score; the figure is the points it added to the 100-point composite (weight × sub-score).
- Cash flow +21.6/30.0
- ARV discount +7.5/15.0
- Appreciation +7.0/10.0
- DSCR +6.9/10.0
- Schools +5.0/10.0
- Rent growth +4.7/5.0
- 1% rule +4.6/10.0
- Livability +4.0/5.0
- Condition / age +2.5/5.0
$695,000
🖨 Deal sheet 📄 Offer letter ✓ Due diligence
Listing remarks
Experience quiet waterfront living with Gulf access in River Park, a secluded enclave that remains one of Naples’ best-kept secrets. The River Park neighborhood is perfectly situated between the Gulfshore Playhouse, Baker Park and the Greenway and the neighborhood has its own huge Gordon River-front park with tennis, basketball, baseball and more! This modern three-bedroom waterfront residence has a rare sense of sanctuary, with wide canal water views and expansive grounds with multiple palms and large pergola invite a lifestyle of effortless relaxation. 50' of seawall frontage on wide canal with direct access to Gordon River and the Gulf. Situated just moments from the pristine
Key facts
- 50 seawall frontage
- Gulf access
- 6,534 sq ft lot
Tags
Property features AI
Finance
- Other: Property is in the River Park development; Lot described as regular; total area approximately 0.15 acres; Has waterfront (canal)
- Financial info: No investor or income/expense details provided
- HOA & community: No HOA maintenance (none); Community park; Non-gated community
Exterior
- Parking: No parking details provided
- Security: No security features listed
- Utilities: Central water; Central sewer; Cable available
- Home design: Single family residential; Florida-style; Rear exposure: West; 1 story
- Construction: Concrete block construction; Built in 1968
- Exterior features: Stucco exterior; Impact resistant windows; Windows: see remarks; Shingle roof; Canal view; Gulf access via bridges; Canal width approximately 31–80 ft
Interior
- Kitchen: Dishwasher; Disposal; Microwave; Range; Refrigerator
- Bedrooms: 3 bedrooms
- Flooring: Tile
- Bathrooms: 1 full bathroom; 1 half bathroom; Master bathroom with combo tub and shower
- Heating & cooling: Central electric heating; Central electric cooling
- Interior features: Great room floor plan; Eat-in kitchen; Open porch/lanai; See remarks for additional interior details
- Laundry & utility: Washer; Dryer
Neighborhood map
What this means for you Summary
Snapshot
- This is a 3-bed/1.5-bath single-family listed at $695k.
Deal economics
- At list price, monthly cash flow is $633 ($8k/yr) — positive.
- The deal already cash-flows at list — no discount required.
- To meet the 1% rule (rent ≥ 1% of price), the offer needs to be $666k (4.2% below list).
- Recommended offer: $632k (9.0% below list) — sets the bar for market timing.
Location & tenants
- Location reads 80/100 on livability (#126 in FL, #1,903 nationally) — a professional / high-income tenant draw. Strengths: crime A+, amenities A+, employment A+; Watch: commute D+, cost of living F.
- Market conditions: Rents rising fast (+8.8%/yr); 614 active listings in the ZIP; 31 comparable units currently listed for rent nearby; rentals at typical pace (median 24d on market — plan ~3-4 weeks tenant-placement turnaround); high-income renter base; 3,520 units permitted in Collier County in 2024 (959 in 5+ unit buildings).
- At $6,657/mo this rent would consume 61% of the median local household income ($131k/yr) (locally 333% of renters already pay >50% of income on rent) — very limited rent-growth headroom before tenants either downsize or default.
Forward outlook
- In year one you build about $33k of equity ($5k loan paydown + $28k appreciation (4.1% local appreciation)).
- Collier County population projected at +30% by 2050 — long-run rental-demand tailwind backs the buy-and-hold thesis.
- At projected returns (4.1% appreciation + 8.0% rent growth), your $195k cash investment doubles in ~4 years — after that, you're playing with house money.
- By year 2, paydown + projected appreciation supports a ~$53k cash-out refi (75% LTV) — recoverable capital for the next deal without selling this one.
Negotiation context
- It's been on market 106 days — a 9% lower offer ($632k) is reasonable based on typical stale-listing flexibility.
- 3 sale attempts since 11y ago with the ask held roughly flat each time — persistent listings suggest the price (not the market) is what's stuck; bring a comps-based counter.
Risks & watch-outs
- Watch-outs: flood insurance adds $427/mo.
- Climate carrying-cost: in FEMA flood zone AE (mandatory federal flood insurance); severe wind risk, 99% chance of damaging wind over 30y; extreme-heat days projected 7→27/yr by 2055 (HVAC capex compounding) — expect insurance premiums to compound above CPI over the hold.
Questions for the listing agent
- It's been on market 106 days. Have you received any prior offers? Is the seller open to a 9% concession, seller financing, or rate buy-down credit?
- Built in 1968 — when were the roof, HVAC, electrical panel, plumbing, and water heater last replaced?
- What's the actual annual flood-insurance premium (NFIP or private), and is the property in a SFHA with mandatory coverage?
- Why hasn't it sold? Are there any deal-killer items the seller is aware of (foundation, flood, title, zoning, code violations)?
- Is there a deadline driving the sale (1031 exchange, divorce, estate, relocation)? That informs how much negotiation room exists.
- Schools are B-rated — typically a magnet for longer-tenancy family renters. What's the average tenant stay here, and is there a school-zone premium baked into asking?
- What's the average days-on-market for RENTAL listings here right now (not sales)? A rising rental-DOM trend means longer vacancies and softer asking-rent achievability than the comps imply.
- What's the recent tenant-quality profile in this submarket — average credit score on applications, eviction rate, late-payment / NSF rate, and stable-employment percentage? A property-management company in the area should have these aggregated.
- How much new for-sale + rental construction is in the pipeline within 1–3 miles? Heavy new supply typically softens prices + rents 12–24 months out; constrained supply supports both.
Investment metrics
- 1% rule
- 0.96% ✗
- Cap rate
- 8.12%
- Cash-on-cash
- 6.53%
- DSCR
- 1.29
- GRM
- 8.7
CMA / ARV
No comps found within radius.
Projected returns pro-forma
4.08% appreciation · 8.0% rent growth · sell at horizon
- IRR
- 16.5%
- Equity multiple
- 2.03×
- Total profit
- $199,897
- Equity at exit
- $355,772
- IRR
- 19.6%
- Equity multiple
- 4.46×
- Total profit
- $672,754
- Equity at exit
- $584,621
Cash invested: $194,600 (down + closing). Projections, not guarantees.
Landlord ↔ Tenant lean methodology
- Overall (STATE)
- 87 Strongly Landlord-Friendly
- State Florida
- 87 Strongly Landlord-Friendly · R+3
- County
- — inherits STATE
- City
- — inherits STATE
ZIP-level market 34102
- Home prices YoY
- 1.3%
- Rents YoY
- 8.8%
- Active inventory
- 614
- Price-to-rent
- 8.7×
Monthly cashflow live
- Estimated rent
- $6,657 medium interval (Pro) →
- Mortgage (P&I)
- −$3,645
- Tax from tax record
- −$265 /mo · $3,182/yr
- Insurance
- −$290
- Flood insurance flood zone
- −$427 /mo · $5,118/yr
- HOA
- −$0
- Vacancy / Maint / Mgmt
- −$1,398
- Net cashflow
- $633
Break-even live
UW: 25.0% down · 7.5% · 30yr · 1.5% tax · 5.0% vac · 8.0% maint · 8.0% mgmt
Financing live
Cash to close
- Down payment
- $173,750
- Closing costs
- $20,850
- Reserves months
- —
- Total cash needed
- —
Loan-product check · same deal, 3 products live
Conventional
25% down · 7.5% · 30yr
- Down + closing
- —
- Monthly P&I
- —
- Monthly cashflow
- —
- DSCR
- —
- Eligible?
- —
Personal DTI + credit; lowest rate.
DSCR
20% down · 8.5% · 30yr
- Down + closing
- —
- Monthly P&I
- —
- Monthly cashflow
- —
- DSCR
- —
- Eligible?
- —
No personal income docs; deal must DSCR.
Hard money
10% down · 12.0% · 12mo
- Down + closing
- —
- Monthly P&I
- —
- Monthly cashflow
- —
- DSCR
- —
- Eligible?
- —
Short-term bridge; refi at stabilization.
Rent comps 31 comps
| Address | Beds | Baths | Sqft | Rent | $/sqft | DOM | Units | Dist |
|---|---|---|---|---|---|---|---|---|
| 410 Bayfront Pl Naples, FL | 1.0–3.0 | 1.0–2.0 | 1242 | $9,750 | $7.85 | 23d | 6 | 0.76mi |
| 766 Central Ave Naples, FL | 2.0–3.0 | 2.0 | 943 | $6,500 | $6.89 | 13d | 4 | 0.77mi |
| 766 Central Ave Naples, FL | 2.0–3.0 | 2.0 | 855 | $6,500 | $7.60 | 21d | 3 | 0.77mi |
| 450 Bayfront Pl Naples, FL | 1.0–3.0 | 1.0–2.5 | 1324 | $12,000 | $9.06 | 23d | 6 | 0.79mi |
| 1100 8th Ave S Naples, FL | 2.0 | 2.0 | 1218 | $9,000 | $7.39 | 13d | 5 | 1.10mi |
| 290 4th St S #202 Naples, FL | 2.0 | 2.0 | 1058 | $10,000 | $9.45 | 23d | 1 | 1.14mi |
| 282 4th St S Naples, FL | 2.0 | 2.0 | 1058 | $11,000 | $10.40 | 23d | 1 | 1.14mi |
| 286 4th St S #203 Naples, FL | 2.0 | 2.0 | 1058 | $10,000 | $9.45 | 23d | 1 | 1.14mi |
| 284 4th St S #103 Naples, FL | 2.0 | 2.0 | 979 | $9,000 | $9.19 | 23d | 1 | 1.14mi |
| 1334 Crayton Rd #1 Naples, FL | 2.0 | 2.0 | 1100 | $6,800 | $6.18 | 23d | 1 | 1.17mi |
| 1395 Curlew Ave Unit 4-3 Naples, FL | 2.0 | 2.0 | 975 | $7,000 | $7.18 | 23d | 1 | 1.18mi |
| 1435 Curlew Ave #1 Naples, FL | 2.0 | 2.0 | 975 | $2,850 | $2.92 | 23d | 1 | 1.19mi |
| 1435 Curlew Ave #1 Naples, FL | 2.0 | 2.0 | 975 | $2,850 | $2.92 | 21d | 1 | 1.19mi |
| 388 4th Ave S #388 Naples, FL | 2.0 | 2.0 | 965 | $13,000 | $13.47 | 23d | 1 | 1.21mi |
| 1100 Gulf Shore Blvd N Naples, FL | 2.0 | 2.0 | 945 | $6,000 | $6.35 | 23d | 2 | 1.24mi |
| 365 5th Ave S #303 Naples, FL | 2.0 | 2.0 | 1090 | $13,000 | $11.93 | 23d | 1 | 1.26mi |
| 230 3rd Ave S #4 Naples, FL | 2.0 | 2.5 | 978 | $12,000 | $12.27 | 23d | 1 | 1.28mi |
| 296 4th Ave S #296 Naples, FL | 2.0 | 2.5 | 1120 | $2,950 | $2.63 | 21d | 1 | 1.28mi |
| 1300 Gulf Shore Blvd N #700 Naples, FL | 2.0 | 2.0 | 850 | $6,250 | $7.35 | 23d | 1 | 1.30mi |
| 1300 Gulf Shore Blvd N #406 Naples, FL | 2.0 | 2.0 | 850 | $6,500 | $7.65 | 23d | 1 | 1.30mi |
| 1300 Gulf Shore Blvd N #205 Naples, FL | 2.0 | 2.0 | 850 | $5,900 | $6.94 | 23d | 1 | 1.30mi |
| 1300 Gulf Shore Blvd N #304 Naples, FL | 2.0 | 2.0 | 850 | $5,500 | $6.47 | 23d | 1 | 1.30mi |
| 1950 Mayfair St Naples, FL | 3.0 | 1.0–3.5 | 1514 | $11,999 | $7.92 | 13d | 109 | 1.31mi |
| 1950 Mayfair ST Unit 901 Naples, FL | 2.0 | 2.0 | 1025 | $4,560 | $4.45 | 13d | 1 | 1.33mi |
| 175 5th Ave S Naples, FL | 2.0 | 2.0 | 732 | $14,000 | $19.13 | 23d | 2 | 1.37mi |
| 351 8th Ave S #351 Naples, FL | 2.0 | 2.0 | 930 | $4,000 | $4.30 | 23d | 1 | 1.40mi |
| 666 3rd St S Naples, FL | 1.0–2.0 | 1.0–2.0 | 932 | $8,000 | $8.58 | 13d | 2 | 1.41mi |
| 250 7th Ave S #301 Naples, FL | 2.0 | 2.0 | 1000 | $10,000 | $10.00 | 23d | 1 | 1.43mi |
| 1155 Sandpiper St Naples, FL | 2.0 | 2.0 | 1062 | $3,950 | $3.72 | 21d | 3 | 1.47mi |
| 1155 Sandpiper St Naples, FL | 2.0 | 2.0 | 1062 | $4,050 | $3.81 | 23d | 2 | 1.47mi |
| 1555 Blue Point Ave Unit 3 Naples, FL | 2.0 | 2.0 | 1025 | $1,745 | $1.70 | 13d | 1 | 1.50mi |
Listing history 8 events
-
2026-05-30status $695,000 Pending 106 DOM
-
2026-02-12$695,000 Active
-
2025-07-07historical
-
2025-04-10price $649,000
-
2024-12-02$795,000 Active
-
2016-10-01historical
-
2016-04-02price $500,000
-
2015-10-15$600,000 Active
ⓘ Source: listings_history table (triggers on properties + properties_extension) + one-shot
backfill from property_details.listing_events for pre-trigger history.
Tax reassessment forecast FL · Resets to sale price
- Current annual tax
- $3,182 · $265/mo
- Projected year-2 tax
- $5,768 · $481/mo
- Expected delta
- +$2,586/yr (+$216/mo · 81.3%)
ⓘ Screening estimate from a state-policy table — verify with the county assessor before closing.
Climate risk First Street
- Flood 9/10 Extreme FEMA zone AE · 99% chance over 30 yrs
- Wildfire 1/10 Low
- Heat 10/10 Extreme 7 d/yr ≥107°F today · 27 d/yr by 30 yrs out
- Wind 10/10 Extreme 99% chance of damaging wind over 30 yrs
- Air quality 2/10 Low 2 unhealthy d/yr today · 2 by 30 yrs out
Nearby sold comps map
Loading sold comps map…
Walkable amenities ~0.75 mi
Loading nearby amenities…
Taxation est. · year 1
- Rental income
- $79,886
- − Mortgage interest
- −$38,931
- − Property taxes
- −$3,182
- − Insurance
- −$8,594
- − Repairs & maintenance
- −$6,391
- − Management
- −$6,391
- − Depreciation
- −$20,218
- Taxable loss
- −$3,821
- Est. tax savings @ 24.0%
- +$917
- After-tax cash flow
- $8,515/yr
For passive investors: Depreciation is non-cash, so a rental often shows a tax loss while cash-flowing — sheltering income. Rental losses are passive: they offset passive income freely, and up to $25,000/yr can offset ordinary (W-2) income if you actively participate and your MAGI is under $100k (phasing out to $0 by $150k); unused losses carry forward. On sale, claimed depreciation is recaptured at up to 25%, and gains may owe capital-gains tax (a 1031 exchange can defer both). Figures are a year-1 estimate at your 24.0% rate — not tax advice; consult a CPA.
Schools (NCES district)
No district data.
Livability — Naples
- Score
- 80/100
- State rank
- #126
- US rank
- #1903
Category grades
Schools grade is shown separately in the Schools card above.
Census & demographics
- Census place
- Naples, FL
- County
- Collier County · 396,295 people
- City population
- 344,941
- Metro
- Naples-Marco Island, FL
- Population (ZIP)
- 11,179
- Household income
- $130,929
- Rent vs Own
- Severe rent burden
- 333.0
Population outlook (Collier County) Hauer SSP2
- Today (2025)
- 420,858 people
- By 2030
- 450,054 · +6.9%
- By 2040
- 502,232 · +19.3%
- By 2050
- 544,932 · +29.5%
- By 2075
- 627,203 · +49.0%
- By 2100
- 659,015 · +56.6%
Race, ethnicity, and origin ACS 2023
- Neighborhood character
- Predominantly White (79%)
- Race & ethnicity
- White 79% Hispanic / Latino 9% Two or more races 8% Black 8% Asian 1%
- Hispanic origin (detail)
- Cuban 6%
- Common ancestry
- Hispanic 4% Lithuanian 4% Romanian 4%
- Foreign-born
- 17% · Canada, China
- Languages at home
- 87% English-only · Spanish 7% French/Haitian/Cajun 4% German/W. Germanic 1%
Political lean MEDSL · Collier
- 2024 margin
- Solid R (+33.1) · D 33.1% · R 66.2%
- 2008→2024 swing
- -10.6pp toward R · 2008: -22.5pp · 2024: -33.1pp
- All cycles
- 2024: R+33.1 2020: R+24.7 2016: R+26.0 2012: R+30.1 2008: R+22.5
Not yet ingested
- Civics
- —
Market trends
- HPI YoY
- ▲ 4.08%
- Current HPI
- 328.2755
- Rent YoY
- ▲ 8.75%
- Metro
- Naples-Marco Island, FL
- State GDP YoY
- ▲ 3.28%
- F500 in state
- 36
Industry mix (Fortune 500 HQ in FL)
| Industry | F500 HQs | Revenue |
|---|---|---|
| Industrial Technology | 2 | $29B |
|
||
| Insurance | 2 | $17B |
|
||
| Retail | 1 | $60B |
|
||
| Technology Distribution | 1 | $58B |
|
||
| Homebuilding | 1 | $35B |
|
||
| Technology Manufacturing | 1 | $35B |
|
||
Price history
+15.8% since first listed7 events — show timeline
- 2026-02-12 Listed $695,000 NAPLESMLS
- 2025-07-07 Listing Removed — FORTMLS
- 2025-04-10 Price Changed $649,000 FORTMLS
- 2024-12-02 Listed $795,000 FORTMLS
- 2016-10-01 Listing Removed — NAPLESMLS
- 2016-04-02 Price Changed $500,000 NAPLESMLS
- 2015-10-15 Listed $600,000 NAPLESMLS
Property tax history
+25.6%/yrLatest (2025): $3,182 · +12.0% YoY. Source: county tax records.
Cash-flow waterfall
monthlySold comps — $/sqft
last 12 mo · ≤1 miLoading sold comps…