10960 N 67th Ave #122 · Glendale, AZ
Flood risk No data
- FEMA flood zone
- —
- Chance of flooding over 30 yrs
- —
- Est. flood insurance / yr
- —
Fire risk No data
- Est. fire insurance / yr
- —
Heat risk No data
- Hot days now (above threshold)
- —
- Hot days in 30 yrs
- —
Wind risk No data
- Chance of severe wind over 30 yrs
- —
Air-quality risk No data
- Unhealthy air days now
- —
- Unhealthy air days in 30 yrs
- —
Risk factors via First Street. Map © Google.
Why this score? — see what drove the C+ grade
The composite is a weighted blend of 9 inputs, each scored 0–100. Each bar is that input's sub-score; the figure is the points it added to the 100-point composite (weight × sub-score).
- Cash flow +30.0/30.0
- 1% rule +10.0/10.0
- DSCR +10.0/10.0
- Condition / age +4.0/5.0
- Livability +3.8/5.0
- Schools +3.5/10.0
- Rent growth +2.2/5.0
- ARV discount +0.0/15.0
- Appreciation +0.0/10.0
$59,900
🖨 Deal sheet 📄 Offer letter ✓ Due diligence
Listing remarks MLS
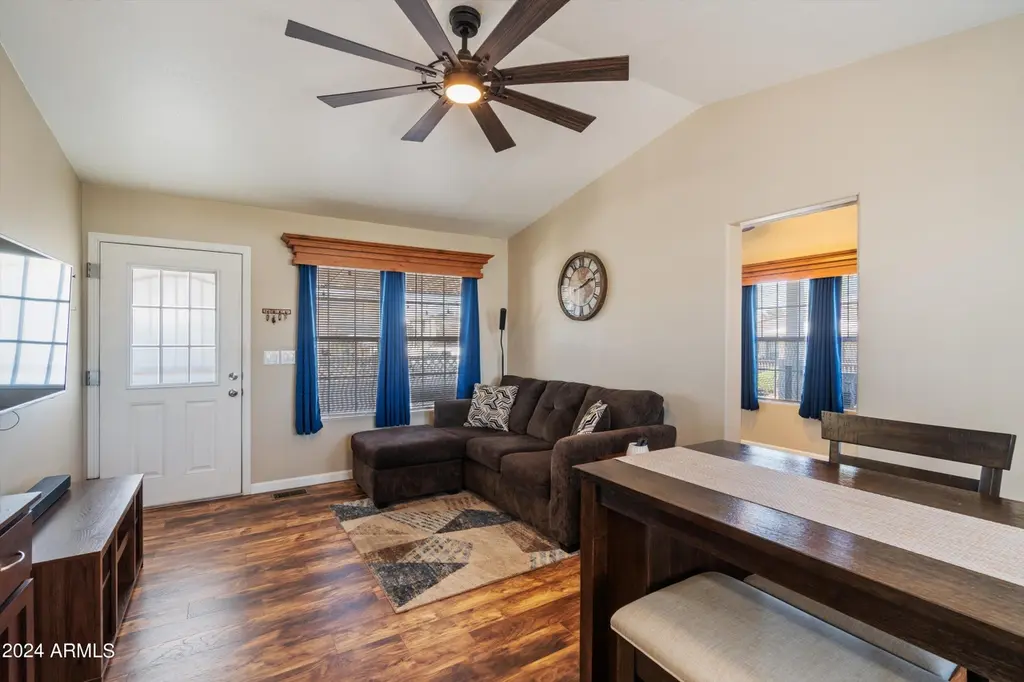
Indulge in the perfect blend of comfort and convenience with this fully furnished manufactured home. Equipped with all electronics and even a golf cart, this retreat promises effortless living. Step onto one of two spacious decks to soak up the sun or enjoy tranquil evenings under the stars. Inside, two bedrooms and two bathrooms offer ample space for relaxation. With a brand-new roof and flooring, this home exudes modern elegance & pride of ownership. Outside, the meticulously landscaped yard adds to the allure, creating a picturesque oasis. Don't let this opportunity for resort-style living pass you by!
Key facts
- Spacious decks
- New flooring
- Inspected repairs
Tags
Property features AI
Finance
- HOA & community: Monthly land lease ($921/month); Association maintains grounds; Community pool; Community spa (heated); Community laundry; Fitness center; Near bus stop
Exterior
- Parking: 2 covered parking spaces; 2 carport spaces
- Security: Gated community
- Utilities: City water; Public sewer
- Home design: Manufactured/mobile home; Leasehold ownership
- Construction: Wood frame construction; Painted exterior; Composition roof; Building area per assessor
- Exterior features: RV hookup; Partial fencing; Gravel/stone front and back; Desert front landscaping; Private maintained road
Interior
- Kitchen: Built-in microwave; Refrigerator; Dishwasher; Garbage disposal
- Bedrooms: 2 possible bedrooms
- Flooring: Laminate; Wood
- Bathrooms: 2 full bathrooms
- Heating & cooling: Electric heating; Central air conditioning
- Interior features: High speed internet; 3/4 bath in primary bedroom; Solar screens; Dual-pane windows; Bath grab bars; Storage
- Laundry & utility: Laundry inside
Neighborhood map
What this means for you Summary
Snapshot
- This is a 2-bed/2.0-bath manufactured listed at $60k. Condition is rated good.
Deal economics
- At list price, monthly cash flow is $833 ($10k/yr) — positive.
- The deal already cash-flows at list — no discount required.
- Meets the 1% rule at list price ($2k rent vs $60k).
- Cap rate 23.0% vs local median 3.5% in Glendale — top-decile yield for the area; either an underpriced asset or a hidden risk that comps aren't pricing in. Stress-test before assuming the spread holds.
Location & tenants
- Location reads 76/100 on livability (#12 in AZ, #3,235 nationally) — a middle-class / working-renter tenant base. Strengths: commute A+, housing A+, amenities B; Watch: health & safety D+, crime F.
- Peoria Unified School District (4237) (suburban): math 36% / reading 42% proficiency, ranked #64 of 249 in AZ (top 26%) — families likely to look elsewhere, expect single-tenant / working-renter base with shorter leases.
- Market conditions: Rents soft (-1.3%/yr); 125 active listings in the ZIP; 20 comparable units currently listed for rent nearby; rentals at typical pace (median 24d on market — plan ~3-4 weeks tenant-placement turnaround); solid renter incomes; 36,011 units permitted in Maricopa County in 2024 (12,801 in 5+ unit buildings).
Forward outlook
- Local home prices are declining (-3.0%/yr); year-one equity from $414 of loan paydown is wiped out by about $2k of value loss. Plan a longer hold.
- Maricopa County population projected at +38% by 2050 — long-run rental-demand tailwind backs the buy-and-hold thesis.
- At projected returns (-3.0% appreciation + 0.0% rent growth), your $17k cash investment doubles in ~2 years — after that, you're playing with house money.
Negotiation context
- Only 14 days on market — expect competitive offers; lowballing is unlikely to land.
- 4 sale attempts since 4y ago; this cycle's ask has dropped $9k (13%) from the opening price — seller is motivated, your offer sets the floor, not the list.
Questions for the listing agent
- Is there a deadline driving the sale (1031 exchange, divorce, estate, relocation)? That informs how much negotiation room exists.
- Crime grade is F in this area — have there been break-ins, vandalism, or insurance claims at this property in the last 3 years? What carrier currently insures it and at what premium?
- What's the average days-on-market for RENTAL listings here right now (not sales)? A rising rental-DOM trend means longer vacancies and softer asking-rent achievability than the comps imply.
- What's the recent tenant-quality profile in this submarket — average credit score on applications, eviction rate, late-payment / NSF rate, and stable-employment percentage? A property-management company in the area should have these aggregated.
- How much new for-sale + rental construction is in the pipeline within 1–3 miles? Heavy new supply typically softens prices + rents 12–24 months out; constrained supply supports both.
Investment metrics
- 1% rule
- 2.64% ✓
- Cap rate
- 22.98%
- Cash-on-cash
- 59.61%
- DSCR
- 3.65
- GRM
- 3.2
CMA / ARV
- ARV (on-the-fly)
- $46,512
- Comps found
- 9
Show comp detail 9 sales within ~0.75 mi
| Address | Dist | Beds/Ba | Sqft | Sold | Price | $/sf | Match |
|---|---|---|---|---|---|---|---|
| 10960 N 67th Ave #6 | 0.12mi | 2/2.0 | 792 (-3%) | 1mo | $45,000 | $57 | 88 |
| 10960 N 67th Ave Unit 103-2 | 0.10mi | 2/2.0 | 792 (-3%) | 12mo | $32,000 | $40 | 80 |
| 10960 N 67th Ave #189 | 0.12mi | 2/2.0 | 792 (-3%) | 15mo | $48,700 | $61 | 78 |
| 10960 N 67th Ave #118 | 0.10mi | 1/1.0 (-1) | 760 (-7%) | 4mo | $45,000 | $59 | 71 |
| 6960 W Peoria Ave #191 | 0.29mi | 2/2.0 | 820 (+0%) | 18mo | $48,900 | $60 | 71 |
| 10960 N 67th Ave #10 | 0.12mi | 1/1.0 (-1) | 792 (-3%) | 20mo | $42,000 | $53 | 64 |
| 6960 W Peoria Ave #2 | 0.27mi | 2/2.0 | 728 (-11%) | 8mo | $46,000 | $63 | 63 |
| 10960 N 67th Ave #174 | 0.20mi | 1/1.0 (-1) | 738 (-10%) | 5mo | $12,000 | $16 | 62 |
| 6960 W Peoria Ave #171 | 0.37mi | 2/2.0 | 924 (+13%) | 7mo | $45,000 | $49 | 55 |
Match score weights: distance 35% · size 25% · config 20% · recency 20%. Top-matched comps best support the ARV.
Projected returns pro-forma
-3.0% appreciation · 0.0% rent growth · sell at horizon
- IRR
- 54.9%
- Equity multiple
- 3.31×
- Total profit
- $38,757
- Equity at exit
- $8,931
- IRR
- 58.8%
- Equity multiple
- 6.03×
- Total profit
- $84,297
- Equity at exit
- $5,179
Cash invested: $16,772 (down + closing). Projections, not guarantees.
Landlord ↔ Tenant lean methodology
- Overall (STATE)
- 87 Strongly Landlord-Friendly
- State Arizona
- 87 Strongly Landlord-Friendly · R+3
- County
- — inherits STATE
- City
- — inherits STATE
ZIP-level market 85304
- Rents YoY
- -1.3%
- Active inventory
- 125
- Price-to-rent
- 3.2×
Monthly cashflow live
- Estimated rent
- $1,579 high interval (Pro) →
- Mortgage (P&I)
- −$314
- Tax est. 1.5%
- −$75 /mo · $898/yr
- Insurance
- −$25
- HOA
- −$0
- Vacancy / Maint / Mgmt
- −$332
- Net cashflow
- $833
Break-even live
UW: 25.0% down · 7.5% · 30yr · 1.5% tax · 5.0% vac · 8.0% maint · 8.0% mgmt
Financing live
Cash to close
- Down payment
- $14,975
- Closing costs
- $1,797
- Reserves months
- —
- Total cash needed
- —
Loan-product check · same deal, 3 products live
Conventional
25% down · 7.5% · 30yr
- Down + closing
- —
- Monthly P&I
- —
- Monthly cashflow
- —
- DSCR
- —
- Eligible?
- —
Personal DTI + credit; lowest rate.
DSCR
20% down · 8.5% · 30yr
- Down + closing
- —
- Monthly P&I
- —
- Monthly cashflow
- —
- DSCR
- —
- Eligible?
- —
No personal income docs; deal must DSCR.
Hard money
10% down · 12.0% · 12mo
- Down + closing
- —
- Monthly P&I
- —
- Monthly cashflow
- —
- DSCR
- —
- Eligible?
- —
Short-term bridge; refi at stabilization.
Rent comps 20 comps
| Address | Beds | Baths | Sqft | Rent | $/sqft | DOM | Units | Dist |
|---|---|---|---|---|---|---|---|---|
| 6960 W Peoria Ave #90 Peoria, AZ | 2.0 | 1.0 | 704 | $1,320 | $1.88 | 24d | 1 | 0.36mi |
| 10013 N 66th Ln Glendale, AZ | 3.0 | 2.0 | 1063 | $1,999 | $1.88 | 24d | 1 | 0.58mi |
| 6325 W Cheryl Dr Glendale, AZ | 2.0 | 2.0 | 1092 | $2,100 | $1.92 | 24d | 1 | 0.59mi |
| 10654 N 60th Ave Glendale, AZ | 1.0–2.0 | 1.0–2.0 | 732 | $1,475 | $2.01 | 1d | 27 | 0.77mi |
| 9350 N 67th Ave Unit B1 Glendale, AZ | 2.0 | 1.0 | 842 | $1,070 | $1.27 | 24d | 1 | 1.00mi |
| 9350 N 67th Ave Unit B2 Glendale, AZ | 2.0 | 2.0 | 970 | $1,250 | $1.29 | 43d | 1 | 1.00mi |
| 9350 N 67th Ave Unit A1 Glendale, AZ | 1.0 | 1.0 | 600 | $990 | $1.65 | 24d | 1 | 1.00mi |
| 9350 N 67th Ave Glendale, AZ | 2.0 | 2.0 | 970 | $1,385 | $1.43 | 12d | 1 | 1.01mi |
| 9350 N 67th Ave Glendale, AZ | 2.0 | 2.0 | 970 | $1,429 | $1.47 | 43d | 1 | 1.01mi |
| 9160 N 67th Ave Peoria, AZ | 2.0 | 2.0 | 1100 | $2,065 | $1.88 | 43d | 6 | 1.11mi |
| 9160 N 67th Ave Unit 212 Peoria, AZ | 2.0 | 2.0 | 992 | $1,680 | $1.69 | 24d | 1 | 1.12mi |
| 11600 N 75th Ave Peoria, AZ | 2.0 | 2.0 | 814 | $1,325 | $1.63 | 2d | 4 | 1.14mi |
| 7040 W Olive Ave #12 Peoria, AZ | 2.0 | 2.0 | 900 | $1,445 | $1.61 | 24d | 1 | 1.17mi |
| 7040 W Olive Ave Peoria, AZ | 2.0 | 2.0 | 953 | $1,465 | $1.54 | 5d | 1 | 1.27mi |
| 6201 W Olive Ave Unit A3 Glendale, AZ | 1.0 | 1.0 | 554 | $820 | $1.48 | 1d | 1 | 1.36mi |
| 6201 W Olive Ave Unit B1 Glendale, AZ | 2.0 | 1.0 | 759 | $1,225 | $1.61 | 1d | 1 | 1.36mi |
| 6201 W Olive Ave Unit A4 Glendale, AZ | 1.0 | 1.0 | 585 | $875 | $1.50 | 1d | 1 | 1.36mi |
| 6201 W Olive Ave Glendale, AZ | 1.0 | 1.0 | 585 | $960 | $1.64 | 1d | 1 | 1.42mi |
| 6201 W Olive Ave Glendale, AZ | 2.0 | 1.0 | 759 | $1,445 | $1.90 | 21d | 1 | 1.42mi |
| 6015 W Olive Ave Glendale, AZ | 2.0 | 1.0 | 800 | $1,500 | $1.88 | 1d | 16 | 1.46mi |
Listing history 11 events
-
2026-06-18days on market $59,900 Active 14 DOM
-
2026-06-17days on market $59,900 Active 13 DOM
-
2026-06-16days on market $59,900 Active 12 DOM
-
2026-06-15price $59,900 Active 11 DOM
-
2026-06-15days on market $69,000 Active 11 DOM
-
2026-06-13days on market $69,000 Active 9 DOM
-
2026-06-13days on market $69,000 Active 8 DOM
-
2026-06-09days on market $69,000 Active 5 DOM
-
2026-06-08days on market $69,000 Active 4 DOM
-
2026-06-07remarks 695-char remark
-
2026-06-07$69,000 Active 3 DOM
ⓘ Source: listings_history table (triggers on properties + properties_extension) + one-shot
backfill from property_details.listing_events for pre-trigger history.
Nearby sold comps map
Loading sold comps map…
Walkable amenities ~0.75 mi
Loading nearby amenities…
Taxation est. · year 1
- Rental income
- $18,944
- − Mortgage interest
- −$3,355
- − Property taxes
- −$898
- − Insurance
- −$300
- − Repairs & maintenance
- −$1,516
- − Management
- −$1,516
- − Depreciation
- −$1,743
- Taxable income
- $9,617
- Est. tax owed @ 24.0%
- −$2,308
- After-tax cash flow
- $7,690/yr
For passive investors: Depreciation is non-cash, so a rental often shows a tax loss while cash-flowing — sheltering income. Rental losses are passive: they offset passive income freely, and up to $25,000/yr can offset ordinary (W-2) income if you actively participate and your MAGI is under $100k (phasing out to $0 by $150k); unused losses carry forward. On sale, claimed depreciation is recaptured at up to 25%, and gains may owe capital-gains tax (a 1031 exchange can defer both). Figures are a year-1 estimate at your 24.0% rate — not tax advice; consult a CPA.
Condition & rehab AI · 13 photos
This fully furnished manufactured home is in good condition with a new roof and modern appliances. It offers a good balance of comfort and convenience, making it an attractive option for both resale and rental.
Value-add opportunities
- Resale Paint exterior — Enhances curb appeal
- Rental Trim bushes — Maintains property value
Renovation cost estimate screening
Value-add ROI direction
- Resale Paint exterior — Enhances curb appeal ↑
- Rental Trim bushes — Maintains property value ↑
ⓘ Cost ranges are severity-bucket heuristics (US national rule-of-thumb). Get contractor quotes + a written scope before underwriting a rehab budget.
Schools (NCES district)
- District
- Peoria Unified School District (4237)
- NCES district ID
- 0406250
- Math proficiency
- 36% ▼ -14.00%
- Reading proficiency
- 42% ▼ -8.00%
- Median HH income
- $60,171
- Composite
- 34.62/100
- National rank
- #5152
- State rank
- #64 of 249 in AZ
Livability — Glendale
- Score
- 76/100
- State rank
- #12
- US rank
- #3235
Category grades
Schools grade is shown separately in the Schools card above.
Census & demographics
- Census place
- Glendale, AZ
- County
- Maricopa County · 4,537,380 people
- City population
- 294,586
- Metro
- Phoenix-Mesa-Chandler, AZ
- Population (ZIP)
- 29,861
- Household income
- $86,927
- Rent vs Own
- Severe rent burden
- 640.0
Population outlook (Maricopa County) Hauer SSP2
- Today (2025)
- 4,979,203 people
- By 2030
- 5,378,229 · +8.0%
- By 2040
- 6,156,598 · +23.6%
- By 2050
- 6,872,376 · +38.0%
- By 2075
- 8,401,270 · +68.7%
- By 2100
- 9,247,439 · +85.7%
Race, ethnicity, and origin ACS 2023
- Neighborhood character
- Majority White (61%)
- Race & ethnicity
- White 61% Hispanic / Latino 30% Two or more races 16% Black 2% Asian 2% Native American 2%
- Hispanic origin (detail)
- Mexican 24%
- Common ancestry
- Lithuanian 3% Romanian 2% Portuguese 2%
- Foreign-born
- 7% · Canada, Vietnam, China
- Languages at home
- 83% English-only · Spanish 14% Other Indo-European 1% Vietnamese 1%
Political lean MEDSL · Maricopa
- 2024 margin
- Toss-up / Even · D 47.7% · R 51.2% · Other 1.1%
- 2008→2024 swing
- +7.1pp toward D · 2008: -10.6pp · 2024: -3.5pp
- All cycles
- 2024: R+3.5 2020: D+2.2 2016: R+3.5 2012: R+12.0 2008: R+10.6
Not yet ingested
- Civics
- —
Market trends
- HPI YoY
- ▼ -259.68%
- Current HPI
- 310.0679
- Rent YoY
- ▼ -1.30%
- Metro
- Phoenix-Mesa-Chandler, AZ
- State GDP YoY
- ▲ 4.54%
- F500 in state
- 20
Industry mix (Fortune 500 HQ in AZ)
| Industry | F500 HQs | Revenue |
|---|---|---|
| Technology | 2 | $13B |
|
||
| Mining / Metals | 1 | $23B |
|
||
| Environmental Services | 1 | $16B |
|
||
| Metals / Steel | 1 | $14B |
|
||
| Technology Distribution | 1 | $9B |
|
||
| Homebuilding | 1 | $8B |
|
||
Price history
+0.7% since first listed11 events — show timeline
- 2026-06-04 Listed $69,000 ARMLS
- 2025-09-29 Listing Removed — ARMLS
- 2025-02-02 Price Changed $79,000 ARMLS
- 2024-08-29 Price Changed $84,000 ARMLS
- 2024-08-06 Listed $89,000 ARMLS
- 2024-04-29 Sold (MLS) $84,000 ARMLS
- 2024-04-16 Pending — ARMLS
- 2024-04-05 Listed $84,000 ARMLS
- 2022-07-21 Sold (MLS) $64,500 ARMLS
- 2022-06-27 Contingent — ARMLS
- 2022-05-31 Listed $68,500 ARMLS
Cash-flow waterfall
monthlySold comps — $/sqft
last 12 mo · ≤1 miLoading sold comps…