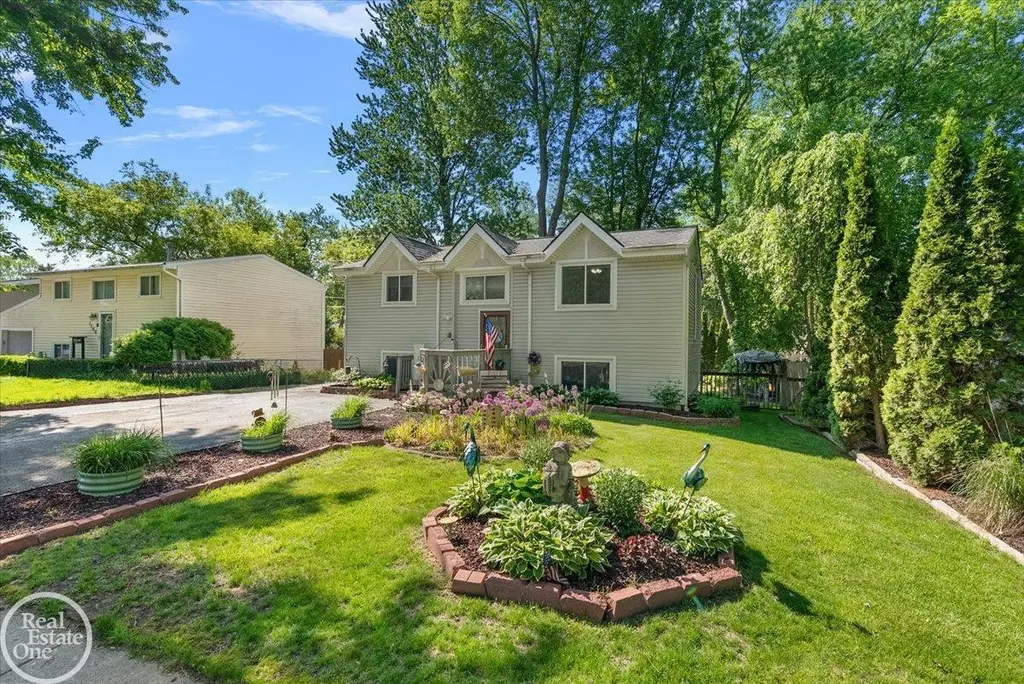
1136 Miller Rd · Orion, MI
Flood risk 6/10 · Moderate
- FEMA flood zone
- X (unshaded)
- Chance of flooding over 30 yrs
- 0.69%
- Est. flood insurance / yr
- $473 – $860
Fire risk 1/10 · Minimal
- Est. fire insurance / yr
- $784 – $1,456
Heat risk 2/10 · Minimal
- Hot days now (above 96°F)
- 7 days/yr
- Hot days in 30 yrs
- 15 days/yr
Wind risk 2/10 · Minimal
- Chance of severe wind over 30 yrs
- —
Air-quality risk 3/10 · Minor
- Unhealthy air days now
- 2 days/yr
- Unhealthy air days in 30 yrs
- 4 days/yr
Risk factors via First Street. Map © Google.
Why this score? — see what drove the C- grade
The composite is a weighted blend of 9 inputs, each scored 0–100. Each bar is that input's sub-score; the figure is the points it added to the 100-point composite (weight × sub-score).
- Cash flow +24.2/30.0
- DSCR +7.8/10.0
- 1% rule +5.3/10.0
- ARV discount +5.1/15.0
- Schools +5.1/10.0
- Rent growth +2.5/5.0
- Livability +2.5/5.0
- Condition / age +2.5/5.0
- Appreciation +0.0/10.0
$320,000
🖨 Deal sheet 📄 Offer letter ✓ Due diligence
Listing remarks MLS
Charming 4-bedroom, 2 full-bath home in sought-after Lake Orion with optional Bunny Run Association membership offering lake access. The updated kitchen features granite countertops, vaulted ceilings, and all appliances included. Built-ins throughout the home provide added storage and organization. Major mechanical updates are already complete with a new furnace, A/C, and whole-house generator for added peace of mind. Generous living spaces lead to a deck overlooking the beautifully landscaped, fully fenced backyard — a private setting perfect for entertaining or simply relaxing outdoors.
Key facts
- New furnace
- Updated kitchen
- Lake access
Tags
Property features AI
Finance
- Other: Located near Miller Rd / S Conklin Rd
- HOA & community: Homeowners association; Subdivision: BUNNY RUN COUNTRY CLUB ANNEX
Exterior
- Utilities: Private well water; Public sewer
- Home design: Single-family residence; Two stories
- Construction: Vinyl siding; Slab foundation; Built with above-grade finished living area
- Exterior features: Deck; Lot approximately 60 x 110
Interior
- Kitchen: Microwave; Oven; Range; Refrigerator; Dishwasher
- Bathrooms: 2 full bathrooms
- Heating & cooling: Forced air heating (natural gas); Central air conditioning; Ceiling fans
- Interior features: Gas water heater; Disposal; Water softener (owned)
- Laundry & utility: Washer; Dryer
Neighborhood map
What this means for you Summary
Snapshot
- This is a 3-bed/2.0-bath single-family listed at $320k.
Deal economics
- At list price, monthly cash flow is $637 ($8k/yr) — positive.
- The deal already cash-flows at list — no discount required.
- Meets the 1% rule at list price ($3k rent vs $320k).
- Recommended offer: $315k (1.5% below list) — sets the bar for market timing.
Location & tenants
- Location reads: area grade C — affects rentability + tenant quality, not the cash-flow math above.
- Lake Orion Community Schools (suburban): math 49% / reading 64% proficiency, ranked #45 of 540 in MI (top 8%) — acceptable for families but not a draw, mixed tenant base, ~2y average lease; only 16% free/reduced lunch — higher-income household profile.
- Market conditions: 88 active listings in the ZIP; 4 comparable units currently listed for rent nearby; rentals at typical pace (median 15d on market — plan ~3-4 weeks tenant-placement turnaround); 2,614 units permitted in Oakland County in 2024 (721 in 5+ unit buildings).
Forward outlook
- Local home prices are declining (-3.0%/yr); year-one equity from $2k of loan paydown is wiped out by about $10k of value loss. Plan a longer hold.
- Oakland County population projected at +10% by 2050 — modest demand growth; plan on rents tracking national, not racing it.
Negotiation context
- It's been on market 20 days — a 2% lower offer ($315k) is reasonable based on typical stale-listing flexibility.
- 7 sale attempts since 27y ago with the ask held roughly flat each time — persistent listings suggest the price (not the market) is what's stuck; bring a comps-based counter.
- Current owner paid $146k; list at $320k implies a 119% gain — meaningful room to come down on a strong offer.
Risks & watch-outs
- Climate carrying-cost: major flood risk — expect insurance premiums to compound above CPI over the hold.
Questions for the listing agent
- Built in 1975 — when were the roof, HVAC, electrical panel, plumbing, and water heater last replaced?
- Is there a deadline driving the sale (1031 exchange, divorce, estate, relocation)? That informs how much negotiation room exists.
- What's the average days-on-market for RENTAL listings here right now (not sales)? A rising rental-DOM trend means longer vacancies and softer asking-rent achievability than the comps imply.
- What's the recent tenant-quality profile in this submarket — average credit score on applications, eviction rate, late-payment / NSF rate, and stable-employment percentage? A property-management company in the area should have these aggregated.
- How much new for-sale + rental construction is in the pipeline within 1–3 miles? Heavy new supply typically softens prices + rents 12–24 months out; constrained supply supports both.
Investment metrics
- 1% rule
- 1.03% ✓
- Cap rate
- 8.68%
- Cash-on-cash
- 8.53%
- DSCR
- 1.38
- GRM
- 8.1
CMA / ARV
- ARV (on-the-fly)
- $303,552
- Comps found
- 12
Show comp detail 12 sales within ~0.75 mi
| Address | Dist | Beds/Ba | Sqft | Sold | Price | $/sf | Match |
|---|---|---|---|---|---|---|---|
| 1155 Seabury Dr | 0.07mi | 3/1.0 | 1,568 (-4%) | 3mo | $315,000 | $201 | 84 |
| 55 Mouton Dr | 0.17mi | 3/2.0 | 1,416 (-13%) | 5mo | $150,000 | $106 | 65 |
| 293 Clairemont Dr | 0.41mi | 3/1.5 | 1,716 (+5%) | 7mo | $320,000 | $186 | 64 |
| 490 Glenn Ct | 0.59mi | 3/2.0 | 1,785 (+9%) | 1mo | $350,000 | $196 | 56 |
| 506 N Conklin Rd | 0.46mi | 3/2.0 | 1,843 (+13%) | 5mo | $229,900 | $125 | 53 |
| 1379 Walter S Hall Dr | 0.59mi | 3/2.0 | 1,515 (-7%) | 10mo | $281,400 | $186 | 52 |
| 577 Bagley St | 0.53mi | 4/1.5 (+1) | 1,526 (-6%) | 8mo | $330,100 | $216 | 50 |
| 132 Florence St | 0.52mi | 3/2.5 | 1,387 (-15%) | 3mo | $335,000 | $242 | 47 |
| 216 E Flint St | 0.73mi | 4/1.0 (+1) | 1,536 (-6%) | 8mo | $278,000 | $181 | 40 |
| 1373 Joan Dr | 0.53mi | 4/1.5 (+1) | 1,853 (+14%) | 8mo | $334,500 | $181 | 39 |
| 388 Norland St | 0.58mi | 4/2.0 (+1) | 1,390 (-15%) | 6mo | $198,000 | $142 | 38 |
| 400 E Flint St | 0.64mi | 4/1.5 (+1) | 1,872 (+15%) | 4mo | $290,000 | $155 | 35 |
Match score weights: distance 35% · size 25% · config 20% · recency 20%. Top-matched comps best support the ARV.
Projected returns pro-forma
-3.0% appreciation · 3.0% rent growth · sell at horizon
- IRR
- -3.4%
- Equity multiple
- 0.87×
- Total profit
- $-11,405
- Equity at exit
- $47,713
- IRR
- 6.3%
- Equity multiple
- 1.47×
- Total profit
- $41,888
- Equity at exit
- $27,668
Cash invested: $89,600 (down + closing). Projections, not guarantees.
Landlord ↔ Tenant lean methodology
- Overall (STATE)
- 62 Landlord-Friendly
- State Michigan
- 62 Landlord-Friendly · EVEN
- County
- — inherits STATE
- City
- — inherits STATE
ZIP-level market 48362
- Active inventory
- 88
- Price-to-rent
- 8.1×
Monthly cashflow live
- Estimated rent
- $3,305 medium interval (Pro) →
- Mortgage (P&I)
- −$1,678
- Tax from tax record
- −$163 /mo · $1,956/yr
- Insurance
- −$133
- HOA
- −$0
- Vacancy / Maint / Mgmt
- −$694
- Net cashflow
- $637
Break-even live
UW: 25.0% down · 7.5% · 30yr · 1.5% tax · 5.0% vac · 8.0% maint · 8.0% mgmt
Financing live
Cash to close
- Down payment
- $80,000
- Closing costs
- $9,600
- Reserves months
- —
- Total cash needed
- —
Loan-product check · same deal, 3 products live
Conventional
25% down · 7.5% · 30yr
- Down + closing
- —
- Monthly P&I
- —
- Monthly cashflow
- —
- DSCR
- —
- Eligible?
- —
Personal DTI + credit; lowest rate.
DSCR
20% down · 8.5% · 30yr
- Down + closing
- —
- Monthly P&I
- —
- Monthly cashflow
- —
- DSCR
- —
- Eligible?
- —
No personal income docs; deal must DSCR.
Hard money
10% down · 12.0% · 12mo
- Down + closing
- —
- Monthly P&I
- —
- Monthly cashflow
- —
- DSCR
- —
- Eligible?
- —
Short-term bridge; refi at stabilization.
Rent comps 4 comps
| Address | Beds | Baths | Sqft | Rent | $/sqft | DOM | Units | Dist |
|---|---|---|---|---|---|---|---|---|
| 733 Luna Ct Lake Orion, MI | 3.0 | 1.5 | 1177 | $2,695 | $2.29 | 19d | 1 | 0.33mi |
| 120 S Broadway St Lake Orion, MI | 2.0 | 2.0 | 1065 | $2,950 | $2.77 | 14d | 1 | 0.90mi |
| 442 Mystic Cove Ln Lake Orion, MI | 2.0–4.0 | 2.0–3.0 | 1989 | $5,350 | $2.69 | 1d | 4 | 1.05mi |
| 711 Kimberly Lake Orion, MI | 1.0–2.0 | 1.0–1.5 | 985 | $1,149 | $1.17 | 1d | 6 | 1.34mi |
Listing history 13 events
-
2026-06-18days on market $320,000 Active 20 DOM
-
2026-06-17days on market $320,000 Active 19 DOM
-
2026-06-16days on market $320,000 Active 18 DOM
-
2026-06-15days on market $320,000 Active 17 DOM
-
2026-06-13days on market $320,000 Active 15 DOM
-
2026-06-09days on market $320,000 Active 11 DOM
-
2026-06-08days on market $320,000 Active 10 DOM
-
2026-06-07days on market $320,000 Active 9 DOM
-
2026-06-04days on market $320,000 Active 6 DOM
-
2026-06-03days on market $320,000 Active 5 DOM
-
2026-06-02days on market $320,000 Active 4 DOM
-
2026-06-01days on market $320,000 Active 3 DOM
-
2026-05-31days on market $320,000 Active 2 DOM
ⓘ Source: listings_history table (triggers on properties + properties_extension) + one-shot
backfill from property_details.listing_events for pre-trigger history.
Tax reassessment forecast MI · Partial reset (capped growth)
- Current annual tax
- $1,956 · $163/mo
- Projected year-2 tax
- $3,442 · $287/mo
- Expected delta
- +$1,486/yr (+$124/mo · 76.0%)
ⓘ Screening estimate from a state-policy table — verify with the county assessor before closing.
Climate risk First Street
- Flood 6/10 Major FEMA zone X (unshaded) · 69% chance over 30 yrs
- Wildfire 1/10 Low
- Heat 2/10 Low 7 d/yr ≥96°F today · 15 d/yr by 30 yrs out
- Wind 2/10 Low
- Air quality 3/10 Moderate 2 unhealthy d/yr today · 4 by 30 yrs out
Nearby sold comps map
Loading sold comps map…
Walkable amenities ~0.75 mi
Loading nearby amenities…
Taxation est. · year 1
- Rental income
- $39,662
- − Mortgage interest
- −$17,925
- − Property taxes
- −$1,956
- − Insurance
- −$1,600
- − Repairs & maintenance
- −$3,173
- − Management
- −$3,173
- − Depreciation
- −$9,309
- Taxable income
- $2,525
- Est. tax owed @ 24.0%
- −$606
- After-tax cash flow
- $7,033/yr
For passive investors: Depreciation is non-cash, so a rental often shows a tax loss while cash-flowing — sheltering income. Rental losses are passive: they offset passive income freely, and up to $25,000/yr can offset ordinary (W-2) income if you actively participate and your MAGI is under $100k (phasing out to $0 by $150k); unused losses carry forward. On sale, claimed depreciation is recaptured at up to 25%, and gains may owe capital-gains tax (a 1031 exchange can defer both). Figures are a year-1 estimate at your 24.0% rate — not tax advice; consult a CPA.
Schools (NCES district)
- District
- Lake Orion Community Schools
- NCES district ID
- 2620730
- Math proficiency
- 49% ▼ -10.00%
- Reading proficiency
- 64% ▼ -10.00%
- Median HH income
- $82,396
- Composite
- 51.21/100
- National rank
- #1755
- State rank
- #45 of 540 in MI
Livability — Orion
No livability data for this city. (Only ~50 U.S. cities are tracked.)
Census & demographics
- City population
- 10,401
- Population (ZIP)
- 14,746
Population outlook (Oakland County) Hauer SSP2
- Today (2025)
- 1,335,747 people
- By 2030
- 1,375,100 · +2.9%
- By 2040
- 1,435,385 · +7.5%
- By 2050
- 1,469,250 · +10.0%
- By 2075
- 1,531,946 · +14.7%
- By 2100
- 1,450,485 · +8.6%
Race, ethnicity, and origin ACS 2023
- Neighborhood character
- Predominantly White (88%)
- Race & ethnicity
- White 88% Two or more races 5% Hispanic / Latino 4% Black 2% Asian 2%
- Common ancestry
- Romanian 11% Lithuanian 5% Slovak 3%
- Foreign-born
- 6% · Canada, China, Dominican Republic
- Languages at home
- 95% English-only · Spanish 1% Chinese 1% German/W. Germanic 1%
Political lean MEDSL · Oakland
- 2024 margin
- D (+10.6) · D 54.4% · R 43.8% · Other 1.9%
- 2008→2024 swing
- -3.9pp toward R · 2008: 14.5pp · 2024: 10.6pp
- All cycles
- 2024: D+10.6 2020: D+14.1 2016: D+8.1 2012: D+8.1 2008: D+14.5
Not yet ingested
- Civics
- —
Market trends
- HPI YoY
- ▼ -307.96%
- Current HPI
- 182.3653
- Rent YoY
- —
- Metro
- —
- State GDP YoY
- ▲ 1.37%
- F500 in state
- 28
Industry mix (Fortune 500 HQ in MI)
| Industry | F500 HQs | Revenue |
|---|---|---|
| Automotive Parts | 3 | $48B |
|
||
| Automotive | 2 | $372B |
|
||
| Chemicals | 1 | $45B |
|
||
| Automotive Retail | 1 | $29B |
|
||
| Healthcare / Medical Devices | 1 | $23B |
|
||
| Automotive Technology | 1 | $20B |
|
||
Price history
+364.4% since first listed15 events — show timeline
- 2026-05-29 Listed $320,000 MiRealSource-MiMLS
- 2026-05-29 Listed $320,000 REALCOMP
- 2002-04-08 Sold (Public Records) $146,000 Public Records
- 2002-03-25 Sold (MLS) $146,000 REALCOMP
- 2002-02-10 Listed $147,000 REALCOMP
- 2002-02-06 Listing Removed — REALCOMP
- 2002-02-06 Listed $147,000 REALCOMP
- 2002-01-31 Listing Removed — REALCOMP
- 2001-10-31 Listing Removed — REALCOMP
- 2001-10-02 Listed $147,000 REALCOMP
- 2001-07-21 Listed $149,900 REALCOMP
- 1999-09-17 Sold (Public Records) $137,000 Public Records
- 1999-08-18 Sold (MLS) $136,000 REALCOMP
- 1999-07-07 Listed $139,900 REALCOMP
- 1992-07-14 Sold (Public Records) $68,900 Public Records
Property tax history
+3.5%/yrLatest (2025): $1,956 · +2.6% YoY. Source: county tax records.
Cash-flow waterfall
monthlySold comps — $/sqft
last 12 mo · ≤1 miLoading sold comps…