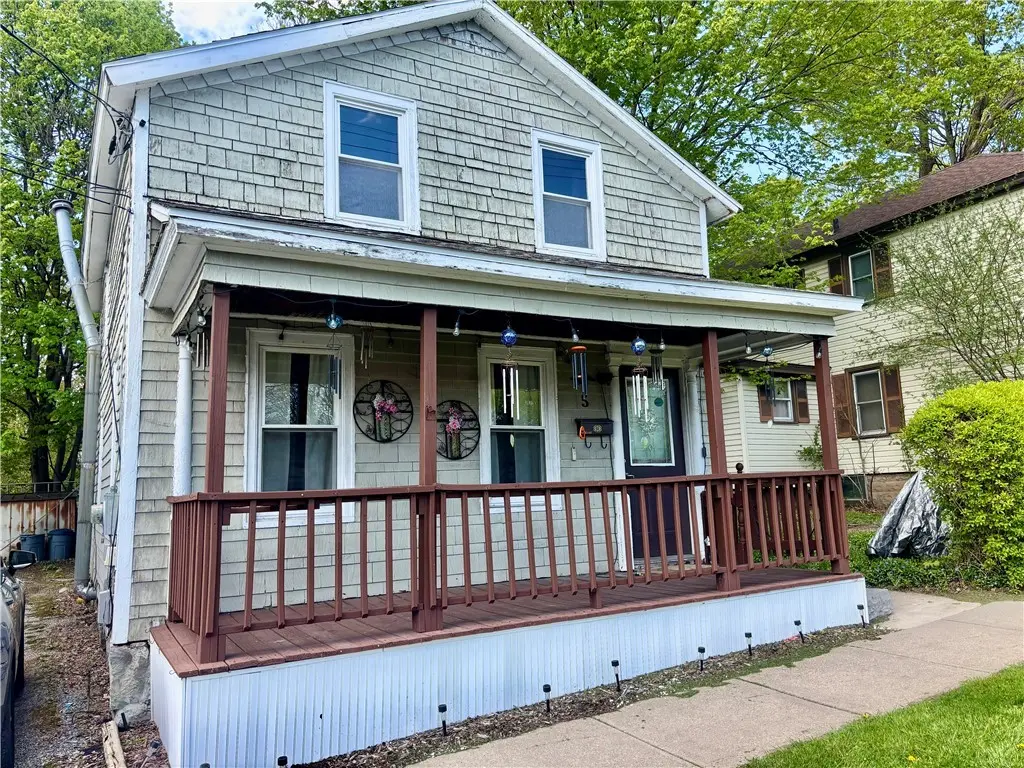
5 Seymour St · Auburn, NY
Flood risk 1/10 · Minimal
- FEMA flood zone
- X (unshaded)
- Chance of flooding over 30 yrs
- 0.0%
- Est. flood insurance / yr
- $473 – $860
Fire risk 1/10 · Minimal
- Est. fire insurance / yr
- $691 – $1,283
Heat risk 2/10 · Minimal
- Hot days now (above 95°F)
- 7 days/yr
- Hot days in 30 yrs
- 15 days/yr
Wind risk 1/10 · Minimal
- Chance of severe wind over 30 yrs
- 1.0%
Air-quality risk 2/10 · Minimal
- Unhealthy air days now
- 0 days/yr
- Unhealthy air days in 30 yrs
- 1 days/yr
Risk factors via First Street. Map © Google.
Why this score? — see what drove the B- grade
The composite is a weighted blend of 9 inputs, each scored 0–100. Each bar is that input's sub-score; the figure is the points it added to the 100-point composite (weight × sub-score).
- Cash flow +30.0/30.0
- 1% rule +10.0/10.0
- DSCR +10.0/10.0
- ARV discount +7.5/15.0
- Livability +3.7/5.0
- Schools +3.0/10.0
- Rent growth +2.5/5.0
- Condition / age +2.5/5.0
- Appreciation +0.0/10.0
$79,900
🖨 Deal sheet 📄 Offer letter ✓ Due diligence
Listing remarks
Cozy three-bedroom home located in the heart of Auburn NY. Great starter or investment property. The first floor has a nice open concept. The living room, family room and formal dining room with French doors are good in size. The kitchen has original wood cabinets and a new stainless-steel oven. A good size first floor bedroom and first floor laundry with a mudroom offer convivence. Ample storage on the first floor is a bonus. The second floor has a full bath and two good size bedrooms. One bedroom will need to be renovated. The flooring throughout is carpet and vinyl flooring. The exterior is wood and will need some paint. The small yard is fully fenced with low maintenance. With a covered
Key facts
- Open concept
- First floor laundry
- Fully fenced yard
Tags
Property features AI
Exterior
- Parking: No garage
- Utilities: Public water connected; Sewer connected; Cable available; High-speed internet available; Circuit breaker electric
- Home design: Single-story home; Resale property; Entry level: main; Facing direction: not specified
- Construction: Frame construction with shake siding; Stone foundation; Existing (previously built) condition
- Exterior features: Fully fenced yard; Open porch; Gravel driveway; Near public transit; Rectangular residential lot; City street frontage
Interior
- Kitchen: Gas oven; Gas range; Refrigerator
- Bedrooms: One bedroom on the main level
- Flooring: Carpet; Vinyl; Varied flooring
- Bathrooms: One full bathroom
- Heating & cooling: Gas forced-air heating
- Interior features: Separate/formal dining room; Separate/formal living room; Galley kitchen; Pantry; Storage; See remarks
- Laundry & utility: Laundry on the main level; Gas water heater
Neighborhood map
What this means for you Summary
Snapshot
- This is a 3-bed/1.0-bath single-family listed at $80k.
Deal economics
- At list price, monthly cash flow is $857 ($10k/yr) — positive.
- The deal already cash-flows at list — no discount required.
- Meets the 1% rule at list price ($2k rent vs $80k).
- Recommended offer: $78k (3.0% below list) — sets the bar for market timing.
- Cap rate 19.2% vs local median 7.6% in Auburn — top-decile yield for the area; either an underpriced asset or a hidden risk that comps aren't pricing in. Stress-test before assuming the spread holds.
Location & tenants
- Location reads 74/100 on livability (#298 in NY, #4,814 nationally) — a middle-class / working-renter tenant base. Strengths: cost of living A+, housing A+, health & safety A+; Watch: schools D, amenities D-, commute F.
- Auburn City School District (town): math 31% / reading 39% proficiency, ranked #558 of 590 in NY (top 95%) — families likely to look elsewhere, expect single-tenant / working-renter base with shorter leases.
- Market conditions: 221 active listings in the ZIP; 161 units permitted in Cayuga County in 2024 (65 in 5+ unit buildings).
- This rent runs 35% of the median local income ($61k/yr) — at the standard rent-burdened threshold; future hikes will face affordability resistance.
Forward outlook
- Local home prices are declining (-3.0%/yr); year-one equity from $552 of loan paydown is wiped out by about $2k of value loss. Plan a longer hold.
- Cayuga County population projected at -18% by 2050 — secular population decline; favor cash flow + early exit over multi-decade hold.
- At projected returns (-3.0% appreciation + 3.0% rent growth), your $22k cash investment doubles in ~3 years — after that, you're playing with house money.
Negotiation context
- It's been on market 45 days — a 3% lower offer ($78k) is reasonable based on typical stale-listing flexibility.
- Current owner paid $26k; list at $80k implies a 203% gain — meaningful room to come down on a strong offer.
Risks & watch-outs
- Watch-outs: built in 1891 — expect roof / HVAC / electrical / plumbing capex.
Questions for the listing agent
- It's been on market 45 days. Have you received any prior offers? Is the seller open to a 3% concession, seller financing, or rate buy-down credit?
- Built in 1891 — when were the roof, HVAC, electrical panel, plumbing, and water heater last replaced?
- Is there a deadline driving the sale (1031 exchange, divorce, estate, relocation)? That informs how much negotiation room exists.
- Schools are D-rated, which usually means shorter tenancies and higher turnover. Who's the typical renter profile here, and what's been the actual vacancy rate?
- What's the average days-on-market for RENTAL listings here right now (not sales)? A rising rental-DOM trend means longer vacancies and softer asking-rent achievability than the comps imply.
- What's the recent tenant-quality profile in this submarket — average credit score on applications, eviction rate, late-payment / NSF rate, and stable-employment percentage? A property-management company in the area should have these aggregated.
- How much new for-sale + rental construction is in the pipeline within 1–3 miles? Heavy new supply typically softens prices + rents 12–24 months out; constrained supply supports both.
Investment metrics
- 1% rule
- 2.23% ✓
- Cap rate
- 19.16%
- Cash-on-cash
- 45.96%
- DSCR
- 3.04
- GRM
- 3.7
CMA / ARV
- ARV (median comp)
- $172,913
- List price
- $79,900
- Delta
- -53.79%
- Verdict
- UNDERPRICED
- Comps
- 20 within 1.0 mi
Show comp detail 12 sales within ~0.75 mi
| Address | Dist | Beds/Ba | Sqft | Sold | Price | $/sf | Match |
|---|---|---|---|---|---|---|---|
| 65 Perry St | 0.30mi | 3/1.5 | 1,226 (+1%) | 2mo | $145,000 | $118 | 81 |
| 445 N Seward Ave | 0.43mi | 3/1.0 | 1,288 (+6%) | 6mo | $185,000 | $144 | 65 |
| 84 Grant Ave | 0.21mi | 3/2.0 | 1,088 (-10%) | 8mo | $149,400 | $137 | 62 |
| 43 Ross St | 0.45mi | 3/1.5 | 1,100 (-10%) | 2mo | $181,000 | $165 | 60 |
| 17 North Park | 0.43mi | 3/1.5 | 1,308 (+8%) | 7mo | $195,000 | $149 | 59 |
| 124 Curtis Pl | 0.48mi | 3/1.5 | 1,295 (+6%) | 8mo | $165,000 | $127 | 59 |
| 38 Dayton St | 0.67mi | 3/1.0 | 1,260 (+4%) | 8mo | $179,900 | $143 | 56 |
| 39 Standart Ave | 0.62mi | 3/1.0 | 1,137 (-6%) | 7mo | $130,000 | $114 | 54 |
| 10 Maple St | 0.57mi | 2/1.0 (-1) | 1,113 (-8%) | 2mo | $136,000 | $122 | 52 |
| 42 Seminary St | 0.34mi | 2/1.0 (-1) | 1,396 (+15%) | 3mo | $63,000 | $45 | 52 |
| 160 S Seward Ave | 0.71mi | 4/1.5 (+1) | 1,352 (+11%) | 5mo | $190,000 | $141 | 38 |
| 82 Bradford St | 0.69mi | 2/1.5 (-1) | 1,076 (-12%) | 6mo | $171,500 | $159 | 36 |
Match score weights: distance 35% · size 25% · config 20% · recency 20%. Top-matched comps best support the ARV.
Projected returns pro-forma
-3.0% appreciation · 3.0% rent growth · sell at horizon
- IRR
- 43.2%
- Equity multiple
- 2.86×
- Total profit
- $41,648
- Equity at exit
- $11,913
- IRR
- 49.2%
- Equity multiple
- 5.77×
- Total profit
- $106,642
- Equity at exit
- $6,908
Cash invested: $22,372 (down + closing). Projections, not guarantees.
Landlord ↔ Tenant lean methodology
- Overall (STATE)
- 15 Strongly Tenant-Friendly
- State New York
- 15 Strongly Tenant-Friendly · D+10
- County
- — inherits STATE
- City
- — inherits STATE
ZIP-level market 13021
- Home prices YoY
- -22.4%
- Active inventory
- 221
- Price-to-rent
- 3.7×
Monthly cashflow live
- Estimated rent
- $1,785 medium interval (Pro) →
- Mortgage (P&I)
- −$419
- Tax from tax record
- −$101 /mo · $1,209/yr
- Insurance
- −$33
- HOA
- −$0
- Vacancy / Maint / Mgmt
- −$375
- Net cashflow
- $857
Break-even live
UW: 25.0% down · 7.5% · 30yr · 1.5% tax · 5.0% vac · 8.0% maint · 8.0% mgmt
Financing live
Cash to close
- Down payment
- $19,975
- Closing costs
- $2,397
- Reserves months
- —
- Total cash needed
- —
Loan-product check · same deal, 3 products live
Conventional
25% down · 7.5% · 30yr
- Down + closing
- —
- Monthly P&I
- —
- Monthly cashflow
- —
- DSCR
- —
- Eligible?
- —
Personal DTI + credit; lowest rate.
DSCR
20% down · 8.5% · 30yr
- Down + closing
- —
- Monthly P&I
- —
- Monthly cashflow
- —
- DSCR
- —
- Eligible?
- —
No personal income docs; deal must DSCR.
Hard money
10% down · 12.0% · 12mo
- Down + closing
- —
- Monthly P&I
- —
- Monthly cashflow
- —
- DSCR
- —
- Eligible?
- —
Short-term bridge; refi at stabilization.
Listing history 19 events
-
2026-06-19days on market $79,900 Active 45 DOM
-
2026-06-18days on market $79,900 Active 44 DOM
-
2026-06-17days on market $79,900 Active 43 DOM
-
2026-06-16days on market $79,900 Active 42 DOM
-
2026-06-15days on market $79,900 Active 41 DOM
-
2026-06-14days on market $79,900 Active 39 DOM
-
2026-06-12days on market $79,900 Active 38 DOM
-
2026-06-09days on market $79,900 Active 35 DOM
-
2026-06-08days on market $79,900 Active 34 DOM
-
2026-06-07days on market $79,900 Active 33 DOM
-
2026-06-05days on market $79,900 Active 30 DOM
-
2026-06-03pricedays on market $79,900 Active 29 DOM
-
2026-06-02days on market $82,900 Active 28 DOM
-
2026-06-01days on market $82,900 Active 27 DOM
-
2026-05-31days on market $82,900 Active 26 DOM
-
2026-05-30pricedays on market $82,900 Active 25 DOM
-
2026-05-09price $89,900 940-char remark
-
2026-05-05$99,000 Active 940-char remark
-
2001-12-10soldstatus $26,350
ⓘ Source: listings_history table (triggers on properties + properties_extension) + one-shot
backfill from property_details.listing_events for pre-trigger history.
Tax reassessment forecast NY · Partial reset (capped growth)
- Current annual tax
- $1,209 · $101/mo
- Projected year-2 tax
- $1,279 · $107/mo
- Expected delta
- +$71/yr (+$6/mo · 5.9%)
ⓘ Screening estimate from a state-policy table — verify with the county assessor before closing.
Climate risk First Street
- Flood 1/10 Low FEMA zone X (unshaded) · 0% chance over 30 yrs
- Wildfire 1/10 Low
- Heat 2/10 Low 7 d/yr ≥95°F today · 15 d/yr by 30 yrs out
- Wind 1/10 Low 100% chance of damaging wind over 30 yrs
- Air quality 2/10 Low 0 unhealthy d/yr today · 1 by 30 yrs out
Nearby sold comps map
Loading sold comps map…
Walkable amenities ~0.75 mi
Loading nearby amenities…
Taxation est. · year 1
- Rental income
- $21,414
- − Mortgage interest
- −$4,476
- − Property taxes
- −$1,209
- − Insurance
- −$400
- − Repairs & maintenance
- −$1,713
- − Management
- −$1,713
- − Depreciation
- −$2,324
- Taxable income
- $9,580
- Est. tax owed @ 24.0%
- −$2,299
- After-tax cash flow
- $7,982/yr
For passive investors: Depreciation is non-cash, so a rental often shows a tax loss while cash-flowing — sheltering income. Rental losses are passive: they offset passive income freely, and up to $25,000/yr can offset ordinary (W-2) income if you actively participate and your MAGI is under $100k (phasing out to $0 by $150k); unused losses carry forward. On sale, claimed depreciation is recaptured at up to 25%, and gains may owe capital-gains tax (a 1031 exchange can defer both). Figures are a year-1 estimate at your 24.0% rate — not tax advice; consult a CPA.
Schools (NCES district)
- District
- Auburn City School District
- NCES district ID
- 3603480
- Math proficiency
- 31% ▼ -17.00%
- Reading proficiency
- 39% ▲ 2.00%
- Median HH income
- $43,567
- Composite
- 29.71/100
- National rank
- #6452
- State rank
- #558 of 590 in NY
Livability — Auburn
- Score
- 74/100
- State rank
- #298
- US rank
- #4814
Category grades
Schools grade is shown separately in the Schools card above.
Census & demographics
- Census place
- Auburn, NY
- County
- Cayuga County · 37,247 people
- City population
- 37,247
- Metro
- Auburn, NY
- Population (ZIP)
- 37,247
- Household income
- $60,712
- Rent vs Own
- Severe rent burden
- 1449.0
Population outlook (Cayuga County) Hauer SSP2
- Today (2025)
- 74,820 people
- By 2030
- 72,402 · -3.2%
- By 2040
- 66,917 · -10.6%
- By 2050
- 61,007 · -18.5%
- By 2075
- 48,047 · -35.8%
- By 2100
- 34,512 · -53.9%
Race, ethnicity, and origin ACS 2023
- Neighborhood character
- Predominantly White (87%)
- Race & ethnicity
- White 87% Two or more races 7% Black 3% Hispanic / Latino 3%
- Common ancestry
- Romanian 8% Subsaharan African 3% Lithuanian 2%
- Foreign-born
- 2% · Canada
- Languages at home
- 95% English-only · Spanish 2% Other Indo-European 1% German/W. Germanic 1%
Political lean MEDSL · Cayuga
- 2024 margin
- R (+13.0) · D 43.5% · R 56.5%
- 2008→2024 swing
- -21.5pp toward R · 2008: 8.5pp · 2024: -13.0pp
- All cycles
- 2024: R+13.0 2020: R+9.2 2016: R+13.2 2012: D+10.8 2008: D+8.5
Not yet ingested
- Civics
- —
Market trends
- HPI YoY
- ▼ -97.53%
- Current HPI
- 338.5537
- Rent YoY
- —
- Metro
- Auburn, NY
- State GDP YoY
- ▲ 2.60%
- F500 in state
- 92
Industry mix (Fortune 500 HQ in NY)
| Industry | F500 HQs | Revenue |
|---|---|---|
| Financial Services | 10 | $950B |
|
||
| Consumer Goods | 9 | $162B |
|
||
| Insurance | 4 | $225B |
|
||
| Telecommunications | 2 | $144B |
|
||
| Pharmaceuticals | 2 | $112B |
|
||
| Media / Entertainment | 2 | $69B |
|
||
Price history
+203.2% since first listed5 events — show timeline
- 2026-06-03 Price Changed $79,900 UNYREIS
- 2026-05-30 Price Changed $82,900 UNYREIS
- 2026-05-09 Price Changed $89,900 UNYREIS
- 2026-05-05 Listed $99,000 UNYREIS
- 2001-12-10 Sold (Public Records) $26,350 Public Records
Property tax history
-2.3%/yrLatest (2025): $1,209 · +10.8% YoY. Source: county tax records.
Cash-flow waterfall
monthlySold comps — $/sqft
last 12 mo · ≤1 miLoading sold comps…