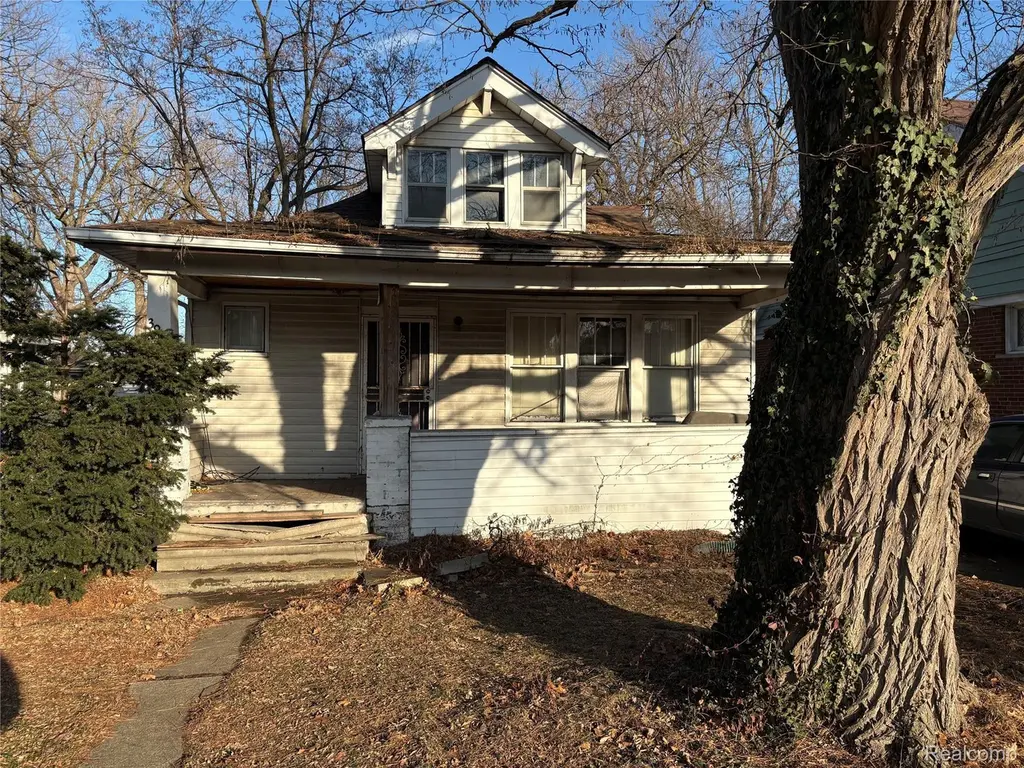
3950 Cadieux Rd · Detroit, MI
Flood risk 4/10 · Minor
- FEMA flood zone
- X (unshaded)
- Chance of flooding over 30 yrs
- 0.2%
- Est. flood insurance / yr
- $507 – $1,088
Fire risk 1/10 · Minimal
- Est. fire insurance / yr
- $784 – $1,456
Heat risk 3/10 · Minor
- Hot days now (above 96°F)
- 7 days/yr
- Hot days in 30 yrs
- 14 days/yr
Wind risk 2/10 · Minimal
- Chance of severe wind over 30 yrs
- —
Air-quality risk 3/10 · Minor
- Unhealthy air days now
- 3 days/yr
- Unhealthy air days in 30 yrs
- 4 days/yr
Risk factors via First Street. Map © Google.
Why this score? — see what drove the B- grade
The composite is a weighted blend of 9 inputs, each scored 0–100. Each bar is that input's sub-score; the figure is the points it added to the 100-point composite (weight × sub-score).
- Cash flow +30.0/30.0
- 1% rule +10.0/10.0
- DSCR +10.0/10.0
- ARV discount +7.5/15.0
- Livability +3.7/5.0
- Rent growth +2.7/5.0
- Condition / age +2.5/5.0
- Schools +1.3/10.0
- Appreciation +0.0/10.0
$40,000
🖨 Deal sheet (PDF) 📄 Offer letter ✓ Due diligence
Listing remarks MLS
Two bedroom one bath with the potential for a third bedroom upstairs, a value add opportunity. Solid investment property. One car garage and brand new roof put on in 2022. The house has a large backyard which backs up to Messmer park giving you tons of space and a great view. The backyard is 150' by 40'. Close to shopping and grocery stores in Grosse Pointe. Cadieux Cafe just down the block with feather bowling and live music. Sold AS IS BATVAI
Key facts
- Brand new roof
- Large backyard
- Close to shopping
Tags
Neighborhood map
What this means for you Summary
Snapshot
- This is a 2-bed/1.0-bath single-family listed at $40k.
Deal economics
- At list price, monthly cash flow is $636 ($8k/yr) — positive.
- The deal already cash-flows at list — no discount required.
- Meets the 1% rule at list price ($1k rent vs $40k).
- Recommended offer: $35k (12.0% below list) — sets the bar for market timing.
- Cap rate 25.4% vs local median 10.0% in Detroit — top-decile yield for the area; either an underpriced asset or a hidden risk that comps aren't pricing in. Stress-test before assuming the spread holds.
Location & tenants
- Location reads 73/100 on livability (#218 in MI) — a middle-class / working-renter tenant base. Strengths: amenities A+, commute A+, cost of living A+; Watch: schools F, crime F, employment F.
- Detroit Public Schools Community District (urban): math 10% / reading 24% proficiency, ranked #499 of 540 in MI (top 92%) — low school quality limits family demand, transient renter base, plan for 1-2y turnover; 90% free/reduced lunch — lower-income household profile, screen leases tightly.
- Market conditions: Rents flat; 492 active listings in the ZIP; 40 comparable units currently listed for rent nearby; rentals at typical pace (median 26d on market — plan ~3-4 weeks tenant-placement turnaround); 44% of comp listings sitting > 30 days — soft ceiling on asking rent; lower-income renter base — watch delinquency; 2,639 units permitted in Wayne County in 2024 (1,216 in 5+ unit buildings).
- This rent runs 32% of the median local income ($45k/yr) — at the standard rent-burdened threshold; future hikes will face affordability resistance.
Forward outlook
- Local home prices are declining (-3.0%/yr); year-one equity from $277 of loan paydown is wiped out by about $1k of value loss. Plan a longer hold.
- Wayne County population projected at -17% by 2050 — secular population decline; favor cash flow + early exit over multi-decade hold.
- At projected returns (-3.0% appreciation + 0.7% rent growth), your $11k cash investment doubles in ~2 years — after that, you're playing with house money.
Negotiation context
- It's been on market 150 days — a 12% lower offer ($35k) is reasonable based on typical stale-listing flexibility.
- 17 sale attempts since 30y ago with the ask held roughly flat each time — persistent listings suggest the price (not the market) is what's stuck; bring a comps-based counter.
- Current owner paid $33k; 21% above their basis — modest negotiation headroom, anchor on the comps not their cost.
Risks & watch-outs
- Watch-outs: built in 1920 — expect roof / HVAC / electrical / plumbing capex.
Questions for the listing agent
- It's been on market 150 days. Have you received any prior offers? Is the seller open to a 12% concession, seller financing, or rate buy-down credit?
- Built in 1920 — when were the roof, HVAC, electrical panel, plumbing, and water heater last replaced?
- Why hasn't it sold? Are there any deal-killer items the seller is aware of (foundation, flood, title, zoning, code violations)?
- Is there a deadline driving the sale (1031 exchange, divorce, estate, relocation)? That informs how much negotiation room exists.
- Schools are F-rated, which usually means shorter tenancies and higher turnover. Who's the typical renter profile here, and what's been the actual vacancy rate?
- Crime grade is F in this area — have there been break-ins, vandalism, or insurance claims at this property in the last 3 years? What carrier currently insures it and at what premium?
- What's the average days-on-market for RENTAL listings here right now (not sales)? A rising rental-DOM trend means longer vacancies and softer asking-rent achievability than the comps imply.
- What's the recent tenant-quality profile in this submarket — average credit score on applications, eviction rate, late-payment / NSF rate, and stable-employment percentage? A property-management company in the area should have these aggregated.
- How much new for-sale + rental construction is in the pipeline within 1–3 miles? Heavy new supply typically softens prices + rents 12–24 months out; constrained supply supports both.
Investment metrics
- 1% rule
- 2.97% ✓
- Cap rate
- 25.37%
- Cash-on-cash
- 68.14%
- DSCR
- 4.03
- GRM
- 2.8
CMA / ARV
- ARV (median comp)
- $82,763
- List price
- $40,000
- Delta
- -51.67%
- Verdict
- UNDERPRICED
- Comps
- 20 within 1.0 mi
Show comp detail 12 sales within ~0.75 mi
| Address | Dist | Beds/Ba | Sqft | Sold | Price | $/sf | Match |
|---|---|---|---|---|---|---|---|
| 3950 Cadieux Rd | 0.00mi | 2/1.0 | 900 (0%) | 0mo | $30,000 | $33 | 100 |
| 4356 Harvard Rd | 0.26mi | 3/2.0 (+1) | 921 (+2%) | 1mo | $150,000 | $163 | 74 |
| 4236 Cadieux Rd | 0.13mi | 3/1.0 (+1) | 849 (-6%) | 7mo | $77,500 | $91 | 73 |
| 4410 Guilford St | 0.33mi | 3/1.0 (+1) | 911 (+1%) | 11mo | $40,000 | $44 | 68 |
| 4150 Woodhall St | 0.24mi | 3/1.0 (+1) | 989 (+10%) | 8mo | $75,500 | $76 | 61 |
| 4325 Cadieux Rd | 0.22mi | 3/1.0 (+1) | 1,002 (+11%) | 7mo | $85,000 | $85 | 60 |
| 4163 University Pl | 0.43mi | 3/1.0 (+1) | 975 (+8%) | 7mo | $75,000 | $77 | 55 |
| 4515 Hereford St | 0.45mi | 3/1.5 (+1) | 984 (+9%) | 7mo | $75,000 | $76 | 50 |
| 4422 Yorkshire Rd | 0.40mi | 3/1.0 (+1) | 1,015 (+13%) | 10mo | $162,000 | $160 | 46 |
| 4138 University Pl | 0.45mi | 3/1.0 (+1) | 780 (-13%) | 7mo | $77,500 | $99 | 46 |
| 4481 Radnor St | 0.68mi | 2/1.0 | 792 (-12%) | 5mo | $32,000 | $40 | 44 |
| 17173 New York St | 0.51mi | 3/1.0 (+1) | 1,000 (+11%) | 10mo | $102,000 | $102 | 44 |
Match score weights: distance 35% · size 25% · config 20% · recency 20%. Top-matched comps best support the ARV.
Projected returns pro-forma
-3.0% appreciation · 0.73% rent growth · sell at horizon
- IRR
- 64.9%
- Equity multiple
- 3.80×
- Total profit
- $31,402
- Equity at exit
- $5,964
- IRR
- 68.5%
- Equity multiple
- 7.18×
- Total profit
- $69,230
- Equity at exit
- $3,458
Cash invested: $11,200 (down + closing). Projections, not guarantees.
Landlord ↔ Tenant lean methodology
- Overall (STATE)
- 62 Landlord-Friendly
- State Michigan
- 62 Landlord-Friendly · EVEN
- County
- — inherits STATE
- City
- — inherits STATE
ZIP-level market 48224
- Rents YoY
- 0.7%
- Active inventory
- 492
- Price-to-rent
- 2.8×
Monthly cashflow live
- Estimated rent
- $1,189 high interval (Pro) →
- Mortgage (P&I)
- −$210
- Tax from tax record
- −$77 /mo · $920/yr
- Insurance
- −$17
- HOA
- −$0
- Vacancy / Maint / Mgmt
- −$250
- Net cashflow
- $636
Break-even live
Sensitivity live
| Price | -10% $659 | -5% $647 | +0% $636 | +5% $625 | +10% $613 |
|---|---|---|---|---|---|
| Rent | -10% $542 | -5% $589 | +0% $636 | +5% $683 | +10% $730 |
| Rate | -1.0pp $656 | -0.5pp $646 | base $636 | +0.5pp $626 | +1.0pp $615 |
UW: 25.0% down · 7.5% · 30yr · 1.5% tax · 5.0% vac · 8.0% maint · 8.0% mgmt
Financing live
Cash to close
- Down payment
- $10,000
- Closing costs
- $1,200
- Reserves months
- —
- Total cash needed
- —
Loan-product check · same deal, 3 products live
Conventional
25% down · 7.5% · 30yr
- Down + closing
- —
- Monthly P&I
- —
- Monthly cashflow
- —
- DSCR
- —
- Eligible?
- —
Personal DTI + credit; lowest rate.
DSCR
20% down · 8.5% · 30yr
- Down + closing
- —
- Monthly P&I
- —
- Monthly cashflow
- —
- DSCR
- —
- Eligible?
- —
No personal income docs; deal must DSCR.
Hard money
10% down · 12.0% · 12mo
- Down + closing
- —
- Monthly P&I
- —
- Monthly cashflow
- —
- DSCR
- —
- Eligible?
- —
Short-term bridge; refi at stabilization.
Rent comps 40 comps
| Address | Beds | Baths | Sqft | Rent | $/sqft | DOM | Units | Dist |
|---|---|---|---|---|---|---|---|---|
| 17161 Denver St Detroit, MI | 1.0 | 1.0 | 700 | $800 | $1.14 | 14d | 1 | 0.18mi |
| 17161 Denver St Apt 10 Detroit, MI | 1.0 | 1.0 | 700 | $800 | $1.14 | 12d | 1 | 0.18mi |
| 3500 Bluehill St Apt 107 Detroit, MI | 1.0 | 1.0 | 600 | $900 | $1.50 | 0d | 1 | 0.23mi |
| 890 Neff Rd Grosse Pointe, MI | 2.0 | 1.0 | 1100 | $2,000 | $1.82 | 26d | 1 | 0.37mi |
| 17137 Ontario St Unit 1 Detroit, MI | 2.0 | 1.0 | 982 | $1,123 | $1.14 | 26d | 1 | 0.40mi |
| 4811 Cadieux Rd Unit 10 Detroit, MI | 2.0 | 1.0 | 663 | $1,200 | $1.81 | 45d | 1 | 0.44mi |
| 4811 Cadieux Rd Unit 2 Detroit, MI | 1.0 | 1.0 | 600 | $950 | $1.58 | 45d | 1 | 0.44mi |
| 4811 Cadieux Rd Unit 11 Detroit, MI | 2.0 | 1.0 | 663 | $1,200 | $1.81 | 23d | 1 | 0.44mi |
| 4837 Cadieux Rd Unit 9 Detroit, MI | 2.0 | 1.0 | 650 | $1,200 | $1.85 | 45d | 1 | 0.46mi |
| 4865 Cadieux Rd Unit 11 Detroit, MI | 2.0 | 1.0 | 630 | $1,200 | $1.90 | 45d | 1 | 0.48mi |
| 16530 E Warren Ave Unit 209 Detroit, MI | 1.0 | 1.0 | 850 | $1,292 | $1.52 | 45d | 1 | 0.62mi |
| 4627 Bedford St Unit 1 Detroit, MI | 2.0 | 1.0 | 1050 | $945 | $0.90 | 21d | 1 | 0.73mi |
| 5028 Bedford St Detroit, MI | 3.0 | 1.0 | 1000 | $1,400 | $1.40 | 6d | 1 | 0.86mi |
| 5031 Bedford St Detroit, MI | 2.0 | 1.0 | 876 | $1,870 | $2.13 | 0d | 1 | 0.88mi |
| 16927 Chandler Park Dr Unit 3_ Detroit, MI | 1.0 | 1.0 | 600 | $900 | $1.50 | 16d | 1 | 0.96mi |
| 542 Neff Ln Grosse Pointe, MI | 2.0 | 1.0 | 900 | $1,595 | $1.77 | 45d | 1 | 0.96mi |
| 5112 Haverhill St Unit 1 Detroit, MI | 2.0 | 1.0 | 1000 | $1,100 | $1.10 | 45d | 1 | 0.99mi |
| 509 Saint Clair Ave Grosse Pointe, MI | 2.0 | 1.0 | 1000 | $1,300 | $1.30 | 45d | 1 | 1.01mi |
| 5284 Devonshire Rd Unit 2 Detroit, MI | 1.0 | 1.0 | 750 | $1,050 | $1.40 | 16d | 1 | 1.02mi |
| 5284 Devonshire Rd Detroit, MI | 2.0 | 1.0 | 650 | $1,050 | $1.62 | 26d | 1 | 1.02mi |
| 5783 Yorkshire Rd Detroit, MI | 2.0 | 1.0 | 1040 | $1,200 | $1.15 | 45d | 1 | 1.05mi |
| 5786 Neff Ave Detroit, MI | 3.0 | 1.5 | 1100 | $1,225 | $1.11 | 18d | 1 | 1.06mi |
| 4151 Nottingham Rd Detroit, MI | 2.0 | 1.0 | 1022 | $1,275 | $1.25 | 19d | 1 | 1.11mi |
| 5955 Guilford St Detroit, MI | 3.0 | 1.0 | 802 | $1,400 | $1.75 | 19d | 1 | 1.12mi |
| 4391 Nottingham Rd Unit 4393 Detroit, MI | 2.0 | 1.0 | 1038 | $950 | $0.92 | 6d | 1 | 1.13mi |
| 5235 Chatsworth St Detroit, MI | 2.0 | 1.0 | 900 | $1,050 | $1.17 | 45d | 1 | 1.17mi |
| 5025 Somerset Ave Detroit, MI | 1.0 | 1.0 | 772 | $900 | $1.17 | 45d | 1 | 1.20mi |
| 5915 Farmbrook St Detroit, MI | 3.0 | 1.5 | 1000 | $1,250 | $1.25 | 26d | 1 | 1.22mi |
| 389 Saint Clair Ave Grosse Pointe, MI | 2.0 | 2.0 | 1000 | $3,150 | $3.15 | 45d | 1 | 1.24mi |
| 6181 Neff Ave Detroit, MI | 3.0 | 1.0 | 1102 | $1,299 | $1.18 | 19d | 1 | 1.28mi |
| 1236 Beaconsfield Ave Unit 1 Grosse Pointe Park, MI | 2.0 | 1.0 | 1100 | $1,600 | $1.45 | 26d | 1 | 1.32mi |
| 6304 Bluehill St Detroit, MI | 3.0 | 1.0 | 1088 | $1,500 | $1.38 | 45d | 1 | 1.32mi |
| 6175 Marseilles St Detroit, MI | 3.0 | 1.0 | 1100 | $1,100 | $1.00 | 45d | 1 | 1.34mi |
| 295 Rivard Blvd heuristic Grosse Pointe, MI | 2.0 | 1.0 | 1000 | $2,000 | $2.00 | 26d | 1 | 1.34mi |
| 6325 Neff Ave Detroit, MI | 3.0 | 1.0 | 1000 | $1,500 | $1.50 | 4d | 1 | 1.35mi |
| 1415 Maryland St Grosse Pointe Park, MI | 3.0 | 1.0 | 700 | $1,275 | $1.82 | 45d | 1 | 1.35mi |
| 9140 Whittier Ave Unit 1 Detroit, MI | 1.0 | 1.0 | 550 | $700 | $1.27 | 45d | 1 | 1.39mi |
| 1314 Maryland St Grosse Pointe Park, MI | 2.0 | 1.0 | 1008 | $1,250 | $1.24 | 45d | 1 | 1.40mi |
| 1300 Maryland St Grosse Pointe Park, MI | 2.0 | 1.0 | 900 | $1,200 | $1.33 | 23d | 1 | 1.41mi |
| 1300 Maryland St Grosse Pointe Park, MI | 2.0 | 1.0 | 900 | $1,200 | $1.33 | 5d | 1 | 1.41mi |
Listing history 40 events
-
2026-06-03statusdays on market $40,000 Pending 150 DOM
-
2026-06-01days on market $40,000 Active 149 DOM
-
2026-05-31days on market $40,000 Active 148 DOM
-
2026-01-03$40,000 Active 448-char remark
Show marketing remark (449 chars)
Two bedroom one bath with the potential for a third bedroom upstairs, a value add opportunity. Solid investment property. One car garage and brand new roof put on in 2022. The house has a large backyard which backs up to Messmer park giving you tons of space and a great view. The backyard is 150' by 40'. Close to shopping and grocery stores in Grosse Pointe. Cadieux Cafe just down the block with feather bowling and live music. Sold AS IS BATVAI
-
2026-01-03$40,000 Active 449-char remark
Show marketing remark (449 chars)
Two bedroom one bath with the potential for a third bedroom upstairs, a value add opportunity. Solid investment property. One car garage and brand new roof put on in 2022. The house has a large backyard which backs up to Messmer park giving you tons of space and a great view. The backyard is 150' by 40'. Close to shopping and grocery stores in Grosse Pointe. Cadieux Cafe just down the block with feather bowling and live music. Sold AS IS BATVAI
-
2025-09-02historical
-
2025-09-02historical
-
2024-04-17status Active
-
2024-04-17status Active
-
2024-04-12status Pending
-
2024-04-12status Pending
-
2024-04-04status Active
-
2024-04-04status Active
-
2024-03-25status Pending
-
2024-03-25status Pending
-
2023-12-12status Active
-
2023-12-12status Active
-
2023-11-24status Pending
-
2023-11-24status Pending
-
2023-11-02historical Accepting Backup Offers
-
2023-11-02historical Accepting Backup Offers
-
2023-10-18$49,000 Active
-
2023-10-18$49,000 Active
-
2004-05-26soldstatus $33,000
-
2004-03-17$43,500
-
2004-03-16historical
-
2004-02-01$49,500
-
2004-01-23historical
-
2004-01-01$49,500
-
2003-12-12historical
-
2003-10-06$69,990
-
2003-10-03historical
-
2003-09-22$69,990
-
2003-09-02historical
-
2003-06-05$79,990
-
1998-03-17soldstatus $30,000
-
1997-08-01soldstatus $15,000
-
1997-06-10soldstatus $30,000
-
1996-09-04historical
-
1996-08-05$35,500
ⓘ Source: listings_history table (triggers on properties + properties_extension) + one-shot
backfill from property_details.listing_events for pre-trigger history.
Tax reassessment forecast MI · Partial reset (capped growth)
- Current annual tax
- $920 · $77/mo
- Projected year-2 tax
- $920 · $77/mo
- Expected delta
- $0/yr ($0/mo · 0.0%)
ⓘ Screening estimate from a state-policy table — verify with the county assessor before closing.
Climate risk First Street
- Flood 4/10 Moderate FEMA zone X (unshaded) · 20% chance over 30 yrs
- Wildfire 1/10 Low
- Heat 3/10 Moderate 7 d/yr ≥96°F today · 14 d/yr by 30 yrs out
- Wind 2/10 Low
- Air quality 3/10 Moderate 3 unhealthy d/yr today · 4 by 30 yrs out
Nearby sold comps map
Loading sold comps map…
Walkable amenities ~0.75 mi
Loading nearby amenities…
Taxation est. · year 1
- Rental income
- $14,264
- − Mortgage interest
- −$2,241
- − Property taxes
- −$920
- − Insurance
- −$200
- − Repairs & maintenance
- −$1,141
- − Management
- −$1,141
- − Depreciation
- −$1,164
- Taxable income
- $7,458
- Est. tax owed @ 24.0%
- −$1,790
- After-tax cash flow
- $5,842/yr
For passive investors: Depreciation is non-cash, so a rental often shows a tax loss while cash-flowing — sheltering income. Rental losses are passive: they offset passive income freely, and up to $25,000/yr can offset ordinary (W-2) income if you actively participate and your MAGI is under $100k (phasing out to $0 by $150k); unused losses carry forward. On sale, claimed depreciation is recaptured at up to 25%, and gains may owe capital-gains tax (a 1031 exchange can defer both). Figures are a year-1 estimate at your 24.0% rate — not tax advice; consult a CPA.
Schools (NCES district)
- District
- Detroit Public Schools Community District
- NCES district ID
- 2601103
- Math proficiency
- 10% ▼ -2.00%
- Reading proficiency
- 24% ▲ 6.00%
- Median HH income
- $25,815
- Composite
- 13.06/100
- National rank
- #9564
- State rank
- #499 of 540 in MI
Livability — Detroit
- Score
- 73/100
- State rank
- #218
- US rank
- #5427
Category grades
Schools grade is shown separately in the Schools card above.
Census & demographics
- Census place
- Detroit, MI
- County
- Wayne County · 1,562,939 people
- City population
- 572,865
- Metro
- Detroit-Warren-Dearborn, MI
- Population (ZIP)
- 39,668
- Household income
- $44,856
- Rent vs Own
- Severe rent burden
- 2515.0
Population outlook (Wayne County) Hauer SSP2
- Today (2025)
- 1,675,273 people
- By 2030
- 1,620,300 · -3.3%
- By 2040
- 1,502,341 · -10.3%
- By 2050
- 1,384,039 · -17.4%
- By 2075
- 1,124,592 · -32.9%
- By 2100
- 881,193 · -47.4%
Race, ethnicity, and origin ACS 2023
- Neighborhood character
- Predominantly Black (88%)
- Race & ethnicity
- Black 88% White 8% Two or more races 3% Hispanic / Latino 1%
- Common ancestry
- Iranian 1% Romanian 1% Lithuanian 1%
- Foreign-born
- 1%
- Languages at home
- 97% English-only · Spanish 2%
Political lean MEDSL · Wayne
- 2024 margin
- Strong D (+29.0) · D 62.7% · R 33.7% · Other 3.6%
- 2008→2024 swing
- -20.5pp toward R · 2008: 49.5pp · 2024: 29.0pp
- All cycles
- 2024: D+29.0 2020: D+38.1 2016: D+37.3 2012: D+46.9 2008: D+49.5
Not yet ingested
- Civics
- —
Market trends
- HPI YoY
- ▼ -226.38%
- Current HPI
- 161.886
- Rent YoY
- ▲ 0.73%
- Metro
- Detroit-Warren-Dearborn, MI
- State GDP YoY
- ▲ 1.37%
- F500 in state
- 28
Industry mix (Fortune 500 HQ in MI)
| Industry | F500 HQs | Revenue |
|---|---|---|
| Automotive Parts | 3 | $48B |
|
||
| Automotive | 2 | $372B |
|
||
| Chemicals | 1 | $45B |
|
||
| Automotive Retail | 1 | $29B |
|
||
| Healthcare / Medical Devices | 1 | $23B |
|
||
| Automotive Technology | 1 | $20B |
|
||
Price history
+12.7% since first listed37 events — show timeline
- 2026-01-03 Listed $40,000 REALCOMP
- 2026-01-03 Listed $40,000 MiRealSource-MiMLS
- 2025-09-02 Listing Removed — MiRealSource-MiMLS
- 2025-09-02 Listing Removed — REALCOMP
- 2024-04-17 Relisted — REALCOMP
- 2024-04-17 Relisted — MiRealSource-MiMLS
- 2024-04-12 Pending — MiRealSource-MiMLS
- 2024-04-12 Pending — REALCOMP
- 2024-04-04 Relisted — MiRealSource-MiMLS
- 2024-04-04 Relisted — REALCOMP
- 2024-03-25 Pending — MiRealSource-MiMLS
- 2024-03-25 Pending — REALCOMP
- 2023-12-12 Relisted — MiRealSource-MiMLS
- 2023-12-12 Relisted — REALCOMP
- 2023-11-24 Pending — MiRealSource-MiMLS
- 2023-11-24 Pending — REALCOMP
- 2023-11-02 Contingent — MiRealSource-MiMLS
- 2023-11-02 Contingent — REALCOMP
- 2023-10-18 Listed $49,000 MiRealSource-MiMLS
- 2023-10-18 Listed $49,000 REALCOMP
- 2004-05-26 Sold (MLS) $33,000 REALCOMP
- 2004-03-17 Listed $43,500 REALCOMP
- 2004-03-16 Listing Removed — REALCOMP
- 2004-02-01 Listed $49,500 REALCOMP
- 2004-01-23 Listing Removed — REALCOMP
- 2004-01-01 Listed $49,500 REALCOMP
- 2003-12-12 Listing Removed — REALCOMP
- 2003-10-06 Listed $69,990 REALCOMP
- 2003-10-03 Listing Removed — REALCOMP
- 2003-09-22 Listed $69,990 REALCOMP
- 2003-09-02 Listing Removed — REALCOMP
- 2003-06-05 Listed $79,990 REALCOMP
- 1998-03-17 Sold (Public Records) $30,000 Public Records
- 1997-08-01 Sold (Public Records) $15,000 Public Records
- 1997-06-10 Sold (MLS) $30,000 MiRealSource-MiMLS
- 1996-09-04 Listing Removed — MiRealSource-MiMLS
- 1996-08-05 Listed $35,500 MiRealSource-MiMLS
Property tax history
-0.7%/yrLatest (2025): $920 · -53.6% YoY. Source: county tax records.
Cash-flow waterfall
monthlySold comps — $/sqft
last 12 mo · ≤1 miLoading sold comps…