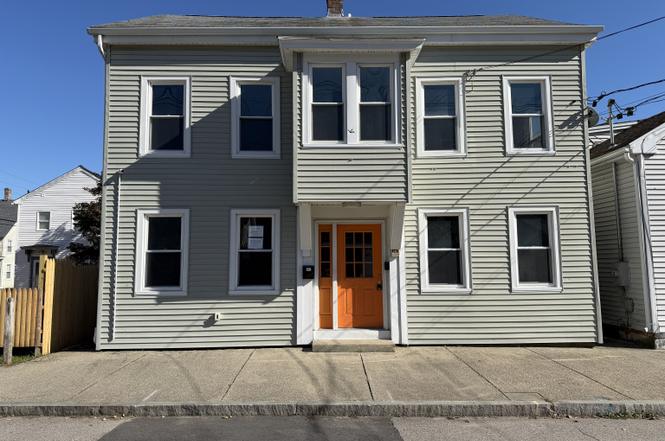
303 Central Ave · Norwich, CT
Flood risk 1/10 · Minimal
- FEMA flood zone
- X (unshaded)
- Chance of flooding over 30 yrs
- 0.0%
- Est. flood insurance / yr
- $473 – $860
Fire risk 3/10 · Minor
- Est. fire insurance / yr
- $829 – $1,539
Heat risk 5/10 · Moderate
- Hot days now (above 98°F)
- 7 days/yr
- Hot days in 30 yrs
- 17 days/yr
Wind risk 6/10 · Moderate
- Chance of severe wind over 30 yrs
- 63.0%
Air-quality risk 3/10 · Minor
- Unhealthy air days now
- 2 days/yr
- Unhealthy air days in 30 yrs
- 3 days/yr
Risk factors via First Street. Map © Google.
Why this score? — see what drove the C+ grade
The composite is a weighted blend of 9 inputs, each scored 0–100. Each bar is that input's sub-score; the figure is the points it added to the 100-point composite (weight × sub-score).
- Cash flow +20.7/30.0
- ARV discount +15.0/15.0
- DSCR +6.6/10.0
- 1% rule +6.5/10.0
- Rent growth +4.2/5.0
- Livability +4.0/5.0
- Condition / age +2.5/5.0
- Schools +2.1/10.0
- Appreciation +0.0/10.0
$199,900
🖨 Deal sheet 📄 Offer letter ✓ Due diligence
Listing remarks MLS
Fully remodeled 5-bedroom, 2-full bath colonial style home. The home was remodeled from studs up and offers all new electrical, plumbing, insulation and mechanicals. Contemporary features include stainless steel appliances, recessed lights, butcher-block counter tops, luxury-laminate flooring, barn-yard doors, soothing paint colors, new light fixtures and ceiling fans, sinks, vanities, faucets and so much more. Specious backyard.
Key facts
- 2,178 sq ft lot
- Built 1890
- Listed 135 days
Property features AI
Exterior
- Utilities: Public water connected; Public sewer connected; Electric hot water
- Home design: Single-family home
- Construction: Frame construction; Vinyl siding; Stone foundation; Asphalt shingle roof; Beige exterior
- Exterior features: Porch; Gutters; Exterior lighting; Level lot
Interior
- Kitchen: Oven/Range; Range hood; Refrigerator
- Bedrooms: 6 bedrooms
- Bathrooms: 3 full bathrooms
- Heating & cooling: No heat specified; Thermopane windows (energy efficient)
- Interior features: Cable pre-wired; Full unfinished basement with hatchway
- Laundry & utility: Laundry on 2nd floor / upper level; 40-gallon electric hot water tank
Neighborhood map
What this means for you Summary
Snapshot
- This is a 4-bed/3.0-bath single-family listed at $200k.
Deal economics
- At list price, monthly cash flow is $272 ($3k/yr) — positive.
- The deal already cash-flows at list — no discount required.
- Meets the 1% rule at list price ($2k rent vs $200k).
- Recommended offer: $176k (12.0% below list) — sets the bar for market timing.
- Cap rate 7.9% vs local median 4.0% in Norwich — top-decile yield for the area; either an underpriced asset or a hidden risk that comps aren't pricing in. Stress-test before assuming the spread holds.
Location & tenants
- Location reads 81/100 on livability (#18 in CT, #1,391 nationally) — a professional / high-income tenant draw. Strengths: housing A+, health & safety A+, commute A-; Watch: schools D+.
- Norwich School District (urban): math 19% / reading 29% proficiency, ranked #139 of 153 in CT (top 91%) — low school quality limits family demand, transient renter base, plan for 1-2y turnover; 62% free/reduced lunch — lower-income household profile, screen leases tightly.
- Market conditions: Rents rising fast (+6.6%/yr); 241 active listings in the ZIP; 6 comparable units currently listed for rent nearby; rentals lingering (median 44d on market — plan ~5-8 weeks vacancy on turnover, expect pricing pressure); 50% of comp listings sitting > 30 days — soft ceiling on asking rent; 487 units permitted in Southeastern Connecticut Planning Region in 2024 (244 in 5+ unit buildings).
- This rent runs 42% of the median local income ($66k/yr) — at the standard rent-burdened threshold; future hikes will face affordability resistance.
Forward outlook
- Local home prices are declining (-3.0%/yr); year-one equity from $1k of loan paydown is wiped out by about $6k of value loss. Plan a longer hold.
- At projected returns (-3.0% appreciation + 6.6% rent growth), your $56k cash investment doubles in ~10 years — after that, you're playing with house money.
Negotiation context
- It's been on market 135 days — a 12% lower offer ($176k) is reasonable based on typical stale-listing flexibility.
- 7 sale attempts since 5y ago; this cycle's ask has dropped $60k (23%) from the opening price — seller is motivated, your offer sets the floor, not the list.
Risks & watch-outs
- Watch-outs: property tax is 2.5% of price; built in 1890 — expect roof / HVAC / electrical / plumbing capex.
- Climate carrying-cost: major wind risk, 63% chance of damaging wind over 30y; extreme-heat days projected 7→17/yr by 2055 (HVAC capex compounding) — expect insurance premiums to compound above CPI over the hold.
Questions for the listing agent
- It's been on market 135 days. Have you received any prior offers? Is the seller open to a 12% concession, seller financing, or rate buy-down credit?
- Built in 1890 — when were the roof, HVAC, electrical panel, plumbing, and water heater last replaced?
- Property tax is high relative to price — has the assessment been appealed recently, and will the sale trigger a re-assessment?
- Why hasn't it sold? Are there any deal-killer items the seller is aware of (foundation, flood, title, zoning, code violations)?
- Is there a deadline driving the sale (1031 exchange, divorce, estate, relocation)? That informs how much negotiation room exists.
- Schools are D-rated, which usually means shorter tenancies and higher turnover. Who's the typical renter profile here, and what's been the actual vacancy rate?
- What's the average days-on-market for RENTAL listings here right now (not sales)? A rising rental-DOM trend means longer vacancies and softer asking-rent achievability than the comps imply.
- What's the recent tenant-quality profile in this submarket — average credit score on applications, eviction rate, late-payment / NSF rate, and stable-employment percentage? A property-management company in the area should have these aggregated.
- How much new for-sale + rental construction is in the pipeline within 1–3 miles? Heavy new supply typically softens prices + rents 12–24 months out; constrained supply supports both.
Investment metrics
- 1% rule
- 1.15% ✓
- Cap rate
- 7.93%
- Cash-on-cash
- 5.83%
- DSCR
- 1.26
- GRM
- 7.2
CMA / ARV
- ARV (on-the-fly)
- $285,684
- Comps found
- 12
Show comp detail 12 sales within ~0.75 mi
| Address | Dist | Beds/Ba | Sqft | Sold | Price | $/sf | Match |
|---|---|---|---|---|---|---|---|
| 79 Roosevelt Ave | 0.32mi | 3/2.0 (-1) | 1,537 (-4%) | 2mo | $355,800 | $231 | 69 |
| 113 4th St | 0.27mi | 3/1.0 (-1) | 1,696 (+6%) | 2mo | $260,000 | $153 | 62 |
| 31 Prospect St | 0.48mi | 4/2.0 | 1,672 (+5%) | 5mo | $260,000 | $156 | 61 |
| 556 Boswell Ave | 0.33mi | 3/2.0 (-1) | 1,716 (+8%) | 3mo | $257,000 | $150 | 61 |
| 3 Curtis St | 0.57mi | 4/1.0 | 1,560 (-2%) | 3mo | $400,000 | $256 | 59 |
| 163 Hickory St | 0.52mi | 3/2.0 (-1) | 1,518 (-5%) | 4mo | $280,000 | $184 | 55 |
| 89 Hickory St | 0.60mi | 4/2.0 | 1,512 (-5%) | 6mo | $225,000 | $149 | 55 |
| 276 Boswell Ave | 0.51mi | 3/1.0 (-1) | 1,536 (-4%) | 8mo | $275,000 | $179 | 50 |
| 290 Boswell Ave | 0.47mi | 3/1.5 (-1) | 1,416 (-11%) | 1mo | $335,500 | $237 | 48 |
| 272 Boswell Ave | 0.52mi | 4/2.0 | 1,800 (+13%) | 6mo | $240,000 | $133 | 46 |
| 128 Smith Ave | 0.49mi | 3/1.0 (-1) | 1,357 (-15%) | 0mo | $275,000 | $203 | 39 |
| 17 Daniel St | 0.53mi | 3/1.0 (-1) | 1,381 (-14%) | 6mo | $160,000 | $116 | 35 |
Match score weights: distance 35% · size 25% · config 20% · recency 20%. Top-matched comps best support the ARV.
Projected returns pro-forma
-3.0% appreciation · 6.62% rent growth · sell at horizon
- IRR
- -2.8%
- Equity multiple
- 0.89×
- Total profit
- $-6,239
- Equity at exit
- $29,806
- IRR
- 10.8%
- Equity multiple
- 2.00×
- Total profit
- $55,883
- Equity at exit
- $17,284
Cash invested: $55,972 (down + closing). Projections, not guarantees.
Landlord ↔ Tenant lean methodology
- Overall (STATE)
- 27 Tenant-Leaning
- State Connecticut
- 27 Tenant-Leaning · D+7
- County
- — inherits STATE
- City
- — inherits STATE
ZIP-level market 06360
- Home prices YoY
- -19.9%
- Rents YoY
- 6.6%
- Active inventory
- 241
- Price-to-rent
- 7.2×
Monthly cashflow live
- Estimated rent
- $2,305 high interval (Pro) →
- Mortgage (P&I)
- −$1,048
- Tax from tax record
- −$417 /mo · $5,005/yr
- Insurance
- −$83
- HOA
- −$0
- Vacancy / Maint / Mgmt
- −$484
- Net cashflow
- $272
Break-even live
UW: 25.0% down · 7.5% · 30yr · 1.5% tax · 5.0% vac · 8.0% maint · 8.0% mgmt
Financing live
Cash to close
- Down payment
- $49,975
- Closing costs
- $5,997
- Reserves months
- —
- Total cash needed
- —
Loan-product check · same deal, 3 products live
Conventional
25% down · 7.5% · 30yr
- Down + closing
- —
- Monthly P&I
- —
- Monthly cashflow
- —
- DSCR
- —
- Eligible?
- —
Personal DTI + credit; lowest rate.
DSCR
20% down · 8.5% · 30yr
- Down + closing
- —
- Monthly P&I
- —
- Monthly cashflow
- —
- DSCR
- —
- Eligible?
- —
No personal income docs; deal must DSCR.
Hard money
10% down · 12.0% · 12mo
- Down + closing
- —
- Monthly P&I
- —
- Monthly cashflow
- —
- DSCR
- —
- Eligible?
- —
Short-term bridge; refi at stabilization.
Rent comps 6 comps
| Address | Beds | Baths | Sqft | Rent | $/sqft | DOM | Units | Dist |
|---|---|---|---|---|---|---|---|---|
| 229 Boswell Ave Unit 6 Norwich, CT | 3.0 | 2.5 | 1547 | $2,350 | $1.52 | 13d | 1 | 0.50mi |
| 10 Hillcrest St Unit B Norwich, CT | 3.0 | 3.0 | 1507 | $2,300 | $1.53 | 43d | 1 | 0.69mi |
| 130 Platt Ave Norwich, CT | 3.0 | 1.0 | 2010 | $1,800 | $0.90 | 43d | 1 | 0.91mi |
| 51-53 Cliff St Norwich, CT | 4.0 | 1.0 | 1598 | $2,100 | $1.31 | 21d | 1 | 1.13mi |
| 51 Broad St Norwich, CT | 3.0 | 1.0 | 1200 | $1,850 | $1.54 | 21d | 1 | 1.22mi |
| 14-16 Slater Ave Unit 14 Norwich, CT | 3.0 | 1.0 | 1200 | $2,000 | $1.67 | 43d | 1 | 1.33mi |
Listing history 26 events
-
2026-05-06status Under Contract
-
2026-04-23historical Under Contract - Continue to Show
-
2026-04-16status Active
-
2026-03-02status Under Contract
-
2026-02-20historical Under Contract - Continue to Show
-
2026-02-16status Active
-
2026-02-12historical Under Contract - Continue to Show
-
2026-01-24price $199,900
-
2025-12-24price $224,900
-
2025-11-06$259,900 Active
-
2025-06-25historical
-
2025-04-09$300,000 Active
-
2023-07-29status Under Contract 433-char remark
Show marketing remark (433 chars)
Fully remodeled 5-bedroom, 2-full bath colonial style home. The home was remodeled from studs up and offers all new electrical, plumbing, insulation and mechanicals. Contemporary features include stainless steel appliances, recessed lights, butcher-block counter tops, luxury-laminate flooring, barn-yard doors, soothing paint colors, new light fixtures and ceiling fans, sinks, vanities, faucets and so much more. Specious backyard.
-
2023-07-25soldstatus $257,000 Closed 433-char remark
Show marketing remark (433 chars)
Fully remodeled 5-bedroom, 2-full bath colonial style home. The home was remodeled from studs up and offers all new electrical, plumbing, insulation and mechanicals. Contemporary features include stainless steel appliances, recessed lights, butcher-block counter tops, luxury-laminate flooring, barn-yard doors, soothing paint colors, new light fixtures and ceiling fans, sinks, vanities, faucets and so much more. Specious backyard.
-
2023-06-26historical Under Contract - Continue to Show 433-char remark
Show marketing remark (433 chars)
Fully remodeled 5-bedroom, 2-full bath colonial style home. The home was remodeled from studs up and offers all new electrical, plumbing, insulation and mechanicals. Contemporary features include stainless steel appliances, recessed lights, butcher-block counter tops, luxury-laminate flooring, barn-yard doors, soothing paint colors, new light fixtures and ceiling fans, sinks, vanities, faucets and so much more. Specious backyard.
-
2023-06-07$240,000 Active 433-char remark
Show marketing remark (433 chars)
Fully remodeled 5-bedroom, 2-full bath colonial style home. The home was remodeled from studs up and offers all new electrical, plumbing, insulation and mechanicals. Contemporary features include stainless steel appliances, recessed lights, butcher-block counter tops, luxury-laminate flooring, barn-yard doors, soothing paint colors, new light fixtures and ceiling fans, sinks, vanities, faucets and so much more. Specious backyard.
-
2022-06-02soldstatus $69,000
-
2022-06-01soldstatus $69,000 Closed
-
2022-05-03historical Under Contract - Continue to Show
-
2022-04-18price $79,000
-
2022-04-18price $79,000
-
2022-03-22$87,000 Active
-
2021-12-10price $89,000
-
2021-04-23soldstatus $68,400
-
2021-04-22soldstatus $68,000 Closed
-
2021-03-22$79,900 Active
ⓘ Source: listings_history table (triggers on properties + properties_extension) + one-shot
backfill from property_details.listing_events for pre-trigger history.
Tax reassessment forecast CT · Partial reset (capped growth)
- Current annual tax
- $5,005 · $417/mo
- Projected year-2 tax
- $5,005 · $417/mo
- Expected delta
- $0/yr ($0/mo · 0.0%)
ⓘ Screening estimate from a state-policy table — verify with the county assessor before closing.
Climate risk First Street
- Flood 1/10 Low FEMA zone X (unshaded) · 0% chance over 30 yrs
- Wildfire 3/10 Moderate
- Heat 5/10 Major 7 d/yr ≥98°F today · 17 d/yr by 30 yrs out
- Wind 6/10 Major 63% chance of damaging wind over 30 yrs
- Air quality 3/10 Moderate 2 unhealthy d/yr today · 3 by 30 yrs out
Nearby sold comps map
Loading sold comps map…
Walkable amenities ~0.75 mi
Loading nearby amenities…
Taxation est. · year 1
- Rental income
- $27,654
- − Mortgage interest
- −$11,198
- − Property taxes
- −$5,005
- − Insurance
- −$1,000
- − Repairs & maintenance
- −$2,212
- − Management
- −$2,212
- − Depreciation
- −$5,815
- Taxable income
- $212
- Est. tax owed @ 24.0%
- −$51
- After-tax cash flow
- $3,212/yr
For passive investors: Depreciation is non-cash, so a rental often shows a tax loss while cash-flowing — sheltering income. Rental losses are passive: they offset passive income freely, and up to $25,000/yr can offset ordinary (W-2) income if you actively participate and your MAGI is under $100k (phasing out to $0 by $150k); unused losses carry forward. On sale, claimed depreciation is recaptured at up to 25%, and gains may owe capital-gains tax (a 1031 exchange can defer both). Figures are a year-1 estimate at your 24.0% rate — not tax advice; consult a CPA.
Schools (NCES district)
- District
- Norwich School District
- NCES district ID
- 0903120
- Math proficiency
- 19% ▼ -8.00%
- Reading proficiency
- 29% ▼ -7.00%
- Median HH income
- $50,813
- Composite
- 21.27/100
- National rank
- #8395
- State rank
- #139 of 153 in CT
Livability — Norwich
- Score
- 81/100
- State rank
- #18
- US rank
- #1391
Category grades
Schools grade is shown separately in the Schools card above.
Census & demographics
- Census place
- Norwich, CT
- County
- New London County · 147,197 people
- City population
- 37,216
- Metro
- Norwich-New London, CT
- Population (ZIP)
- 37,216
- Household income
- $65,539
- Rent vs Own
- Severe rent burden
- 1643.0
Population outlook (Southeastern Connecticut County) Hauer SSP2
- By 2040
- 293,442
Race, ethnicity, and origin ACS 2023
- Neighborhood character
- Diverse neighborhood (Simpson 0.63)
- Race & ethnicity
- White 56% Hispanic / Latino 21% Two or more races 12% Black 10% Asian 7%
- Hispanic origin (detail)
- Mexican 3% Puerto Rican 9% Cuban 1% Dominican 3%
- Common ancestry
- Lithuanian 8% Romanian 5% Hispanic 4%
- Foreign-born
- 15% · Canada, China
- Languages at home
- 77% English-only · Spanish 11% French/Haitian/Cajun 4% Chinese 3%
Political lean MEDSL · Southeastern Connecticut
- 2024 margin
- D (+13.0) · D 55.6% · R 42.6% · Other 1.8%
- All cycles
- 2024: D+13.0
Not yet ingested
- Civics
- —
Market trends
- HPI YoY
- ▼ -65.27%
- Current HPI
- 261.8575
- Rent YoY
- ▲ 6.62%
- Metro
- Norwich-New London, CT
- State GDP YoY
- ▲ 1.06%
- F500 in state
- 38
Industry mix (Fortune 500 HQ in CT)
| Industry | F500 HQs | Revenue |
|---|---|---|
| Industrial Machinery | 4 | $38B |
|
||
| Insurance | 3 | $71B |
|
||
| Financial Services | 2 | $25B |
|
||
| Transportation / Logistics | 2 | $18B |
|
||
| Healthcare | 1 | $247B |
|
||
| Telecommunications | 1 | $55B |
|
||
Price history
+150.2% since first listed26 events — show timeline
- 2026-05-06 Pending — Smart MLS
- 2026-04-23 Contingent — Smart MLS
- 2026-04-16 Relisted — Smart MLS
- 2026-03-02 Pending — Smart MLS
- 2026-02-20 Contingent — Smart MLS
- 2026-02-16 Relisted — Smart MLS
- 2026-02-12 Contingent — Smart MLS
- 2026-01-24 Price Changed $199,900 Smart MLS
- 2025-12-24 Price Changed $224,900 Smart MLS
- 2025-11-06 Listed $259,900 Smart MLS
- 2025-06-25 Listing Removed — Smart MLS
- 2025-04-09 Listed $300,000 Smart MLS
- 2023-07-29 Pending — Smart MLS
- 2023-07-25 Sold (MLS) $257,000 Smart MLS
- 2023-06-26 Contingent — Smart MLS
- 2023-06-07 Listed $240,000 Smart MLS
- 2022-06-02 Sold (Public Records) $69,000 Public Records
- 2022-06-01 Sold (MLS) $69,000 Smart MLS
- 2022-05-03 Contingent — Smart MLS
- 2022-04-18 Price Changed $79,000 Smart MLS
- 2022-04-18 Price Changed $79,000 Smart MLS
- 2022-03-22 Listed $87,000 Smart MLS
- 2021-12-10 Price Changed $89,000 Smart MLS
- 2021-04-23 Sold (Public Records) $68,400 Public Records
- 2021-04-22 Sold (MLS) $68,000 Smart MLS
- 2021-03-22 Listed $79,900 Smart MLS
Property tax history
+3.5%/yrLatest (2023): $5,005 · +54.1% YoY. Source: county tax records.
Cash-flow waterfall
monthlySold comps — $/sqft
last 12 mo · ≤1 miLoading sold comps…