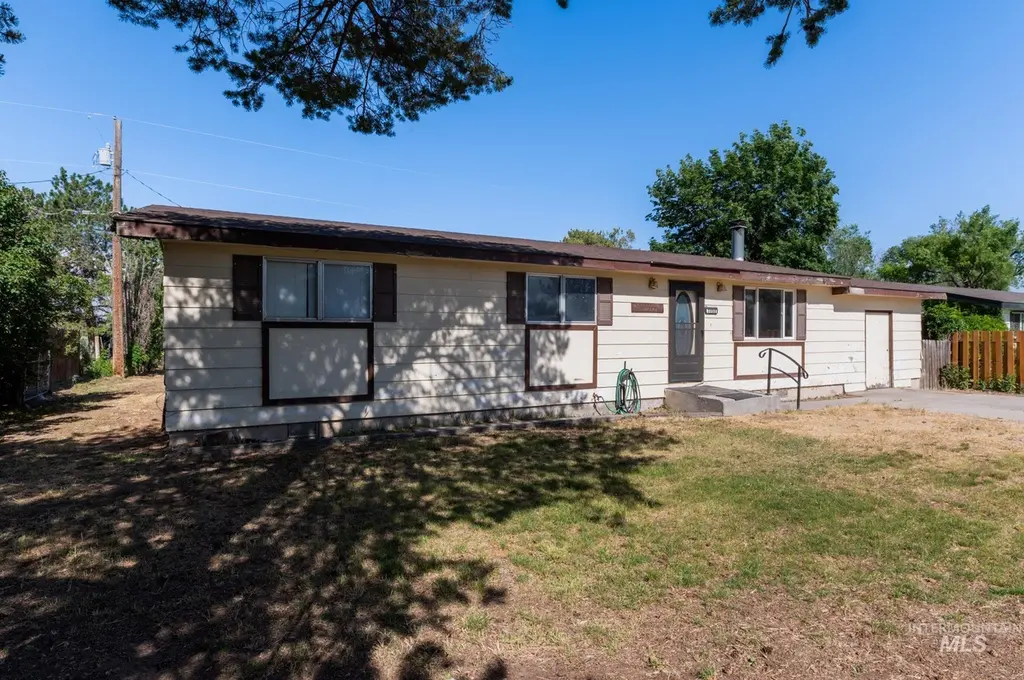
1157 Lavina Ave · Twin Falls, ID
Flood risk 1/10 · Minimal
- FEMA flood zone
- X (unshaded)
- Chance of flooding over 30 yrs
- 0.0%
- Est. flood insurance / yr
- $507 – $1,088
Fire risk 3/10 · Minor
- Est. fire insurance / yr
- $584 – $1,086
Heat risk 4/10 · Minor
- Hot days now (above 93°F)
- 7 days/yr
- Hot days in 30 yrs
- 19 days/yr
Wind risk 1/10 · Minimal
- Chance of severe wind over 30 yrs
- —
Air-quality risk 7/10 · Major
- Unhealthy air days now
- 12 days/yr
- Unhealthy air days in 30 yrs
- 15 days/yr
Risk factors via First Street. Map © Google.
Why this score? — see what drove the D+ grade
The composite is a weighted blend of 9 inputs, each scored 0–100. Each bar is that input's sub-score; the figure is the points it added to the 100-point composite (weight × sub-score).
- ARV discount +15.0/15.0
- Cash flow +14.2/30.0
- DSCR +4.3/10.0
- Livability +3.7/5.0
- Schools +3.5/10.0
- Rent growth +3.2/5.0
- 1% rule +2.7/10.0
- Condition / age +2.5/5.0
- Appreciation +0.0/10.0
$240,000
🖨 Deal sheet 📄 Offer letter ✓ Due diligence
Listing remarks
Opportunity awaits on over 1/3 acre! This diamond in the rough offers excellent value-added potential. Features include well, septic, irrigation water, and the possibility of a garden space. Conveniently located close to town and services. Perfect for an investor or someone ready to build sweat equity into their own piece of Idaho. Bring your vision and unlock the potential.
Key facts
- Close to town
- Septic
- Well
Tags
Property features AI
Exterior
- Parking: Attached garage; Attached parking
- Utilities: Septic tank; Well water
- Home design: Manufactured home on land; Built in 1973
- Construction: Composition roof
- Exterior features: Full wire fencing; Full sprinkler system; Property currently used as single-family; Public road frontage; Chickens allowed
Interior
- Kitchen: Dishwasher; Freestanding oven/range; Refrigerator; Kitchen on main level (~11 x 10)
- Bedrooms: 3 bedrooms — all on the main level (Primary: ~12 x 11; Bedroom 2: ~12 x 9; Bedroom 3: ~11 x 10)
- Flooring: Carpet; Vinyl
- Bathrooms: 2 bathrooms
- Heating & cooling: Baseboard electric heating; Evaporative cooling; Wall/window cooling unit(s)
- Interior features: Bath in primary bedroom; Primary bedroom on main level; Laminate countertops; Wood burning stove
- Laundry & utility: Electric water heater
Neighborhood map
What this means for you Summary
Snapshot
- This is a 3-bed/2.0-bath single-family listed at $240k.
Deal economics
- At list price, monthly cash flow is $39 ($464/yr) — positive.
- The deal already cash-flows at list — no discount required.
- To meet the 1% rule (rent ≥ 1% of price), the offer needs to be $185k (23.1% below list).
- Recommended offer: $185k (23.1% below list) — sets the bar for 1% rule.
- Cap rate 6.5% vs local median 2.4% in Twin Falls — top-decile yield for the area; either an underpriced asset or a hidden risk that comps aren't pricing in. Stress-test before assuming the spread holds.
Location & tenants
- Location reads 74/100 on livability (#33 in ID, #4,779 nationally) — a middle-class / working-renter tenant base. Strengths: cost of living A+, housing A+, health & safety A+; Watch: crime C-, commute F.
- Twin Falls District (town): math 34% / reading 49% proficiency, ranked #62 of 92 in ID (top 67%) — families likely to look elsewhere, expect single-tenant / working-renter base with shorter leases.
- Zoned schools: Lincoln Elementary School (math 22% / reading 27%, grade F, #332 of 357 statewide, top 95%, 386 students, 76% FRL); Canyon Ridge High School (math 26% / reading 59%, grade F, #71 of 169 statewide, top 42%, 1,409 students, 18% FRL) — zoned schools at 47% FRL track the district average.
- Market conditions: Rents rising (+2.9%/yr); 620 active listings in the ZIP; 636 units permitted in Twin Falls County in 2024 (12 in 5+ unit buildings).
- This rent runs 35% of the median local income ($63k/yr) — at the standard rent-burdened threshold; future hikes will face affordability resistance.
Forward outlook
- Local home prices are declining (-3.0%/yr); year-one equity from $2k of loan paydown is wiped out by about $7k of value loss. Plan a longer hold.
- Twin Falls County population projected at +29% by 2050 — long-run rental-demand tailwind backs the buy-and-hold thesis.
Negotiation context
- It's been on market 21 days — a 2% lower offer ($236k) is reasonable based on typical stale-listing flexibility.
Questions for the listing agent
- Built in 1973 — when were the roof, HVAC, electrical panel, plumbing, and water heater last replaced?
- Is there a deadline driving the sale (1031 exchange, divorce, estate, relocation)? That informs how much negotiation room exists.
- The area grade is low — what's the realistic commute time and amenity access for the typical tenant pool here? Any planned neighborhood developments (good or bad) we should know about?
- What's the average days-on-market for RENTAL listings here right now (not sales)? A rising rental-DOM trend means longer vacancies and softer asking-rent achievability than the comps imply.
- What's the recent tenant-quality profile in this submarket — average credit score on applications, eviction rate, late-payment / NSF rate, and stable-employment percentage? A property-management company in the area should have these aggregated.
- How much new for-sale + rental construction is in the pipeline within 1–3 miles? Heavy new supply typically softens prices + rents 12–24 months out; constrained supply supports both.
Investment metrics
- 1% rule
- 0.77% ✗
- Cap rate
- 6.49%
- Cash-on-cash
- 0.69%
- DSCR
- 1.03
- GRM
- 10.8
CMA / ARV
- ARV (on-the-fly)
- $339,840
- Comps found
- 3
Show comp detail 3 sales within ~0.75 mi
| Address | Dist | Beds/Ba | Sqft | Sold | Price | $/sf | Match |
|---|---|---|---|---|---|---|---|
| 1061 Par Ct | 0.30mi | 3/2.0 | 1,422 (-1%) | 2mo | $349,900 | $246 | 82 |
| 643 Callaway Ct | 0.25mi | 3/2.0 | 1,386 (-4%) | 18mo | $249,900 | $180 | 67 |
| 620 Titleist Ct | 0.24mi | 4/2.0 (+1) | 1,564 (+9%) | 4mo | $369,000 | $236 | 66 |
Match score weights: distance 35% · size 25% · config 20% · recency 20%. Top-matched comps best support the ARV.
Projected returns pro-forma
-3.0% appreciation · 2.91% rent growth · sell at horizon
- IRR
- -15.3%
- Equity multiple
- 0.45×
- Total profit
- $-36,712
- Equity at exit
- $35,785
- IRR
- -7.0%
- Equity multiple
- 0.55×
- Total profit
- $-29,961
- Equity at exit
- $20,751
Cash invested: $67,200 (down + closing). Projections, not guarantees.
Landlord ↔ Tenant lean methodology
- Overall (STATE)
- 91 Strongly Landlord-Friendly
- State Idaho
- 91 Strongly Landlord-Friendly · R+18
- County
- — inherits STATE
- City
- — inherits STATE
ZIP-level market 83301
- Rents YoY
- 2.9%
- Active inventory
- 620
- Price-to-rent
- 10.8×
Monthly cashflow live
- Estimated rent
- $1,846 medium interval (Pro) →
- Mortgage (P&I)
- −$1,259
- Tax from tax record
- −$61 /mo · $734/yr
- Insurance
- −$100
- HOA
- −$0
- Vacancy / Maint / Mgmt
- −$388
- Net cashflow
- $39
Break-even live
UW: 25.0% down · 7.5% · 30yr · 1.5% tax · 5.0% vac · 8.0% maint · 8.0% mgmt
Financing live
Cash to close
- Down payment
- $60,000
- Closing costs
- $7,200
- Reserves months
- —
- Total cash needed
- —
Loan-product check · same deal, 3 products live
Conventional
25% down · 7.5% · 30yr
- Down + closing
- —
- Monthly P&I
- —
- Monthly cashflow
- —
- DSCR
- —
- Eligible?
- —
Personal DTI + credit; lowest rate.
DSCR
20% down · 8.5% · 30yr
- Down + closing
- —
- Monthly P&I
- —
- Monthly cashflow
- —
- DSCR
- —
- Eligible?
- —
No personal income docs; deal must DSCR.
Hard money
10% down · 12.0% · 12mo
- Down + closing
- —
- Monthly P&I
- —
- Monthly cashflow
- —
- DSCR
- —
- Eligible?
- —
Short-term bridge; refi at stabilization.
Listing history 16 events
-
2026-06-19days on market $240,000 Active 21 DOM
-
2026-06-18days on market $240,000 Active 20 DOM
-
2026-06-17days on market $240,000 Active 19 DOM
-
2026-06-16days on market $240,000 Active 18 DOM
-
2026-06-15days on market $240,000 Active 17 DOM
-
2026-06-14days on market $240,000 Active 15 DOM
-
2026-06-13days on market $240,000 Active 14 DOM
-
2026-06-10days on market $240,000 Active 12 DOM
-
2026-06-09days on market $240,000 Active 11 DOM
-
2026-06-08days on market $240,000 Active 10 DOM
-
2026-06-07days on market $240,000 Active 9 DOM
-
2026-06-05days on market $240,000 Active 6 DOM
-
2026-06-02days on market $240,000 Active 4 DOM
-
2026-06-01days on market $240,000 Active 3 DOM
-
2026-05-31days on market $240,000 Active 2 DOM
-
2026-05-29$240,000 Active
ⓘ Source: listings_history table (triggers on properties + properties_extension) + one-shot
backfill from property_details.listing_events for pre-trigger history.
Tax reassessment forecast ID · Resets to sale price
- Current annual tax
- $734 · $61/mo
- Projected year-2 tax
- $1,656 · $138/mo
- Expected delta
- +$922/yr (+$77/mo · 125.5%)
ⓘ Screening estimate from a state-policy table — verify with the county assessor before closing.
Climate risk First Street
- Flood 1/10 Low FEMA zone X (unshaded) · 0% chance over 30 yrs
- Wildfire 3/10 Moderate
- Heat 4/10 Moderate 7 d/yr ≥93°F today · 19 d/yr by 30 yrs out
- Wind 1/10 Low
- Air quality 7/10 Severe 12 unhealthy d/yr today · 15 by 30 yrs out
Nearby sold comps map
Loading sold comps map…
Walkable amenities ~0.75 mi
Loading nearby amenities…
Taxation est. · year 1
- Rental income
- $22,154
- − Mortgage interest
- −$13,444
- − Property taxes
- −$734
- − Insurance
- −$1,200
- − Repairs & maintenance
- −$1,772
- − Management
- −$1,772
- − Depreciation
- −$6,982
- Taxable loss
- −$3,750
- Est. tax savings @ 24.0%
- +$900
- After-tax cash flow
- $1,364/yr
For passive investors: Depreciation is non-cash, so a rental often shows a tax loss while cash-flowing — sheltering income. Rental losses are passive: they offset passive income freely, and up to $25,000/yr can offset ordinary (W-2) income if you actively participate and your MAGI is under $100k (phasing out to $0 by $150k); unused losses carry forward. On sale, claimed depreciation is recaptured at up to 25%, and gains may owe capital-gains tax (a 1031 exchange can defer both). Figures are a year-1 estimate at your 24.0% rate — not tax advice; consult a CPA.
Schools (NCES district)
- District
- Twin Falls District
- NCES district ID
- 1603240
- Math proficiency
- 34% ▼ -8.00%
- Reading proficiency
- 49% ▼ -2.00%
- Median HH income
- $44,465
- Composite
- 35.15/100
- National rank
- #5006
- State rank
- #62 of 92 in ID
Livability — Twin Falls
- Score
- 74/100
- State rank
- #33
- US rank
- #4779
Category grades
Schools grade is shown separately in the Schools card above.
Census & demographics
- County
- Twin Falls County · 63,592 people
- City population
- 63,592
- Metro
- Twin Falls, ID
- Population (ZIP)
- 63,592
- Household income
- $62,647
- Rent vs Own
- Severe rent burden
- 1784.0
Population outlook (Twin Falls County) Hauer SSP2
- Today (2025)
- 92,642 people
- By 2030
- 97,900 · +5.7%
- By 2040
- 108,553 · +17.2%
- By 2050
- 119,443 · +28.9%
- By 2075
- 146,906 · +58.6%
- By 2100
- 168,212 · +81.6%
Race, ethnicity, and origin ACS 2023
- Neighborhood character
- Predominantly White (76%)
- Race & ethnicity
- White 76% Hispanic / Latino 16% Two or more races 10% Asian 2%
- Hispanic origin (detail)
- Mexican 14%
- Common ancestry
- Slovak 3% Italian 2% Portuguese 2%
- Foreign-born
- 8% · Canada, India
- Languages at home
- 86% English-only · Spanish 10% Other Indo-European 2% Arabic 1%
Political lean MEDSL · Twin Falls
- 2024 margin
- Solid R (+48.8) · D 24.2% · R 73.1% · Other 2.7%
- 2008→2024 swing
- -12.1pp toward R · 2008: -36.7pp · 2024: -48.8pp
- All cycles
- 2024: R+48.8 2020: R+45.0 2016: R+44.6 2012: R+43.5 2008: R+36.7
Not yet ingested
- Civics
- —
Market trends
- HPI YoY
- ▼ -247.58%
- Current HPI
- 271.0297
- Rent YoY
- ▲ 2.91%
- Metro
- Twin Falls, ID
- State GDP YoY
- ▲ 4.51%
- F500 in state
- 6
Industry mix (Fortune 500 HQ in ID)
| Industry | F500 HQs | Revenue |
|---|---|---|
| Retail | 1 | $79B |
|
||
| Technology | 1 | $25B |
|
||
| Food / Agriculture | 1 | $6B |
|
||
Price history
1 event — show timeline
- 2026-05-29 Listed $240,000 IMLS
Property tax history
+0.1%/yrLatest (2025): $734 · -0.9% YoY. Source: county tax records.
Cash-flow waterfall
monthlySold comps — $/sqft
last 12 mo · ≤1 miLoading sold comps…