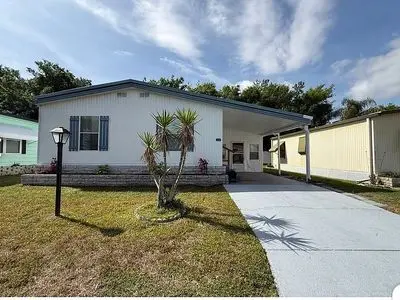
380 Queen Mary Loop · Lakeland, FL
Flood risk No data
- FEMA flood zone
- —
- Chance of flooding over 30 yrs
- —
- Est. flood insurance / yr
- —
Fire risk No data
- Est. fire insurance / yr
- —
Heat risk No data
- Hot days now (above threshold)
- —
- Hot days in 30 yrs
- —
Wind risk No data
- Chance of severe wind over 30 yrs
- —
Air-quality risk No data
- Unhealthy air days now
- —
- Unhealthy air days in 30 yrs
- —
Risk factors via First Street. Map © Google.
Why this score? — see what drove the D+ grade
The composite is a weighted blend of 9 inputs, each scored 0–100. Each bar is that input's sub-score; the figure is the points it added to the 100-point composite (weight × sub-score).
- Cash flow +15.0/30.0
- ARV discount +7.5/15.0
- 1% rule +5.0/10.0
- DSCR +5.0/10.0
- Condition / age +4.0/5.0
- Livability +3.9/5.0
- Schools +3.5/10.0
- Rent growth +2.7/5.0
- Appreciation +0.0/10.0
$29,900
🖨 Deal sheet 📄 Offer letter ✓ Due diligence
Listing remarks
Move in Ready -- Nice and Clean! $695 lot Rent! 55+ community. Newly remodeled manufactured home. Conveniently located just off US Hwy 98 N / I-4 with easy access to bus line, shopping, and numerous restaurants. Brand new kitchen and bath. Laundry room in unit. Covered parking in carport. This home is located in Kings & amp; Queens which is a 55 and older community. Residents enjoy a swimming pool, community clubhouse, fitness center, and on-site activities. Look no further! This spacious 2/1 home has been transformed from the inside out. From the pictures alone you will notice the great clean feeling and finesse, not like other mobilehomes. The pictures do not do it justice. Starting w
Key facts
- Laundry room in unit
- Brand new kitchen
- Community clubhouse
Tags
Neighborhood map
What this means for you Summary
Snapshot
- This is a 2-bed/1.0-bath other listed at $30k. Condition is rated good.
Deal economics
- At list price, monthly cash flow is $991 ($12k/yr) — positive.
- The deal already cash-flows at list — no discount required.
- Meets the 1% rule at list price ($2k rent vs $30k).
- Recommended offer: $29k (3.0% below list) — sets the bar for market timing.
Location & tenants
- Location reads 77/100 on livability (#206 in FL, #3,179 nationally) — a middle-class / working-renter tenant base. Strengths: cost of living A+, housing A+, health & safety A+; Watch: employment D+, amenities F, commute F.
- Polk (suburban): math 39% / reading 43% proficiency, ranked #62 of 73 in FL (top 85%) — families likely to look elsewhere, expect single-tenant / working-renter base with shorter leases.
- Market conditions: Rents flat; 162 active listings in the ZIP; 13 comparable units currently listed for rent nearby; rentals at typical pace (median 19d on market — plan ~3-4 weeks tenant-placement turnaround); 10,384 units permitted in Polk County in 2024 (1,716 in 5+ unit buildings).
Forward outlook
- Local home prices are declining (-3.0%/yr); year-one equity from $207 of loan paydown is wiped out by about $897 of value loss. Plan a longer hold.
- Polk County population projected at +33% by 2050 — long-run rental-demand tailwind backs the buy-and-hold thesis.
- At projected returns (-3.0% appreciation + 0.8% rent growth), your $8k cash investment doubles in ~1 year — after that, you're playing with house money.
Negotiation context
- It's been on market 37 days — a 3% lower offer ($29k) is reasonable based on typical stale-listing flexibility.
Questions for the listing agent
- It's been on market 37 days. Have you received any prior offers? Is the seller open to a 3% concession, seller financing, or rate buy-down credit?
- Is there a deadline driving the sale (1031 exchange, divorce, estate, relocation)? That informs how much negotiation room exists.
- The area grade is low — what's the realistic commute time and amenity access for the typical tenant pool here? Any planned neighborhood developments (good or bad) we should know about?
- What's the average days-on-market for RENTAL listings here right now (not sales)? A rising rental-DOM trend means longer vacancies and softer asking-rent achievability than the comps imply.
- What's the recent tenant-quality profile in this submarket — average credit score on applications, eviction rate, late-payment / NSF rate, and stable-employment percentage? A property-management company in the area should have these aggregated.
- How much new for-sale + rental construction is in the pipeline within 1–3 miles? Heavy new supply typically softens prices + rents 12–24 months out; constrained supply supports both.
Investment metrics
- 1% rule
- 5.07% ✓
- Cap rate
- 46.06%
- Cash-on-cash
- 142.04%
- DSCR
- 7.32
- GRM
- 1.6
CMA / ARV
No comps found within radius.
Projected returns pro-forma
-3.0% appreciation · 0.77% rent growth · sell at horizon
- IRR
- —
- Equity multiple
- 7.57×
- Total profit
- $54,966
- Equity at exit
- $4,458
- IRR
- —
- Equity multiple
- 14.88×
- Total profit
- $116,170
- Equity at exit
- $2,585
Cash invested: $8,372 (down + closing). Projections, not guarantees.
Landlord ↔ Tenant lean methodology
- Overall (STATE)
- 87 Strongly Landlord-Friendly
- State Florida
- 87 Strongly Landlord-Friendly · R+3
- County
- — inherits STATE
- City
- — inherits STATE
ZIP-level market 33805
- Home prices YoY
- -29.8%
- Rents YoY
- 0.8%
- Active inventory
- 162
- Price-to-rent
- 1.6×
Monthly cashflow live
- Estimated rent
- $1,516 high interval (Pro) →
- Mortgage (P&I)
- −$157
- Tax est. 1.5%
- −$37 /mo · $448/yr
- Insurance
- −$12
- HOA
- −$0
- Vacancy / Maint / Mgmt
- −$318
- Net cashflow
- $991
Break-even live
UW: 25.0% down · 7.5% · 30yr · 1.5% tax · 5.0% vac · 8.0% maint · 8.0% mgmt
Financing live
Cash to close
- Down payment
- $7,475
- Closing costs
- $897
- Reserves months
- —
- Total cash needed
- —
Loan-product check · same deal, 3 products live
Conventional
25% down · 7.5% · 30yr
- Down + closing
- —
- Monthly P&I
- —
- Monthly cashflow
- —
- DSCR
- —
- Eligible?
- —
Personal DTI + credit; lowest rate.
DSCR
20% down · 8.5% · 30yr
- Down + closing
- —
- Monthly P&I
- —
- Monthly cashflow
- —
- DSCR
- —
- Eligible?
- —
No personal income docs; deal must DSCR.
Hard money
10% down · 12.0% · 12mo
- Down + closing
- —
- Monthly P&I
- —
- Monthly cashflow
- —
- DSCR
- —
- Eligible?
- —
Short-term bridge; refi at stabilization.
Rent comps 13 comps
| Address | Beds | Baths | Sqft | Rent | $/sqft | DOM | Units | Dist |
|---|---|---|---|---|---|---|---|---|
| 454 King Edward Ave Lakeland, FL | 2.0 | 2.0 | 1048 | $1,399 | $1.33 | 2d | 1 | 0.06mi |
| 3215 Baird Ave Lakeland, FL | 1.0–2.0 | 1.0 | 794 | $1,250 | $1.57 | 13d | 4 | 0.28mi |
| 408 Bassedena Cir N Lakeland, FL | 3.0 | 2.0 | 1075 | $1,825 | $1.70 | 23d | 1 | 0.42mi |
| 123 Oconee St Unit 1368863P Lakeland, FL | 2.0 | 1.0 | 990 | $2,441 | $2.47 | 11d | 1 | 0.49mi |
| 1704 Martin L King Jr Ave Lakeland, FL | 2.0 | 2.0 | 1050 | $5,000 | $4.76 | 23d | 1 | 0.72mi |
| 3150 Pyramid Pkwy Lakeland, FL | 1.0 | 1.0 | 432 | $1,210 | $2.80 | 3d | 3 | 0.73mi |
| 308 W Crescent Dr Unit 2 Lakeland, FL | 1.0 | 1.0 | 700 | $1,150 | $1.64 | 23d | 1 | 0.73mi |
| 617 Lakehurst St Lakeland, FL | 3.0 | 2.0 | 1100 | $1,900 | $1.73 | 18d | 1 | 0.81mi |
| 720 Lakehurst St Lakeland, FL | 3.0 | 2.0 | 1092 | $1,750 | $1.60 | 23d | 1 | 0.82mi |
| 3685 Victoria Manor Dr Lakeland, FL | 3.0 | 1.0–2.0 | 1154 | $1,507 | $1.31 | 3d | 17 | 0.86mi |
| 820 W 13th St Lakeland, FL | 2.0 | 1.0 | 950 | $1,300 | $1.37 | 23d | 1 | 1.05mi |
| 3939 Golf Village Loop Lakeland, FL | 2.0 | 1.0–2.0 | 878 | $1,619 | $1.84 | 3d | 6 | 1.14mi |
| 1211 Robert King High Dr Lakeland, FL | 3.0 | 1.5 | 1050 | $1,625 | $1.55 | 23d | 1 | 1.14mi |
Listing history 15 events
-
2026-06-18days on market $29,900 Active 37 DOM
-
2026-06-17days on market $29,900 Active 36 DOM
-
2026-06-16days on market $29,900 Active 35 DOM
-
2026-06-15days on market $29,900 Active 34 DOM
-
2026-06-13days on market $29,900 Active 32 DOM
-
2026-06-10days on market $29,900 Active 29 DOM
-
2026-06-09days on market $29,900 Active 28 DOM
-
2026-06-08days on market $29,900 Active 27 DOM
-
2026-06-07days on market $29,900 Active 26 DOM
-
2026-06-05days on market $29,900 Active 23 DOM
-
2026-06-03days on market $29,900 Active 21 DOM
-
2026-06-01days on market $29,900 Active 20 DOM
-
2026-05-31days on market $29,900 Active 19 DOM
-
2026-05-13price $29,900
-
2026-05-12$32,500 Active
ⓘ Source: listings_history table (triggers on properties + properties_extension) + one-shot
backfill from property_details.listing_events for pre-trigger history.
Nearby sold comps map
Loading sold comps map…
Walkable amenities ~0.75 mi
Loading nearby amenities…
Taxation est. · year 1
- Rental income
- $18,191
- − Mortgage interest
- −$1,675
- − Property taxes
- −$448
- − Insurance
- −$150
- − Repairs & maintenance
- −$1,455
- − Management
- −$1,455
- − Depreciation
- −$870
- Taxable income
- $12,138
- Est. tax owed @ 24.0%
- −$2,913
- After-tax cash flow
- $8,978/yr
For passive investors: Depreciation is non-cash, so a rental often shows a tax loss while cash-flowing — sheltering income. Rental losses are passive: they offset passive income freely, and up to $25,000/yr can offset ordinary (W-2) income if you actively participate and your MAGI is under $100k (phasing out to $0 by $150k); unused losses carry forward. On sale, claimed depreciation is recaptured at up to 25%, and gains may owe capital-gains tax (a 1031 exchange can defer both). Figures are a year-1 estimate at your 24.0% rate — not tax advice; consult a CPA.
Condition & rehab AI · 1 photo
This move-in-ready, newly remodeled manufactured home in a 55+ community offers a clean and well-maintained living space with potential for further value enhancement through minor cosmetic upgrades.
Value-add opportunities
- Both Painting exterior and interior — Enhances curb appeal and interior aesthetics
- Both Landscaping improvements — Enhances curb appeal and adds value
- Both New flooring — Improves living space and adds value
Renovation cost estimate screening
Value-add ROI direction
- Both Painting exterior and interior — Enhances curb appeal and interior aesthetics ↑
- Both Landscaping improvements — Enhances curb appeal and adds value ↑
- Both New flooring — Improves living space and adds value ↑
ⓘ Cost ranges are severity-bucket heuristics (US national rule-of-thumb). Get contractor quotes + a written scope before underwriting a rehab budget.
Schools (NCES district)
- District
- Polk
- NCES district ID
- 1201590
- Math proficiency
- 39% ▼ -11.00%
- Reading proficiency
- 43% ▼ -4.00%
- Median HH income
- $43,979
- Composite
- 34.74/100
- National rank
- #5132
- State rank
- #62 of 73 in FL
Livability — Lakeland
- Score
- 77/100
- State rank
- #206
- US rank
- #3179
Category grades
Schools grade is shown separately in the Schools card above.
Census & demographics
- Census place
- Lakeland, FL
- County
- Polk County · 740,051 people
- City population
- 277,690
- Metro
- Lakeland-Winter Haven, FL
- Population (ZIP)
- 28,751
- Household income
- $62,661
- Rent vs Own
- Severe rent burden
- 1179.0
Population outlook (Polk County) Hauer SSP2
- Today (2025)
- 752,975 people
- By 2030
- 804,621 · +6.9%
- By 2040
- 906,117 · +20.3%
- By 2050
- 1,000,476 · +32.9%
- By 2075
- 1,197,520 · +59.0%
- By 2100
- 1,271,518 · +68.9%
Race, ethnicity, and origin ACS 2023
- Neighborhood character
- Diverse neighborhood (Simpson 0.68)
- Race & ethnicity
- White 38% Black 37% Hispanic / Latino 20% Two or more races 8% Asian 1%
- Hispanic origin (detail)
- Mexican 5% Puerto Rican 9% Cuban 2%
- Common ancestry
- Hispanic 2% Lithuanian 1% Romanian 1%
- Foreign-born
- 12% · Canada, Jamaica
- Languages at home
- 79% English-only · Spanish 16% French/Haitian/Cajun 2% Other Asian/Pacific 1%
Political lean MEDSL · Polk
- 2024 margin
- Strong R (+20.7) · D 39.2% · R 59.9%
- 2008→2024 swing
- -14.6pp toward R · 2008: -6.1pp · 2024: -20.7pp
- All cycles
- 2024: R+20.7 2020: R+14.4 2016: R+14.1 2012: R+6.8 2008: R+6.1
Not yet ingested
- Civics
- —
Market trends
- HPI YoY
- ▼ -158.44%
- Current HPI
- 372.7317
- Rent YoY
- ▲ 0.77%
- Metro
- Lakeland-Winter Haven, FL
- State GDP YoY
- ▲ 3.28%
- F500 in state
- 36
Industry mix (Fortune 500 HQ in FL)
| Industry | F500 HQs | Revenue |
|---|---|---|
| Industrial Technology | 2 | $29B |
|
||
| Insurance | 2 | $17B |
|
||
| Retail | 1 | $60B |
|
||
| Technology Distribution | 1 | $58B |
|
||
| Homebuilding | 1 | $35B |
|
||
| Technology Manufacturing | 1 | $35B |
|
||
Price history
-8.0% since first listed2 events — show timeline
- 2026-05-13 Price Changed $29,900 FSBO.com
- 2026-05-12 Listed $32,500 FSBO.com
Cash-flow waterfall
monthlySold comps — $/sqft
last 12 mo · ≤1 miLoading sold comps…