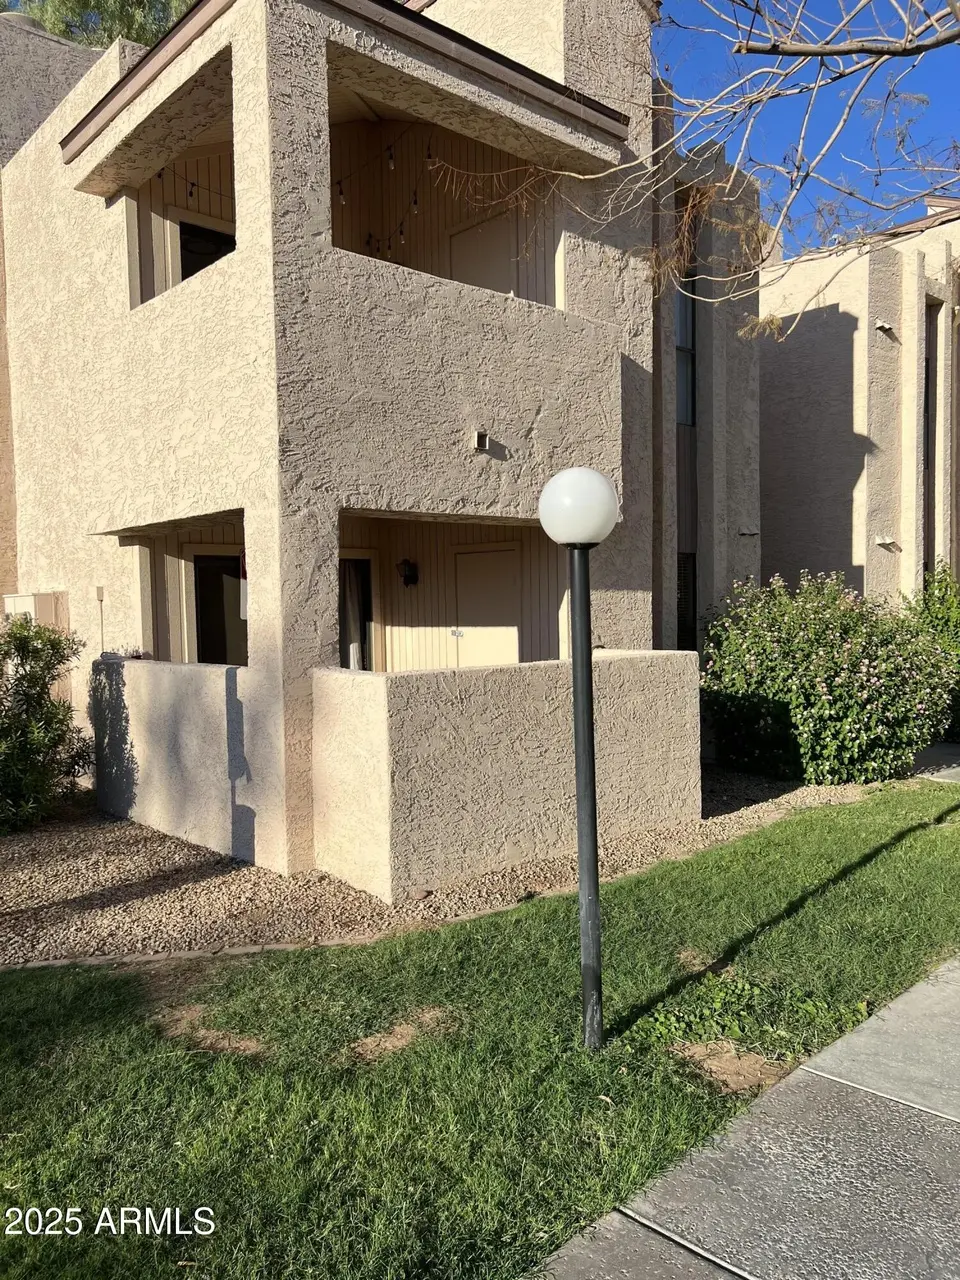
7510 E Thomas Rd #134 · Scottsdale, AZ
Flood risk 1/10 · Minimal
- FEMA flood zone
- X (shaded)
- Chance of flooding over 30 yrs
- 0.0%
- Est. flood insurance / yr
- $507 – $1,088
Fire risk 1/10 · Minimal
- Est. fire insurance / yr
- $610 – $1,132
Heat risk 9/10 · Severe
- Hot days now (above 112°F)
- 7 days/yr
- Hot days in 30 yrs
- 17 days/yr
Wind risk 1/10 · Minimal
- Chance of severe wind over 30 yrs
- —
Air-quality risk 3/10 · Minor
- Unhealthy air days now
- 2 days/yr
- Unhealthy air days in 30 yrs
- 3 days/yr
Risk factors via First Street. Map © Google.
Why this score? — see what drove the C- grade
The composite is a weighted blend of 9 inputs, each scored 0–100. Each bar is that input's sub-score; the figure is the points it added to the 100-point composite (weight × sub-score).
- ARV discount +15.0/15.0
- Cash flow +14.3/30.0
- Schools +4.8/10.0
- 1% rule +4.5/10.0
- DSCR +4.4/10.0
- Livability +4.0/5.0
- Condition / age +2.5/5.0
- Rent growth +2.1/5.0
- Appreciation +0.0/10.0
$209,999
🖨 Deal sheet 📄 Offer letter ✓ Due diligence
Listing remarks MLS
Excellent location, close to shopping's , downtown restaurants, and much more. Cozy place with upgraded floor, kitchen cabinets, granite countertops, and wood fireplace. Covered patio with tennis court view.
Key facts
- Tennis court view
- Wood fireplace
- Covered patio
Tags
Neighborhood map
What this means for you Summary
Snapshot
- This is a 1-bed/1.0-bath condo listed at $210k.
Deal economics
- At list price, monthly cash flow is $40 ($474/yr) — positive.
- The deal already cash-flows at list — no discount required.
- To meet the 1% rule (rent ≥ 1% of price), the offer needs to be $199k (5.0% below list).
- Recommended offer: $185k (12.0% below list) — sets the bar for market timing.
- Cap rate 6.5% vs local median 2.5% in Scottsdale — top-decile yield for the area; either an underpriced asset or a hidden risk that comps aren't pricing in. Stress-test before assuming the spread holds.
Location & tenants
- Location reads 80/100 on livability (#4 in AZ, #1,756 nationally) — a professional / high-income tenant draw. Strengths: amenities A+, commute A+, employment A+; Watch: health & safety C-, cost of living F.
- Scottsdale Unified District (4240) (urban): math 53% / reading 55% proficiency, ranked #30 of 249 in AZ (top 12%) — acceptable for families but not a draw, mixed tenant base, ~2y average lease.
- Market conditions: Rents soft (-1.6%/yr); 582 active listings in the ZIP; 40 comparable units currently listed for rent nearby; rentals at typical pace (median 15d on market — plan ~3-4 weeks tenant-placement turnaround); solid renter incomes; 36,011 units permitted in Maricopa County in 2024 (12,801 in 5+ unit buildings).
Forward outlook
- Local home prices are declining (-3.0%/yr); year-one equity from $1k of loan paydown is wiped out by about $6k of value loss. Plan a longer hold.
- Maricopa County population projected at +38% by 2050 — long-run rental-demand tailwind backs the buy-and-hold thesis.
Negotiation context
- It's been on market 511 days — a 12% lower offer ($185k) is reasonable based on typical stale-listing flexibility.
- 5 sale attempts since 21y ago; this cycle's ask has dropped $63k (23%) from the opening price — seller is motivated, your offer sets the floor, not the list.
- Current owner paid $56k; list at $210k implies a 274% gain — meaningful room to come down on a strong offer.
Risks & watch-outs
- Climate carrying-cost: extreme-heat days projected 7→17/yr by 2055 (HVAC capex compounding) — expect insurance premiums to compound above CPI over the hold.
Questions for the listing agent
- It's been on market 511 days. Have you received any prior offers? Is the seller open to a 12% concession, seller financing, or rate buy-down credit?
- What does the HOA fee cover, when was the last increase, and are there any pending special assessments or reserve-fund shortfalls?
- Any open or pending special assessments — roof, HVAC, plumbing, elevator, façade? What's the per-unit balance and payoff schedule, and is the seller paying it off at close or rolling it to the buyer?
- Why hasn't it sold? Are there any deal-killer items the seller is aware of (foundation, flood, title, zoning, code violations)?
- Is there a deadline driving the sale (1031 exchange, divorce, estate, relocation)? That informs how much negotiation room exists.
- Schools are A-rated — typically a magnet for longer-tenancy family renters. What's the average tenant stay here, and is there a school-zone premium baked into asking?
- What's the average days-on-market for RENTAL listings here right now (not sales)? A rising rental-DOM trend means longer vacancies and softer asking-rent achievability than the comps imply.
- What's the recent tenant-quality profile in this submarket — average credit score on applications, eviction rate, late-payment / NSF rate, and stable-employment percentage? A property-management company in the area should have these aggregated.
- How much new apartment / multifamily construction is in the pipeline within 1–3 miles? Heavy new supply (>2% of stock underway) typically softens rents 12–24 months out; light construction supports rent growth.
Investment metrics
- 1% rule
- 0.95% ✗
- Cap rate
- 6.52%
- Cash-on-cash
- 0.81%
- DSCR
- 1.04
- GRM
- 8.8
CMA / ARV
- ARV (median comp)
- $288,455
- List price
- $209,999
- Delta
- -27.20%
- Verdict
- UNDERPRICED
- Comps
- 20 within 1.0 mi
Projected returns pro-forma
-3.0% appreciation · 0.0% rent growth · sell at horizon
- IRR
- -18.6%
- Equity multiple
- 0.37×
- Total profit
- $-37,274
- Equity at exit
- $31,312
- IRR
- -19.1%
- Equity multiple
- 0.12×
- Total profit
- $-51,471
- Equity at exit
- $18,157
Cash invested: $58,800 (down + closing). Projections, not guarantees.
Landlord ↔ Tenant lean methodology
- Overall (STATE)
- 87 Strongly Landlord-Friendly
- State Arizona
- 87 Strongly Landlord-Friendly · R+3
- County
- — inherits STATE
- City
- — inherits STATE
ZIP-level market 85251
- Rents YoY
- -1.6%
- Active inventory
- 582
- Price-to-rent
- 8.8×
Monthly cashflow live
- Estimated rent
- $1,994 high interval (Pro) →
- Mortgage (P&I)
- −$1,101
- Tax from tax record
- −$44 /mo · $531/yr
- Insurance
- −$87
- HOA
- −$303
- Vacancy / Maint / Mgmt
- −$419
- Net cashflow
- $40
Break-even live
UW: 25.0% down · 7.5% · 30yr · 1.5% tax · 5.0% vac · 8.0% maint · 8.0% mgmt
Financing live
Cash to close
- Down payment
- $52,500
- Closing costs
- $6,300
- Reserves months
- —
- Total cash needed
- —
Loan-product check · same deal, 3 products live
Conventional
25% down · 7.5% · 30yr
- Down + closing
- —
- Monthly P&I
- —
- Monthly cashflow
- —
- DSCR
- —
- Eligible?
- —
Personal DTI + credit; lowest rate.
DSCR
20% down · 8.5% · 30yr
- Down + closing
- —
- Monthly P&I
- —
- Monthly cashflow
- —
- DSCR
- —
- Eligible?
- —
No personal income docs; deal must DSCR.
Hard money
10% down · 12.0% · 12mo
- Down + closing
- —
- Monthly P&I
- —
- Monthly cashflow
- —
- DSCR
- —
- Eligible?
- —
Short-term bridge; refi at stabilization.
Rent comps 40 comps
| Address | Beds | Baths | Sqft | Rent | $/sqft | DOM | Units | Dist |
|---|---|---|---|---|---|---|---|---|
| 7510 E Thomas Rd #316 Scottsdale, AZ | 1.0 | 1.0 | 832 | $3,000 | $3.61 | 44d | 1 | 0.01mi |
| 7510 E Thomas Rd Scottsdale, AZ | 1.0 | 1.0 | 832 | $2,298 | $2.76 | 24d | 3 | 0.03mi |
| 7510 E Thomas Rd Scottsdale, AZ | 1.0 | 1.0 | 832 | $2,425 | $2.91 | 22d | 2 | 0.03mi |
| 7510 E Thomas Rd Scottsdale, AZ | 1.0 | 1.0 | 832 | $2,125 | $2.55 | 16d | 4 | 0.03mi |
| 2992 N Miller Rd Scottsdale, AZ | 2.0 | 2.0 | 1100 | $2,045 | $1.86 | 11d | 2 | 0.06mi |
| 2992 N Miller Rd Scottsdale, AZ | 2.0 | 2.0 | 1088 | $2,095 | $1.93 | 14d | 1 | 0.06mi |
| 2992 N Miller Rd Scottsdale, AZ | 2.0 | 2.0 | 1088 | $2,145 | $1.97 | 15d | 1 | 0.06mi |
| 2992 N Miller Rd Scottsdale, AZ | 2.0 | 2.0 | 1100 | $2,045 | $1.86 | 8d | 2 | 0.06mi |
| 2992 N Miller Rd #111 Scottsdale, AZ | 2.0 | 2.0 | 1113 | $2,095 | $1.88 | 20d | 1 | 0.06mi |
| 7502 E Thomas Rd #309 Scottsdale, AZ | 1.0 | 1.0 | 832 | $1,518 | $1.82 | 3d | 1 | 0.07mi |
| 7440 E Thomas Rd Scottsdale, AZ | 2.0–3.0 | 1.0–2.0 | 987 | $1,249 | $1.26 | 3d | 10 | 0.12mi |
| 7550 E Earll Dr Scottsdale, AZ | 2.0 | 2.0 | 1047 | $1,800 | $1.72 | 17d | 1 | 0.16mi |
| 7494 E Earll Dr #304 Scottsdale, AZ | 2.0 | 2.0 | 861 | $1,650 | $1.92 | 18d | 1 | 0.18mi |
| 7474 E Earll Dr #309 Scottsdale, AZ | 2.0 | 2.0 | 861 | $3,000 | $3.48 | 24d | 1 | 0.21mi |
| 7474 E Earll Dr Unit 1545782P Scottsdale, AZ | 2.0 | 2.0 | 850 | $2,155 | $2.54 | 17d | 1 | 0.21mi |
| 3015 N Scottsdale Rd Scottsdale, AZ | 1.0–3.0 | 1.0–3.0 | 1060 | $1,937 | $1.83 | 1d | 18 | 0.35mi |
| 7791 E Osborn Rd Scottsdale, AZ | 1.0–3.0 | 1.0–2.0 | 937 | $1,438 | $1.53 | 2d | 33 | 0.39mi |
| 7910 E Thomas Rd Unit 1546194P Scottsdale, AZ | 2.0 | 2.0 | 1022 | $2,248 | $2.20 | 20d | 1 | 0.49mi |
| 7910 E Thomas Rd Unit 1545699P Scottsdale, AZ | 2.0 | 2.0 | 1097 | $2,460 | $2.24 | 15d | 1 | 0.49mi |
| 3234 N Scottsdale Rd Scottsdale, AZ | 1.0–2.0 | 1.0–2.0 | 1041 | $1,863 | $1.79 | 2d | 20 | 0.50mi |
| 3130 N Hayden Rd Scottsdale, AZ | 1.0 | 1.0 | 563 | $1,550 | $2.75 | 20d | 2 | 0.50mi |
| 3620 N Miller Rd Scottsdale, AZ | 2.0 | 1.0 | 880 | $1,395 | $1.59 | 8d | 1 | 0.55mi |
| 3300 N Scottsdale Rd Scottsdale, AZ | 2.0 | 1.0–2.0 | 875 | $2,354 | $2.69 | 2d | 29 | 0.57mi |
| 2700 N Hayden Rd Scottsdale, AZ | 1.0–3.0 | 1.0–2.0 | 1043 | $1,574 | $1.51 | 3d | 10 | 0.57mi |
| 7021 E Earll Dr Scottsdale, AZ | 2.0 | 2.0 | 1130 | $4,298 | $3.80 | 3d | 3 | 0.58mi |
| 7021 E Earll Dr Scottsdale, AZ | 2.0 | 1.0–2.0 | 1130 | $4,325 | $3.83 | 44d | 4 | 0.58mi |
| 7021 E Earll Dr Scottsdale, AZ | 2.0 | 2.0 | 1130 | $4,198 | $3.71 | 5d | 4 | 0.58mi |
| 2929 N 70th St Scottsdale, AZ | 1.0–3.0 | 1.0–2.0 | 1038 | $1,463 | $1.41 | 2d | 57 | 0.60mi |
| 2929 N 70th St Scottsdale, AZ | 1.0–3.0 | 1.0–2.0 | 1038 | $1,363 | $1.31 | 11d | 62 | 0.60mi |
| 7601 E 2nd St #24 Scottsdale, AZ | 1.0 | 1.0 | 803 | $5,000 | $6.23 | 18d | 1 | 0.65mi |
| 7601 E 2nd St Scottsdale, AZ | 1.0 | 1.0 | 752 | $3,488 | $4.64 | 4d | 2 | 0.65mi |
| 7601 E 2nd St Scottsdale, AZ | 1.0 | 1.0 | 752 | $3,488 | $4.64 | 24d | 2 | 0.65mi |
| 7601 E 2nd St Scottsdale, AZ | 1.0 | 1.0 | 752 | $4,000 | $5.32 | 44d | 2 | 0.65mi |
| 3015 N Hayden Rd Scottsdale, AZ | 1.0 | 1.0 | 715 | $1,442 | $2.02 | 1d | 10 | 0.65mi |
| 8020 E Thomas Rd Scottsdale, AZ | 1.0–2.0 | 1.0–2.0 | 824 | $1,450 | $1.76 | 24d | 3 | 0.65mi |
| 8020 E Thomas Rd Scottsdale, AZ | 2.0 | 2.0 | 952 | $2,399 | $2.52 | 44d | 1 | 0.66mi |
| 8055 E Thomas Rd Unit C107 Scottsdale, AZ | 1.0 | 1.0 | 627 | $3,000 | $4.78 | 44d | 1 | 0.67mi |
| 3014 N 70th St Unit C Scottsdale, AZ | 2.0 | 1.0 | 800 | $1,300 | $1.62 | 18d | 1 | 0.67mi |
| 7045 E Wilshire Dr #1 Scottsdale, AZ | 2.0 | 2.5 | 900 | $1,400 | $1.56 | 13d | 1 | 0.69mi |
| 8055 E Thomas Rd Scottsdale, AZ | 1.0–2.0 | 1.0–1.5 | 825 | $1,200 | $1.45 | 8d | 3 | 0.71mi |
HOA detail condo
- Monthly dues
- $303 · $3,636/yr
- Assessments
- None detected in remarks — confirm with the listing agent.
Listing history 28 events
-
2026-06-18days on market $209,999 Active 511 DOM
-
2026-06-17days on market $209,999 Active 510 DOM
-
2026-06-16days on market $209,999 Active 509 DOM
-
2026-06-15days on market $209,999 Active 508 DOM
-
2026-06-13days on market $209,999 Active 506 DOM
-
2026-06-09days on market $209,999 Active 502 DOM
-
2026-06-08days on market $209,999 Active 501 DOM
-
2026-06-07days on market $209,999 Active 500 DOM
-
2026-06-04days on market $209,999 Active 497 DOM
-
2026-06-03days on market $209,999 Active 496 DOM
-
2026-06-02days on market $209,999 Active 495 DOM
-
2026-06-01days on market $209,999 Active 494 DOM
-
2026-05-31days on market $209,999 Active 493 DOM
-
2025-11-07price $209,999 208-char remark
Show marketing remark (208 chars)
Excellent location, close to shopping's , downtown restaurants, and much more. Cozy place with upgraded floor, kitchen cabinets, granite countertops, and wood fireplace. Covered patio with tennis court view.
-
2025-10-13status Active 208-char remark
Show marketing remark (208 chars)
Excellent location, close to shopping's , downtown restaurants, and much more. Cozy place with upgraded floor, kitchen cabinets, granite countertops, and wood fireplace. Covered patio with tennis court view.
-
2025-09-24historical Under Contract Accepting Backups 208-char remark
Show marketing remark (208 chars)
Excellent location, close to shopping's , downtown restaurants, and much more. Cozy place with upgraded floor, kitchen cabinets, granite countertops, and wood fireplace. Covered patio with tennis court view.
-
2025-06-29price $222,000 208-char remark
Show marketing remark (208 chars)
Excellent location, close to shopping's , downtown restaurants, and much more. Cozy place with upgraded floor, kitchen cabinets, granite countertops, and wood fireplace. Covered patio with tennis court view.
-
2025-06-05price $239,700 208-char remark
Show marketing remark (208 chars)
Excellent location, close to shopping's , downtown restaurants, and much more. Cozy place with upgraded floor, kitchen cabinets, granite countertops, and wood fireplace. Covered patio with tennis court view.
-
2025-01-23$272,999 Active 208-char remark
Show marketing remark (208 chars)
Excellent location, close to shopping's , downtown restaurants, and much more. Cozy place with upgraded floor, kitchen cabinets, granite countertops, and wood fireplace. Covered patio with tennis court view.
-
2024-07-18historical
-
2023-09-29$295,000 Active
-
2009-10-09soldstatus $56,205
-
2009-09-28historical
-
2009-09-16$59,900
-
2005-08-25soldstatus $131,000
-
2005-08-15soldstatus $131,000
-
2005-06-20historical
-
2005-06-08$132,950
ⓘ Source: listings_history table (triggers on properties + properties_extension) + one-shot
backfill from property_details.listing_events for pre-trigger history.
Tax reassessment forecast AZ · Resets to sale price
- Current annual tax
- $531 · $44/mo
- Projected year-2 tax
- $1,386 · $115/mo
- Expected delta
- +$855/yr (+$71/mo · 160.8%)
ⓘ Screening estimate from a state-policy table — verify with the county assessor before closing.
Climate risk First Street
- Flood 1/10 Low FEMA zone X (shaded) · 0% chance over 30 yrs
- Wildfire 1/10 Low
- Heat 9/10 Extreme 7 d/yr ≥112°F today · 17 d/yr by 30 yrs out
- Wind 1/10 Low
- Air quality 3/10 Moderate 2 unhealthy d/yr today · 3 by 30 yrs out
Nearby sold comps map
Loading sold comps map…
Walkable amenities ~0.75 mi
Loading nearby amenities…
Taxation est. · year 1
- Rental income
- $23,933
- − Mortgage interest
- −$11,763
- − Property taxes
- −$531
- − Insurance
- −$1,050
- − Repairs & maintenance
- −$1,915
- − Management
- −$1,915
- − HOA
- −$3,636
- − Depreciation
- −$6,109
- Taxable loss
- −$2,986
- Est. tax savings @ 24.0%
- +$717
- After-tax cash flow
- $1,191/yr
For passive investors: Depreciation is non-cash, so a rental often shows a tax loss while cash-flowing — sheltering income. Rental losses are passive: they offset passive income freely, and up to $25,000/yr can offset ordinary (W-2) income if you actively participate and your MAGI is under $100k (phasing out to $0 by $150k); unused losses carry forward. On sale, claimed depreciation is recaptured at up to 25%, and gains may owe capital-gains tax (a 1031 exchange can defer both). Figures are a year-1 estimate at your 24.0% rate — not tax advice; consult a CPA.
Schools (NCES district)
- District
- Scottsdale Unified District (4240)
- NCES district ID
- 0407570
- Math proficiency
- 53% ▼ -10.00%
- Reading proficiency
- 55% ▼ -8.00%
- Median HH income
- $70,139
- Composite
- 48.02/100
- National rank
- #2196
- State rank
- #30 of 249 in AZ
Livability — Scottsdale
- Score
- 80/100
- State rank
- #4
- US rank
- #1756
Category grades
Schools grade is shown separately in the Schools card above.
Census & demographics
- Census place
- Scottsdale, AZ
- County
- Maricopa County · 4,537,380 people
- City population
- 290,846
- Metro
- Phoenix-Mesa-Chandler, AZ
- Population (ZIP)
- 40,780
- Household income
- $92,851
- Rent vs Own
- Severe rent burden
- 2259.0
Population outlook (Maricopa County) Hauer SSP2
- Today (2025)
- 4,979,203 people
- By 2030
- 5,378,229 · +8.0%
- By 2040
- 6,156,598 · +23.6%
- By 2050
- 6,872,376 · +38.0%
- By 2075
- 8,401,270 · +68.7%
- By 2100
- 9,247,439 · +85.7%
Race, ethnicity, and origin ACS 2023
- Neighborhood character
- Predominantly White (77%)
- Race & ethnicity
- White 77% Hispanic / Latino 14% Two or more races 10% Asian 2% Black 2%
- Hispanic origin (detail)
- Mexican 11%
- Common ancestry
- Italian 5% Romanian 3% Portuguese 3%
- Foreign-born
- 9% · Canada
- Languages at home
- 88% English-only · Spanish 7% Other Indo-European 2% French/Haitian/Cajun 1%
Political lean MEDSL · Maricopa
- 2024 margin
- Toss-up / Even · D 47.7% · R 51.2% · Other 1.1%
- 2008→2024 swing
- +7.1pp toward D · 2008: -10.6pp · 2024: -3.5pp
- All cycles
- 2024: R+3.5 2020: D+2.2 2016: R+3.5 2012: R+12.0 2008: R+10.6
Not yet ingested
- Civics
- —
Market trends
- HPI YoY
- ▼ -672.80%
- Current HPI
- 372.433
- Rent YoY
- ▼ -1.58%
- Metro
- Phoenix-Mesa-Chandler, AZ
- State GDP YoY
- ▲ 4.54%
- F500 in state
- 20
Industry mix (Fortune 500 HQ in AZ)
| Industry | F500 HQs | Revenue |
|---|---|---|
| Technology | 2 | $13B |
|
||
| Mining / Metals | 1 | $23B |
|
||
| Environmental Services | 1 | $16B |
|
||
| Metals / Steel | 1 | $14B |
|
||
| Technology Distribution | 1 | $9B |
|
||
| Homebuilding | 1 | $8B |
|
||
Price history
+58.0% since first listed15 events — show timeline
- 2025-11-07 Price Changed $209,999 ARMLS
- 2025-10-13 Relisted — ARMLS
- 2025-09-24 Contingent — ARMLS
- 2025-06-29 Price Changed $222,000 ARMLS
- 2025-06-05 Price Changed $239,700 ARMLS
- 2025-01-23 Listed $272,999 ARMLS
- 2024-07-18 Listing Removed — ARMLS
- 2023-09-29 Listed $295,000 ARMLS
- 2009-10-09 Sold (MLS) $56,205 ARMLS
- 2009-09-28 Listing Removed — ARMLS
- 2009-09-16 Listed $59,900 ARMLS
- 2005-08-25 Sold (Public Records) $131,000 Public Records
- 2005-08-15 Sold (MLS) $131,000 ARMLS
- 2005-06-20 Listing Removed — ARMLS
- 2005-06-08 Listed $132,950 ARMLS
Property tax history
-0.6%/yrLatest (2025): $531 · +4.4% YoY. Source: county tax records.
Cash-flow waterfall
monthlySold comps — $/sqft
last 12 mo · ≤1 miLoading sold comps…