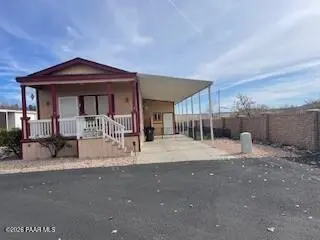
11250 Az-69 #2116 · Prescott Valley, AZ
Flood risk 8/10 · Major
- FEMA flood zone
- X
- Chance of flooding over 30 yrs
- 0.26%
- Est. flood insurance / yr
- $435 – $905
Fire risk 6/10 · Moderate
- Est. fire insurance / yr
- $610 – $1,132
Heat risk 5/10 · Moderate
- Hot days now (above threshold)
- 7 days/yr
- Hot days in 30 yrs
- 18 days/yr
Wind risk No data
- Chance of severe wind over 30 yrs
- —
Air-quality risk 1/10 · Minimal
- Unhealthy air days now
- 0 days/yr
- Unhealthy air days in 30 yrs
- 0 days/yr
Risk factors via First Street. Map © Google.
Why this score? — see what drove the B- grade
The composite is a weighted blend of 9 inputs, each scored 0–100. Each bar is that input's sub-score; the figure is the points it added to the 100-point composite (weight × sub-score).
- Cash flow +26.1/30.0
- ARV discount +14.8/15.0
- DSCR +8.8/10.0
- 1% rule +6.9/10.0
- Livability +3.1/5.0
- Schools +2.9/10.0
- Condition / age +2.8/5.0
- Rent growth +2.5/5.0
- Appreciation +0.0/10.0
$120,000
🖨 Deal sheet 📄 Offer letter ✓ Due diligence
Listing remarks MLS
This charming home on a corner lot.Nice view from front porch. Back Yard beautiful mountain view. Open floor plan, relax in the Livingroom looking into the Dining room & Kitchen with all electric white appliances. Laundry nook w/stacked front load W/D.Master & Guest Bedroom & baths, w/walk in showers.3 Ceiling fans in, LR, MBR & GBR. Turf fenced in side yard & Pavers to park Golf Cart. Shed under Carport.A/C w/Heat pump. An adorable home is on a friendly & quite street55+ community background check required
Key facts
- Open floor plan
- Walk in showers
- Laundry nook
Tags
Neighborhood map
What this means for you Summary
Snapshot
- This is a 2-bed/2.0-bath single-family listed at $120k. Condition is rated average.
Deal economics
- At list price, monthly cash flow is $246 ($3k/yr) — positive.
- The deal already cash-flows at list — no discount required.
- Meets the 1% rule at list price ($1k rent vs $120k).
- Recommended offer: $113k (6.0% below list) — sets the bar for market timing.
- Cap rate 9.3% vs local median 3.2% in Prescott Valley — top-decile yield for the area; either an underpriced asset or a hidden risk that comps aren't pricing in. Stress-test before assuming the spread holds.
Location & tenants
- Location reads 62/100 on livability (#126 in AZ) — a middle-class / working-renter tenant base. Strengths: housing A+, crime A-; Watch: schools C-, amenities F, commute F.
- Humboldt Unified District (4469) (suburban): math 31% / reading 37% proficiency, ranked #94 of 249 in AZ (top 38%) — families likely to look elsewhere, expect single-tenant / working-renter base with shorter leases.
- Market conditions: 266 active listings in the ZIP; 1 comparable units currently listed for rent nearby; 2,062 units permitted in Yavapai County in 2024 (98 in 5+ unit buildings).
Forward outlook
- Local home prices are declining (-3.0%/yr); year-one equity from $830 of loan paydown is wiped out by about $4k of value loss. Plan a longer hold.
- Yavapai County population projected at +10% by 2050 — modest demand growth; plan on rents tracking national, not racing it.
Negotiation context
- It's been on market 64 days — a 6% lower offer ($113k) is reasonable based on typical stale-listing flexibility.
Risks & watch-outs
- Watch-outs: flood insurance adds $56/mo.
- Climate carrying-cost: severe flood risk; major wildfire risk; extreme-heat days projected 7→18/yr by 2055 (HVAC capex compounding) — expect insurance premiums to compound above CPI over the hold.
Questions for the listing agent
- It's been on market 64 days. Have you received any prior offers? Is the seller open to a 6% concession, seller financing, or rate buy-down credit?
- What's the actual annual flood-insurance premium (NFIP or private), and is the property in a SFHA with mandatory coverage?
- Why hasn't it sold? Are there any deal-killer items the seller is aware of (foundation, flood, title, zoning, code violations)?
- Is there a deadline driving the sale (1031 exchange, divorce, estate, relocation)? That informs how much negotiation room exists.
- What's the average days-on-market for RENTAL listings here right now (not sales)? A rising rental-DOM trend means longer vacancies and softer asking-rent achievability than the comps imply.
- What's the recent tenant-quality profile in this submarket — average credit score on applications, eviction rate, late-payment / NSF rate, and stable-employment percentage? A property-management company in the area should have these aggregated.
- How much new for-sale + rental construction is in the pipeline within 1–3 miles? Heavy new supply typically softens prices + rents 12–24 months out; constrained supply supports both.
Investment metrics
- 1% rule
- 1.19% ✓
- Cap rate
- 9.32%
- Cash-on-cash
- 10.80%
- DSCR
- 1.48
- GRM
- 7.0
CMA / ARV
- ARV (median comp)
- $143,250
- List price
- $120,000
- Delta
- -16.23%
- Verdict
- UNDERPRICED
- Comps
- 10 within 1.0 mi
Show comp detail 5 sales within ~0.75 mi
| Address | Dist | Beds/Ba | Sqft | Sold | Price | $/sf | Match |
|---|---|---|---|---|---|---|---|
| 11250 Arizona 69 #2130 | 0.00mi | 1/1.0 (-1) | 884 (+0%) | 4mo | $123,000 | $139 | 88 |
| 1101 E Windmill Dr | 0.14mi | 2/1.5 | 896 (+2%) | 9mo | $117,000 | $131 | 82 |
| 11250 E State Route 69 #1107 #1107 | 0.29mi | 2/1.0 | 840 (-5%) | 1mo | $134,500 | $160 | 74 |
| 2214 Dove Dr | 0.10mi | 2/2.0 | 1,000 (+13%) | 4mo | $140,000 | $140 | 70 |
| 1165 Rocking M Ln | 0.10mi | 3/2.0 (+1) | 980 (+11%) | 3mo | $146,500 | $149 | 70 |
Match score weights: distance 35% · size 25% · config 20% · recency 20%. Top-matched comps best support the ARV.
Projected returns pro-forma
-3.0% appreciation · 3.0% rent growth · sell at horizon
- IRR
- -2.9%
- Equity multiple
- 0.89×
- Total profit
- $-3,692
- Equity at exit
- $17,892
- IRR
- 6.8%
- Equity multiple
- 1.51×
- Total profit
- $17,225
- Equity at exit
- $10,375
Cash invested: $33,600 (down + closing). Projections, not guarantees.
Landlord ↔ Tenant lean methodology
- Overall (STATE)
- 87 Strongly Landlord-Friendly
- State Arizona
- 87 Strongly Landlord-Friendly · R+3
- County
- — inherits STATE
- City
- — inherits STATE
ZIP-level market 86327
- Home prices YoY
- -11.8%
- Active inventory
- 266
- Price-to-rent
- 7.0×
Monthly cashflow live
- Estimated rent
- $1,432 medium interval (Pro) →
- Mortgage (P&I)
- −$629
- Tax est. 1.5%
- −$150 /mo · $1,800/yr
- Insurance
- −$50
- Flood insurance flood zone
- −$56 /mo · $670/yr
- HOA
- −$0
- Vacancy / Maint / Mgmt
- −$301
- Net cashflow
- $246
Break-even live
UW: 25.0% down · 7.5% · 30yr · 1.5% tax · 5.0% vac · 8.0% maint · 8.0% mgmt
Financing live
Cash to close
- Down payment
- $30,000
- Closing costs
- $3,600
- Reserves months
- —
- Total cash needed
- —
Loan-product check · same deal, 3 products live
Conventional
25% down · 7.5% · 30yr
- Down + closing
- —
- Monthly P&I
- —
- Monthly cashflow
- —
- DSCR
- —
- Eligible?
- —
Personal DTI + credit; lowest rate.
DSCR
20% down · 8.5% · 30yr
- Down + closing
- —
- Monthly P&I
- —
- Monthly cashflow
- —
- DSCR
- —
- Eligible?
- —
No personal income docs; deal must DSCR.
Hard money
10% down · 12.0% · 12mo
- Down + closing
- —
- Monthly P&I
- —
- Monthly cashflow
- —
- DSCR
- —
- Eligible?
- —
Short-term bridge; refi at stabilization.
Rent comps 1 comps
| Address | Beds | Baths | Sqft | Rent | $/sqft | DOM | Units | Dist |
|---|---|---|---|---|---|---|---|---|
| 959 N Old Chisholm Trl Apt 01 Dewey, AZ | 1.0 | 2.0 | 960 | $1,175 | $1.22 | 43d | 1 | 0.84mi |
Listing history 16 events
-
2026-06-18days on market $120,000 Active 64 DOM
-
2026-06-17days on market $120,000 Active 63 DOM
-
2026-06-16price $120,000 Active 62 DOM
-
2026-06-16days on market $135,000 Active 62 DOM
-
2026-06-15days on market $135,000 Active 61 DOM
-
2026-06-14days on market $135,000 Active 59 DOM
-
2026-06-13days on market $135,000 Active 58 DOM
-
2026-06-10days on market $135,000 Active 56 DOM
-
2026-06-09days on market $135,000 Active 55 DOM
-
2026-06-08days on market $135,000 Active 54 DOM
-
2026-06-07days on market $135,000 Active 53 DOM
-
2026-06-02days on market $135,000 Active 48 DOM
-
2026-06-01days on market $135,000 Active 47 DOM
-
2026-05-31days on market $135,000 Active 46 DOM
-
2026-05-30days on market $135,000 Active 45 DOM
-
2026-04-15$135,000 Active 536-char remark
Show marketing remark (536 chars)
This charming home on a corner lot.Nice view from front porch. Back Yard beautiful mountain view. Open floor plan, relax in the Livingroom looking into the Dining room & Kitchen with all electric white appliances. Laundry nook w/stacked front load W/D.Master & Guest Bedroom & baths, w/walk in showers.3 Ceiling fans in, LR, MBR & GBR. Turf fenced in side yard & Pavers to park Golf Cart. Shed under Carport.A/C w/Heat pump. An adorable home is on a friendly & quite street55+ community background check required
ⓘ Source: listings_history table (triggers on properties + properties_extension) + one-shot
backfill from property_details.listing_events for pre-trigger history.
Climate risk First Street
- Flood 8/10 Severe FEMA zone X · 26% chance over 30 yrs
- Wildfire 6/10 Major
- Heat 5/10 Major
- Air quality 1/10 Low 0 unhealthy d/yr today · 0 by 30 yrs out
Nearby sold comps map
Loading sold comps map…
Walkable amenities ~0.75 mi
Loading nearby amenities…
Taxation est. · year 1
- Rental income
- $17,189
- − Mortgage interest
- −$6,722
- − Property taxes
- −$1,800
- − Insurance
- −$1,270
- − Repairs & maintenance
- −$1,375
- − Management
- −$1,375
- − Depreciation
- −$3,491
- Taxable income
- $1,156
- Est. tax owed @ 24.0%
- −$277
- After-tax cash flow
- $2,680/yr
For passive investors: Depreciation is non-cash, so a rental often shows a tax loss while cash-flowing — sheltering income. Rental losses are passive: they offset passive income freely, and up to $25,000/yr can offset ordinary (W-2) income if you actively participate and your MAGI is under $100k (phasing out to $0 by $150k); unused losses carry forward. On sale, claimed depreciation is recaptured at up to 25%, and gains may owe capital-gains tax (a 1031 exchange can defer both). Figures are a year-1 estimate at your 24.0% rate — not tax advice; consult a CPA.
Condition & rehab AI · 10 photos
A charming home with average condition, requiring cosmetic repairs and updates to enhance its resale and rental value.
Repairs flagged
- Moderate exterior siding — visible wear
- Minor kitchen cabinets — slight wear
Value-add opportunities
- Both paint interior walls — enhances curb appeal and interior aesthetics
- Both replace kitchen cabinets — modernizes the kitchen and improves functionality
- Both landscaping — enhances curb appeal and adds value
- Both replace exterior siding — improves curb appeal and structural integrity
Renovation cost estimate screening
| Repair item | Severity | Est. cost |
|---|---|---|
| exterior siding · visible wear | Moderate | $3,000–15,000 |
| kitchen cabinets · slight wear | Minor | $500–3,000 |
| Total estimated repair cost · 2 items | $3,500–18,000 |
Value-add ROI direction
- Both paint interior walls — enhances curb appeal and interior aesthetics ↑
- Both replace kitchen cabinets — modernizes the kitchen and improves functionality ↑
- Both landscaping — enhances curb appeal and adds value ↑
- Both replace exterior siding — improves curb appeal and structural integrity ↑
ⓘ Cost ranges are severity-bucket heuristics (US national rule-of-thumb). Get contractor quotes + a written scope before underwriting a rehab budget.
Schools (NCES district)
- District
- Humboldt Unified District (4469)
- NCES district ID
- 0403870
- Math proficiency
- 31% ▼ -13.00%
- Reading proficiency
- 37% ▼ -14.00%
- Median HH income
- $45,326
- Composite
- 29.06/100
- National rank
- #6605
- State rank
- #94 of 249 in AZ
Livability — Prescott Valley
- Score
- 62/100
- State rank
- #126
- US rank
- #16160
Category grades
Schools grade is shown separately in the Schools card above.
Census & demographics
- Census place
- Prescott Valley, AZ
- County
- Yavapai County · 190,406 people
- City population
- 63,155
- Metro
- Prescott Valley-Prescott, AZ
- Population (ZIP)
- 12,154
- Household income
- $71,512
- Rent vs Own
- Severe rent burden
- 70.0
Population outlook (Yavapai County) Hauer SSP2
- Today (2025)
- 241,389 people
- By 2030
- 249,523 · +3.4%
- By 2040
- 259,966 · +7.7%
- By 2050
- 264,736 · +9.7%
- By 2075
- 269,334 · +11.6%
- By 2100
- 256,505 · +6.3%
Race, ethnicity, and origin ACS 2023
- Neighborhood character
- Predominantly White (86%)
- Race & ethnicity
- White 86% Hispanic / Latino 9% Two or more races 6%
- Hispanic origin (detail)
- Mexican 8%
- Common ancestry
- Lithuanian 4% Romanian 3% Slovak 2%
- Foreign-born
- 3% · Canada
- Languages at home
- 95% English-only · Spanish 3% German/W. Germanic 1% French/Haitian/Cajun 1%
Political lean MEDSL · Yavapai
- 2024 margin
- Solid R (+33.9) · D 32.6% · R 66.5%
- 2008→2024 swing
- -9.5pp toward R · 2008: -24.4pp · 2024: -33.9pp
- All cycles
- 2024: R+33.9 2020: R+29.3 2016: R+31.4 2012: R+30.7 2008: R+24.4
Not yet ingested
- Civics
- —
Market trends
- HPI YoY
- ▼ -43.08%
- Current HPI
- 320.6301
- Rent YoY
- —
- Metro
- Prescott Valley-Prescott, AZ
- State GDP YoY
- ▲ 4.54%
- F500 in state
- 20
Industry mix (Fortune 500 HQ in AZ)
| Industry | F500 HQs | Revenue |
|---|---|---|
| Technology | 2 | $13B |
|
||
| Mining / Metals | 1 | $23B |
|
||
| Environmental Services | 1 | $16B |
|
||
| Metals / Steel | 1 | $14B |
|
||
| Technology Distribution | 1 | $9B |
|
||
| Homebuilding | 1 | $8B |
|
||
Price history
1 event — show timeline
- 2026-04-15 Listed $135,000 PAARMLS as Distributed by MLS Grid
Cash-flow waterfall
monthlySold comps — $/sqft
last 12 mo · ≤1 miLoading sold comps…