 🏷️ Likely Rental
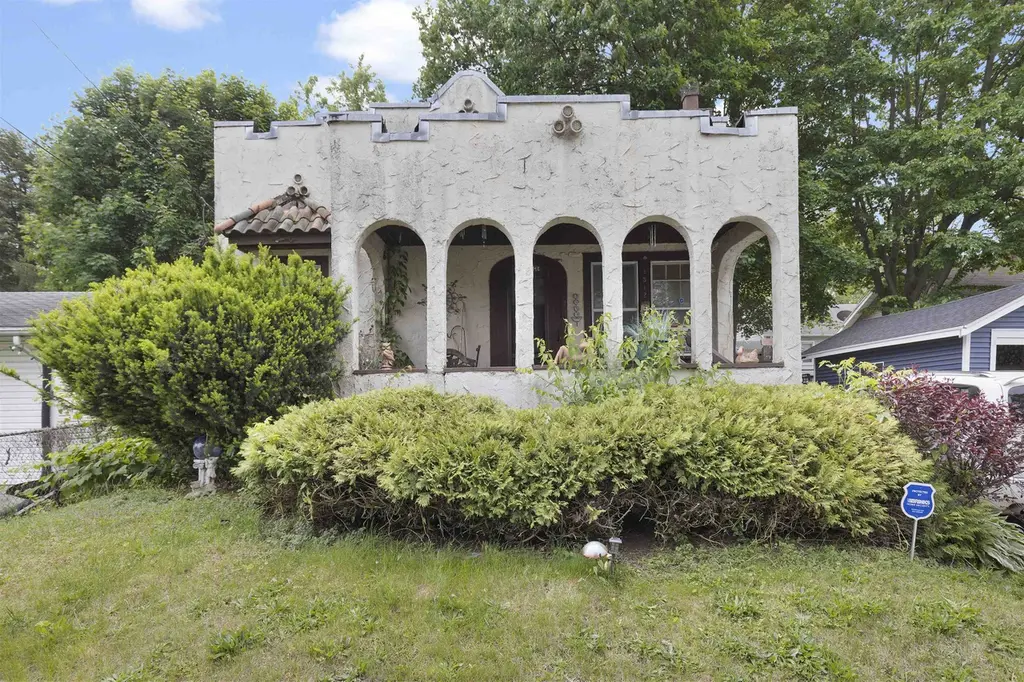
2512 Andrews St · Rockford, IL
Flood risk 1/10 · Minimal
- FEMA flood zone
- X (unshaded)
- Chance of flooding over 30 yrs
- 0.0%
- Est. flood insurance / yr
- $473 – $860
Fire risk 1/10 · Minimal
- Est. fire insurance / yr
- $804 – $1,492
Heat risk 2/10 · Minimal
- Hot days now (above 102°F)
- 7 days/yr
- Hot days in 30 yrs
- 15 days/yr
Wind risk 2/10 · Minimal
- Chance of severe wind over 30 yrs
- —
Air-quality risk 2/10 · Minimal
- Unhealthy air days now
- 1 days/yr
- Unhealthy air days in 30 yrs
- 2 days/yr
Risk factors via First Street. Map © Google.
Why this score? — see what drove the B grade
The composite is a weighted blend of 9 inputs, each scored 0–100. Each bar is that input's sub-score; the figure is the points it added to the 100-point composite (weight × sub-score).
- Cash flow +30.0/30.0
- ARV discount +15.0/15.0
- 1% rule +10.0/10.0
- DSCR +10.0/10.0
- Livability +3.1/5.0
- Rent growth +2.5/5.0
- Condition / age +2.5/5.0
- Schools +1.2/10.0
- Appreciation +0.0/10.0
$65,000
🖨 Deal sheet (PDF) 📄 Offer letter ✓ Due diligence
Listing remarks
Charming Spanish Revival-style bungalow with 2 bedrooms and 1 bathroom. Tenant occupied with a long term tenant. Spacious living room with a wood burning fireplace, separate dining space and galley-style kitchen. Needs TLC, no FHA/VA
Key facts
- 4,356 sq ft lot
- Built 1940
- Listed 17 days
Property features AI
Finance
- Other: Annual tax amount: $598
Exterior
- Utilities: Public water; Public sewer
- Home design: Single-family residence; House (residential property)
- Exterior features: 0.1-acre lot
Interior
- Kitchen: Gas cooktop
- Bathrooms: 1 full bathroom; 1 main-level bathroom
- Heating & cooling: Forced air heating
- Interior features: Gas cooktop; Gas water heater; Full basement
Neighborhood map
What this means for you Summary
Snapshot
- This is a 2-bed/1.0-bath single-family listed at $65k.
Deal economics
- At list price, monthly cash flow is $501 ($6k/yr) — positive.
- The deal already cash-flows at list — no discount required.
- Meets the 1% rule at list price ($1k rent vs $65k).
- Recommended offer: $64k (1.5% below list) — sets the bar for market timing.
- Cap rate 15.5% vs local median 6.1% in Rockford — top-decile yield for the area; either an underpriced asset or a hidden risk that comps aren't pricing in. Stress-test before assuming the spread holds.
Location & tenants
- Location reads 62/100 on livability (#876 in IL) — a middle-class / working-renter tenant base. Strengths: cost of living A+, housing A+, health & safety A+; Watch: crime F, amenities F, commute F.
- Rockford SD 205 (urban): math 12% / reading 16% proficiency, ranked #533 of 620 in IL (top 86%) — low school quality limits family demand, transient renter base, plan for 1-2y turnover; 73% free/reduced lunch — lower-income household profile, screen leases tightly.
- Zoned schools: Kennedy Middle School (math 3% / reading 2%, grade F, #660 of 665 statewide, top 100%, 380 students, 0% FRL); Auburn High School (math 26% / reading 32%, grade F, #210 of 693 statewide, top 30%, 1,936 students, 0% FRL) — zoned schools average 0% FRL vs 73% district-wide (73 pts lower); this property's tenant base skews higher-income than the district average.
- Market conditions: 76 active listings in the ZIP; 14 comparable units currently listed for rent nearby; rentals at typical pace (median 22d on market — plan ~3-4 weeks tenant-placement turnaround); 285 units permitted in Winnebago County in 2024 (0 in 5+ unit buildings).
- This rent runs 30% of the median local income ($46k/yr) — at the standard rent-burdened threshold; future hikes will face affordability resistance.
Forward outlook
- Local home prices are declining (-3.0%/yr); year-one equity from $449 of loan paydown is wiped out by about $2k of value loss. Plan a longer hold.
- Winnebago County population projected at -20% by 2050 — secular population decline; favor cash flow + early exit over multi-decade hold.
- At projected returns (-3.0% appreciation + 3.0% rent growth), your $18k cash investment doubles in ~4 years — after that, you're playing with house money.
Negotiation context
- It's been on market 17 days — a 2% lower offer ($64k) is reasonable based on typical stale-listing flexibility.
- Current owner paid $17k; list at $65k implies a 282% gain — meaningful room to come down on a strong offer.
Risks & watch-outs
- Watch-outs: built in 1940 — expect roof / HVAC / electrical / plumbing capex.
Questions for the listing agent
- Built in 1940 — when were the roof, HVAC, electrical panel, plumbing, and water heater last replaced?
- Is there a deadline driving the sale (1031 exchange, divorce, estate, relocation)? That informs how much negotiation room exists.
- Schools are F-rated, which usually means shorter tenancies and higher turnover. Who's the typical renter profile here, and what's been the actual vacancy rate?
- Crime grade is F in this area — have there been break-ins, vandalism, or insurance claims at this property in the last 3 years? What carrier currently insures it and at what premium?
- What's the average days-on-market for RENTAL listings here right now (not sales)? A rising rental-DOM trend means longer vacancies and softer asking-rent achievability than the comps imply.
- What's the recent tenant-quality profile in this submarket — average credit score on applications, eviction rate, late-payment / NSF rate, and stable-employment percentage? A property-management company in the area should have these aggregated.
- How much new for-sale + rental construction is in the pipeline within 1–3 miles? Heavy new supply typically softens prices + rents 12–24 months out; constrained supply supports both.
Investment metrics
- 1% rule
- 1.79% ✓
- Cap rate
- 15.55%
- Cash-on-cash
- 33.05%
- DSCR
- 2.47
- GRM
- 4.7
CMA / ARV
- ARV (on-the-fly)
- $104,448
- Comps found
- 12
Show comp detail 12 sales within ~0.75 mi
| Address | Dist | Beds/Ba | Sqft | Sold | Price | $/sf | Match |
|---|---|---|---|---|---|---|---|
| 2213 Mulberry St | 0.23mi | 2/1.0 | 864 (+6%) | 4mo | $42,000 | $49 | 76 |
| 317 N Horace Ave | 0.14mi | 2/1.0 | 715 (-12%) | 1mo | $109,000 | $152 | 72 |
| 702 N Independence Ave | 0.53mi | 2/1.0 | 823 (+1%) | 6mo | $100,000 | $122 | 69 |
| 610 N Horace Ave | 0.28mi | 2/1.0 | 896 (+10%) | 7mo | $116,900 | $130 | 65 |
| 414 Howard Ave | 0.51mi | 2/1.0 | 768 (-6%) | 4mo | $68,000 | $89 | 63 |
| 917 Willard Ave | 0.53mi | 2/1.0 | 768 (-6%) | 6mo | $98,000 | $128 | 61 |
| 2315 Chestnut St | 0.34mi | 2/1.0 | 932 (+14%) | 7mo | $125,000 | $134 | 54 |
| 906 N Central Ave | 0.66mi | 2/1.0 | 768 (-6%) | 9mo | $74,900 | $98 | 52 |
| 210 Stewart Ave | 0.48mi | 2/1.0 | 696 (-15%) | 5mo | $107,000 | $154 | 49 |
| 1107 N Sunset Ave | 0.70mi | 2/1.0 | 725 (-11%) | 4mo | $65,000 | $90 | 45 |
| 920 Oakley Ave | 0.74mi | 3/2.0 (+1) | 900 (+10%) | 3mo | $128,000 | $142 | 37 |
| 406 S Independence Ave | 0.67mi | 3/1.0 (+1) | 936 (+15%) | 7mo | $105,000 | $112 | 33 |
Match score weights: distance 35% · size 25% · config 20% · recency 20%. Top-matched comps best support the ARV.
Projected returns pro-forma
-3.0% appreciation · 3.0% rent growth · sell at horizon
- IRR
- 28.2%
- Equity multiple
- 2.18×
- Total profit
- $21,394
- Equity at exit
- $9,692
- IRR
- 35.7%
- Equity multiple
- 4.28×
- Total profit
- $59,732
- Equity at exit
- $5,620
Cash invested: $18,200 (down + closing). Projections, not guarantees.
Landlord ↔ Tenant lean methodology
- Overall (STATE)
- 43 Moderately Tenant-Leaning
- State Illinois
- 43 Moderately Tenant-Leaning · D+7
- County
- — inherits STATE
- City
- — inherits STATE
ZIP-level market 61101
- Home prices YoY
- -25.4%
- Active inventory
- 76
- Price-to-rent
- 4.7×
Monthly cashflow live
- Estimated rent
- $1,161 high interval (Pro) →
- Mortgage (P&I)
- −$341
- Tax from tax record
- −$48 /mo · $576/yr
- Insurance
- −$27
- HOA
- −$0
- Vacancy / Maint / Mgmt
- −$244
- Net cashflow
- $501
Break-even live
Sensitivity live
| Price | -10% $538 | -5% $520 | +0% $501 | +5% $483 | +10% $465 |
|---|---|---|---|---|---|
| Rent | -10% $410 | -5% $455 | +0% $501 | +5% $547 | +10% $593 |
| Rate | -1.0pp $534 | -0.5pp $518 | base $501 | +0.5pp $484 | +1.0pp $467 |
UW: 25.0% down · 7.5% · 30yr · 1.5% tax · 5.0% vac · 8.0% maint · 8.0% mgmt
Financing live
Cash to close
- Down payment
- $16,250
- Closing costs
- $1,950
- Reserves months
- —
- Total cash needed
- —
Loan-product check · same deal, 3 products live
Conventional
25% down · 7.5% · 30yr
- Down + closing
- —
- Monthly P&I
- —
- Monthly cashflow
- —
- DSCR
- —
- Eligible?
- —
Personal DTI + credit; lowest rate.
DSCR
20% down · 8.5% · 30yr
- Down + closing
- —
- Monthly P&I
- —
- Monthly cashflow
- —
- DSCR
- —
- Eligible?
- —
No personal income docs; deal must DSCR.
Hard money
10% down · 12.0% · 12mo
- Down + closing
- —
- Monthly P&I
- —
- Monthly cashflow
- —
- DSCR
- —
- Eligible?
- —
Short-term bridge; refi at stabilization.
Rent comps 14 comps
| Address | Beds | Baths | Sqft | Rent | $/sqft | DOM | Units | Dist |
|---|---|---|---|---|---|---|---|---|
| 2305 School St Unit 2305-7 Rockford, IL | 2.0 | 1.0 | 875 | $995 | $1.14 | 44d | 1 | 0.15mi |
| 2011 School St Rockford, IL | 3.0 | 1.0 | 950 | $1,500 | $1.58 | 44d | 1 | 0.31mi |
| 924 N Sunset Ave Rockford, IL | 2.0 | 1.0 | 725 | $1,050 | $1.45 | 13d | 1 | 0.57mi |
| 1826 Green St Rockford, IL | 2.0 | 1.0 | 1000 | $1,300 | $1.30 | 21d | 1 | 0.60mi |
| 504 Lexington Ave Rockford, IL | 2.0 | 1.0 | 700 | $1,300 | $1.86 | 13d | 1 | 0.79mi |
| 912 Furman St Rockford, IL | 2.0 | 1.0 | 1000 | $1,300 | $1.30 | 13d | 1 | 0.82mi |
| 1116 Irving Ave Unit 1116-301 Rockford, IL | 2.0 | 1.0 | 800 | $950 | $1.19 | 21d | 1 | 0.83mi |
| 1118 Furman St Unit 1118-15 Rockford, IL | 1.0 | 1.0 | 650 | $995 | $1.53 | 44d | 1 | 0.90mi |
| 1118 Furman St Unit 1118-13 Rockford, IL | 1.0 | 1.0 | 650 | $995 | $1.53 | 21d | 1 | 0.90mi |
| 615 Newport Ave Rockford, IL | 2.0 | 1.0 | 700 | $1,300 | $1.86 | 13d | 1 | 1.09mi |
| 3834 Preston St Rockford, IL | 3.0 | 1.0 | 912 | $1,300 | $1.43 | 13d | 1 | 1.09mi |
| 1413 La Belle Ave Rockford, IL | 2.0 | 1.0 | 900 | $1,200 | $1.33 | 44d | 1 | 1.27mi |
| 1614 Pauline Ave Rockford, IL | 2.0 | 1.0 | 956 | $1,400 | $1.46 | 44d | 1 | 1.43mi |
| 2330 Kilburn Ave Rockford, IL | 2.0–3.0 | 1.0–2.0 | 950 | $999 | $1.05 | 13d | 1 | 1.46mi |
Listing history 13 events
-
2026-06-13status $65,000 Pending 17 DOM
-
2026-06-10days on market $65,000 Active 17 DOM
-
2026-06-09days on market $65,000 Active 16 DOM
-
2026-06-08days on market $65,000 Active 15 DOM
-
2026-06-07days on market $65,000 Active 14 DOM
-
2026-06-03days on market $65,000 Active 10 DOM
-
2026-06-02days on market $65,000 Active 9 DOM
-
2026-06-01days on market $65,000 Active 8 DOM
-
2026-05-31days on market $65,000 Active 7 DOM
-
2026-05-30days on market $65,000 Active 6 DOM
-
2026-05-24$65,000 Active
-
1997-07-21soldstatus $17,000
-
1992-11-16soldstatus $10,500
ⓘ Source: listings_history table (triggers on properties + properties_extension) + one-shot
backfill from property_details.listing_events for pre-trigger history.
Tax reassessment forecast IL · Partial reset (capped growth)
- Current annual tax
- $576 · $48/mo
- Projected year-2 tax
- $1,026 · $85/mo
- Expected delta
- +$450/yr (+$37/mo · 78.0%)
ⓘ Screening estimate from a state-policy table — verify with the county assessor before closing.
Climate risk First Street
- Flood 1/10 Low FEMA zone X (unshaded) · 0% chance over 30 yrs
- Wildfire 1/10 Low
- Heat 2/10 Low 7 d/yr ≥102°F today · 15 d/yr by 30 yrs out
- Wind 2/10 Low
- Air quality 2/10 Low 1 unhealthy d/yr today · 2 by 30 yrs out
Nearby sold comps map
Loading sold comps map…
Walkable amenities ~0.75 mi
Loading nearby amenities…
Taxation est. · year 1
- Rental income
- $13,934
- − Mortgage interest
- −$3,641
- − Property taxes
- −$576
- − Insurance
- −$325
- − Repairs & maintenance
- −$1,115
- − Management
- −$1,115
- − Depreciation
- −$1,891
- Taxable income
- $5,271
- Est. tax owed @ 24.0%
- −$1,265
- After-tax cash flow
- $4,751/yr
For passive investors: Depreciation is non-cash, so a rental often shows a tax loss while cash-flowing — sheltering income. Rental losses are passive: they offset passive income freely, and up to $25,000/yr can offset ordinary (W-2) income if you actively participate and your MAGI is under $100k (phasing out to $0 by $150k); unused losses carry forward. On sale, claimed depreciation is recaptured at up to 25%, and gains may owe capital-gains tax (a 1031 exchange can defer both). Figures are a year-1 estimate at your 24.0% rate — not tax advice; consult a CPA.
Schools (NCES district)
- District
- Rockford SD 205
- NCES district ID
- 1734510
- Math proficiency
- 12% ▼ -2.00%
- Reading proficiency
- 16% ▼ -3.00%
- Median HH income
- $42,533
- Composite
- 12.21/100
- National rank
- #9649
- State rank
- #533 of 620 in IL
Livability — Rockford
- Score
- 62/100
- State rank
- #876
- US rank
- #17035
Category grades
Schools grade is shown separately in the Schools card above.
Census & demographics
- Census place
- Rockford, IL
- County
- Winnebago County · 147,297 people
- City population
- 147,297
- Metro
- Rockford, IL
- Population (ZIP)
- 19,318
- Household income
- $46,163
- Rent vs Own
- Severe rent burden
- 1170.0
Population outlook (Winnebago County) Hauer SSP2
- Today (2025)
- 271,080 people
- By 2030
- 260,684 · -3.8%
- By 2040
- 238,405 · -12.1%
- By 2050
- 216,129 · -20.3%
- By 2075
- 172,882 · -36.2%
- By 2100
- 135,336 · -50.1%
Race, ethnicity, and origin ACS 2023
- Neighborhood character
- Diverse neighborhood (Simpson 0.66)
- Race & ethnicity
- White 44% Black 34% Hispanic / Latino 16% Two or more races 8% Asian 1%
- Hispanic origin (detail)
- Mexican 14% Puerto Rican 1%
- Common ancestry
- Romanian 3% Italian 2% Portuguese 2%
- Foreign-born
- 9% · Canada
- Languages at home
- 84% English-only · Spanish 13% Other Indo-European 1% Russian/Polish/Slavic 1%
Political lean MEDSL · Winnebago
- 2024 margin
- Toss-up / Even · D 49.5% · R 49.0% · Other 1.5%
- 2008→2024 swing
- -12.2pp toward R · 2008: 12.8pp · 2024: 0.6pp
- All cycles
- 2024: D+0.6 2020: D+2.5 2016: R+1.2 2012: D+5.7 2008: D+12.8
Not yet ingested
- Civics
- —
Market trends
- HPI YoY
- ▼ -69.58%
- Current HPI
- 204.8946
- Rent YoY
- —
- Metro
- Rockford, IL
- State GDP YoY
- ▲ 1.59%
- F500 in state
- 60
Industry mix (Fortune 500 HQ in IL)
| Industry | F500 HQs | Revenue |
|---|---|---|
| Insurance | 4 | $201B |
|
||
| Consumer Goods | 4 | $87B |
|
||
| Industrial Machinery | 3 | $64B |
|
||
| Healthcare | 2 | $55B |
|
||
| Retail / Pharmacy | 1 | $148B |
|
||
| Agriculture / Food | 1 | $86B |
|
||
Price history
+519.0% since first listed3 events — show timeline
- 2026-05-24 Listed $65,000 NWIAR
- 1997-07-21 Sold (Public Records) $17,000 Public Records
- 1992-11-16 Sold (Public Records) $10,500 Public Records
Property tax history
+0.7%/yrLatest (2024): $576 · +3.5% YoY. Source: county tax records.
Cash-flow waterfall
monthlySold comps — $/sqft
last 12 mo · ≤1 miLoading sold comps…