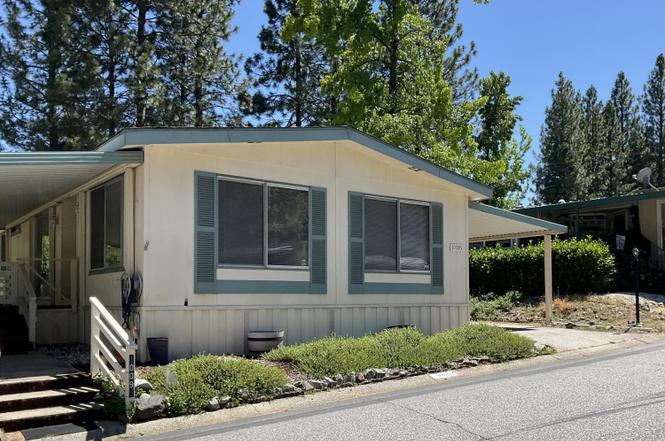
10095 Grinding Rock Dr · Alta Sierra, CA
Flood risk 1/10 · Minimal
- FEMA flood zone
- X (unshaded)
- Chance of flooding over 30 yrs
- 0.0%
- Est. flood insurance / yr
- $507 – $1,088
Fire risk 9/10 · Severe
- Est. fire insurance / yr
- $659 – $1,223
Heat risk 5/10 · Moderate
- Hot days now (above 96°F)
- 7 days/yr
- Hot days in 30 yrs
- 16 days/yr
Wind risk 1/10 · Minimal
- Chance of severe wind over 30 yrs
- —
Air-quality risk 10/10 · Severe
- Unhealthy air days now
- 33 days/yr
- Unhealthy air days in 30 yrs
- 40 days/yr
Risk factors via First Street. Map © Google.
Why this score? — see what drove the B+ grade
The composite is a weighted blend of 9 inputs, each scored 0–100. Each bar is that input's sub-score; the figure is the points it added to the 100-point composite (weight × sub-score).
- Cash flow +30.0/30.0
- ARV discount +15.0/15.0
- 1% rule +10.0/10.0
- DSCR +10.0/10.0
- Schools +3.8/10.0
- Livability +3.0/5.0
- Rent growth +2.5/5.0
- Condition / age +2.5/5.0
- Appreciation +0.0/10.0
$62,000
🖨 Deal sheet 📄 Offer letter ✓ Due diligence
Listing remarks
Forest Springs 55+ Living at Its Best - Comfort, Convenience & Community! Welcome to this cozy and move-in ready 2-bedroom, 2-bath home located in the highly desirable Forest Springs Manufactured Home Community, nestled in the scenic foothills of Nevada County. Thoughtfully designed with multiple living spaces including a welcoming living room, formal dining area, and spacious family room, this home offers the flexibility to relax or entertain with ease. Step outside to the oversized front deckperfect for morning coffee or visiting with friends and neighbors. The generous 14' x 10' kitchen is a true highlight, featuring abundant extra storage cabinets, built-in oven, gas cooktop, dis
Key facts
- Oversized front deck
- Generous kitchen
- Storage shed
Tags
Property features AI
Finance
- Financial info: Land lease amount: $1,133
- HOA & community: No homeowners association; Land lease in effect
Exterior
- Parking: Off-street parking; Attached covered parking; Guest parking available
- Utilities: Public water; Private sewer; Propane; Individual electric meter; Individual gas meter; Cable available and connected; Generator (electric)
- Home design: Manufactured in-park home; Double wide / dual wide; Single-story (manufactured); Located in a senior community; Address: 10095 Grinding Rock Dr, Grass Valley, CA 95949
- Construction: Metal skirting; Composition roof; Built in 1977
- Exterior features: Backyard; Covered deck and porch; Patio awning; Carport awning; Storage area / shed
Interior
- Kitchen: Built-in gas oven; Gas cook top; Hood over range; Dishwasher; Disposal; Microwave; Laminate counter
- Bedrooms: 2 bedrooms (including master bedroom)
- Flooring: Carpet; Laminate; Vinyl
- Bathrooms: 2 full bathrooms with double sinks, tub, and shower stall(s)
- Heating & cooling: Central heating (propane); Central air conditioning; Ceiling fans
- Interior features: Deck attached to living and family rooms; Covered deck and porch; Patio awning and carport awning; Storage area / shed
- Laundry & utility: Washer and dryer included; Indoor laundry room/inside area
Neighborhood map
What this means for you Summary
Snapshot
- This is a 2-bed/2.0-bath manufactured listed at $62k.
Deal economics
- At list price, monthly cash flow is $1k ($15k/yr) — positive.
- The deal already cash-flows at list — no discount required.
- Meets the 1% rule at list price ($2k rent vs $62k).
- Recommended offer: $56k (9.0% below list) — sets the bar for market timing.
- Cap rate 31.3% vs local median 3.4% in Alta Sierra — top-decile yield for the area; either an underpriced asset or a hidden risk that comps aren't pricing in. Stress-test before assuming the spread holds.
Location & tenants
- Location reads 59/100 on livability (#662 in CA) — a working-class tenant base; expect higher turnover. Strengths: employment A+, housing A+; Watch: crime C-, schools D+, amenities F.
- Nevada Joint Union High (town): math 25% / reading 61% proficiency, ranked #201 of 517 in CA (top 39%) — families likely to look elsewhere, expect single-tenant / working-renter base with shorter leases.
- Market conditions: 252 active listings in the ZIP; 1 comparable units currently listed for rent nearby; solid renter incomes; 215 units permitted in Nevada County in 2024 (0 in 5+ unit buildings).
Forward outlook
- Local home prices are declining (-3.0%/yr); year-one equity from $429 of loan paydown is wiped out by about $2k of value loss. Plan a longer hold.
- Nevada County population projected at -14% by 2050 — secular population decline; favor cash flow + early exit over multi-decade hold.
- At projected returns (-3.0% appreciation + 3.0% rent growth), your $17k cash investment doubles in ~2 years — after that, you're playing with house money.
Negotiation context
- It's been on market 106 days — a 9% lower offer ($56k) is reasonable based on typical stale-listing flexibility.
Risks & watch-outs
- Climate carrying-cost: severe wildfire risk; extreme-heat days projected 7→16/yr by 2055 (HVAC capex compounding) — expect insurance premiums to compound above CPI over the hold.
Questions for the listing agent
- It's been on market 106 days. Have you received any prior offers? Is the seller open to a 9% concession, seller financing, or rate buy-down credit?
- Built in 1977 — when were the roof, HVAC, electrical panel, plumbing, and water heater last replaced?
- Why hasn't it sold? Are there any deal-killer items the seller is aware of (foundation, flood, title, zoning, code violations)?
- Is there a deadline driving the sale (1031 exchange, divorce, estate, relocation)? That informs how much negotiation room exists.
- Schools are D-rated, which usually means shorter tenancies and higher turnover. Who's the typical renter profile here, and what's been the actual vacancy rate?
- What's the average days-on-market for RENTAL listings here right now (not sales)? A rising rental-DOM trend means longer vacancies and softer asking-rent achievability than the comps imply.
- What's the recent tenant-quality profile in this submarket — average credit score on applications, eviction rate, late-payment / NSF rate, and stable-employment percentage? A property-management company in the area should have these aggregated.
- How much new for-sale + rental construction is in the pipeline within 1–3 miles? Heavy new supply typically softens prices + rents 12–24 months out; constrained supply supports both.
Investment metrics
- 1% rule
- 3.51% ✓
- Cap rate
- 31.26%
- Cash-on-cash
- 89.18%
- DSCR
- 4.97
- GRM
- 2.4
CMA / ARV
- ARV (on-the-fly)
- $109,200
- Comps found
- 12
Show comp detail 12 sales within ~0.75 mi
| Address | Dist | Beds/Ba | Sqft | Sold | Price | $/sf | Match |
|---|---|---|---|---|---|---|---|
| 10096 Daisy King Dr | 0.22mi | 2/2.0 | 1,200 (0%) | 7mo | $27,500 | $23 | 84 |
| 14338 State Highway 49 #65 | 0.40mi | 2/2.0 | 1,200 (0%) | 6mo | $75,000 | $63 | 76 |
| 10150 Stone Arch Dr | 0.12mi | 2/2.0 | 1,344 (+12%) | 1mo | $55,000 | $41 | 74 |
| 14821 Hidden Rock Dr #282 | 0.20mi | 2/2.0 | 1,337 (+11%) | 1mo | $89,500 | $67 | 71 |
| 10070 Dalewood Way | 0.59mi | 2/2.0 | 1,152 (-4%) | 4mo | $130,000 | $113 | 62 |
| 10088 Heritage Oak Dr | 0.35mi | 3/2.0 (+1) | 1,280 (+7%) | 9mo | $219,000 | $171 | 60 |
| 14338 State Highway 49 #67 | 0.37mi | 2/1.0 | 1,062 (-12%) | 2mo | $54,900 | $52 | 58 |
| 13948 Golden Star Rd | 0.54mi | 3/2.0 (+1) | 1,110 (-8%) | 8mo | $139,900 | $126 | 51 |
| 10043 Lode Line Way | 0.67mi | 3/2.0 (+1) | 1,248 (+4%) | 8mo | $179,000 | $143 | 50 |
| 13927 Meda Dr | 0.60mi | 3/2.0 (+1) | 1,368 (+14%) | 1mo | $140,000 | $102 | 43 |
| 13894 Golden Star Rd | 0.63mi | 3/2.0 (+1) | 1,056 (-12%) | 6mo | $44,000 | $42 | 41 |
| 10064 Lode Line Way #30 | 0.69mi | 3/2.0 (+1) | 1,314 (+10%) | 9mo | $120,000 | $91 | 39 |
Match score weights: distance 35% · size 25% · config 20% · recency 20%. Top-matched comps best support the ARV.
Projected returns pro-forma
-3.0% appreciation · 3.0% rent growth · sell at horizon
- IRR
- 89.8%
- Equity multiple
- 5.16×
- Total profit
- $72,159
- Equity at exit
- $9,244
- IRR
- 92.8%
- Equity multiple
- 10.72×
- Total profit
- $168,778
- Equity at exit
- $5,361
Cash invested: $17,360 (down + closing). Projections, not guarantees.
Landlord ↔ Tenant lean methodology
- Overall (STATE)
- 18 Strongly Tenant-Friendly
- State California
- 18 Strongly Tenant-Friendly · D+13
- County
- — inherits STATE
- City
- — inherits STATE
ZIP-level market 95949
- Home prices YoY
- -34.7%
- Active inventory
- 252
- Price-to-rent
- 2.4×
Monthly cashflow live
- Estimated rent
- $2,176 medium interval (Pro) →
- Mortgage (P&I)
- −$325
- Tax est. 1.5%
- −$78 /mo · $930/yr
- Insurance
- −$26
- HOA
- −$0
- Vacancy / Maint / Mgmt
- −$457
- Net cashflow
- $1,290
Break-even live
UW: 25.0% down · 7.5% · 30yr · 1.5% tax · 5.0% vac · 8.0% maint · 8.0% mgmt
Financing live
Cash to close
- Down payment
- $15,500
- Closing costs
- $1,860
- Reserves months
- —
- Total cash needed
- —
Loan-product check · same deal, 3 products live
Conventional
25% down · 7.5% · 30yr
- Down + closing
- —
- Monthly P&I
- —
- Monthly cashflow
- —
- DSCR
- —
- Eligible?
- —
Personal DTI + credit; lowest rate.
DSCR
20% down · 8.5% · 30yr
- Down + closing
- —
- Monthly P&I
- —
- Monthly cashflow
- —
- DSCR
- —
- Eligible?
- —
No personal income docs; deal must DSCR.
Hard money
10% down · 12.0% · 12mo
- Down + closing
- —
- Monthly P&I
- —
- Monthly cashflow
- —
- DSCR
- —
- Eligible?
- —
Short-term bridge; refi at stabilization.
Rent comps 1 comps
| Address | Beds | Baths | Sqft | Rent | $/sqft | DOM | Units | Dist |
|---|---|---|---|---|---|---|---|---|
| 15487 Kingsbury Cir Grass Valley, CA | 2.0 | 2.0 | 1200 | $2,000 | $1.67 | 3d | 1 | 1.31mi |
Listing history 16 events
-
2026-06-19days on market $62,000 Active 106 DOM
-
2026-06-18days on market $62,000 Active 105 DOM
-
2026-06-17days on market $62,000 Active 104 DOM
-
2026-06-16days on market $62,000 Active 103 DOM
-
2026-06-15days on market $62,000 Active 102 DOM
-
2026-06-13days on market $62,000 Active 100 DOM
-
2026-06-13days on market $62,000 Active 99 DOM
-
2026-06-10days on market $62,000 Active 97 DOM
-
2026-06-09days on market $62,000 Active 96 DOM
-
2026-06-08days on market $62,000 Active 95 DOM
-
2026-06-07days on market $62,000 Active 94 DOM
-
2026-06-05days on market $62,000 Active 91 DOM
-
2026-06-03days on market $62,000 Active 90 DOM
-
2026-06-02days on market $62,000 Active 89 DOM
-
2026-06-01days on market $62,000 Active 88 DOM
-
2026-05-31days on market $62,000 Active 87 DOM
ⓘ Source: listings_history table (triggers on properties + properties_extension) + one-shot
backfill from property_details.listing_events for pre-trigger history.
Climate risk First Street
- Flood 1/10 Low FEMA zone X (unshaded) · 0% chance over 30 yrs
- Wildfire 9/10 Extreme
- Heat 5/10 Major 7 d/yr ≥96°F today · 16 d/yr by 30 yrs out
- Wind 1/10 Low
- Air quality 10/10 Extreme 33 unhealthy d/yr today · 40 by 30 yrs out
Nearby sold comps map
Loading sold comps map…
Walkable amenities ~0.75 mi
Loading nearby amenities…
Taxation est. · year 1
- Rental income
- $26,106
- − Mortgage interest
- −$3,473
- − Property taxes
- −$930
- − Insurance
- −$310
- − Repairs & maintenance
- −$2,088
- − Management
- −$2,088
- − Depreciation
- −$1,804
- Taxable income
- $15,413
- Est. tax owed @ 24.0%
- −$3,699
- After-tax cash flow
- $11,783/yr
For passive investors: Depreciation is non-cash, so a rental often shows a tax loss while cash-flowing — sheltering income. Rental losses are passive: they offset passive income freely, and up to $25,000/yr can offset ordinary (W-2) income if you actively participate and your MAGI is under $100k (phasing out to $0 by $150k); unused losses carry forward. On sale, claimed depreciation is recaptured at up to 25%, and gains may owe capital-gains tax (a 1031 exchange can defer both). Figures are a year-1 estimate at your 24.0% rate — not tax advice; consult a CPA.
Schools (NCES district)
- District
- Nevada Joint Union High
- NCES district ID
- 0626880
- Math proficiency
- 25% ▼ -14.00%
- Reading proficiency
- 61% ▼ -7.00%
- Median HH income
- $57,336
- Composite
- 37.53/100
- National rank
- #4393
- State rank
- #201 of 517 in CA
Livability — Alta Sierra
- Score
- 59/100
- State rank
- #662
- US rank
- #20497
Category grades
Schools grade is shown separately in the Schools card above.
Census & demographics
- County
- Nevada County · 85,339 people
- Metro
- Truckee-Grass Valley, CA
- Population (ZIP)
- 20,552
- Household income
- $98,181
- Rent vs Own
- Severe rent burden
- 181.0
Population outlook (Nevada County) Hauer SSP2
- Today (2025)
- 98,490 people
- By 2030
- 97,295 · -1.2%
- By 2040
- 92,041 · -6.5%
- By 2050
- 85,164 · -13.5%
- By 2075
- 68,436 · -30.5%
- By 2100
- 49,536 · -49.7%
Race, ethnicity, and origin ACS 2023
- Neighborhood character
- Predominantly White (84%)
- Race & ethnicity
- White 84% Hispanic / Latino 8% Two or more races 8% Native American 1%
- Hispanic origin (detail)
- Mexican 6%
- Common ancestry
- Lithuanian 4% Italian 4% Slovak 2%
- Foreign-born
- 4% · Canada
- Languages at home
- 94% English-only · Spanish 3% Other Indo-European 1%
Political lean MEDSL · Nevada
- 2024 margin
- D (+12.2) · D 54.4% · R 42.1% · Other 3.5%
- 2008→2024 swing
- +6.9pp toward D · 2008: 5.3pp · 2024: 12.2pp
- All cycles
- 2024: D+12.2 2020: D+14.8 2016: D+4.5 2012: R+4.7 2008: D+5.3
Not yet ingested
- Civics
- —
Market trends
- HPI YoY
- ▼ -122.41%
- Current HPI
- 230.2373
- Rent YoY
- —
- Metro
- Truckee-Grass Valley, CA
- State GDP YoY
- ▲ 3.21%
- F500 in state
- 116
Industry mix (Fortune 500 HQ in CA)
| Industry | F500 HQs | Revenue |
|---|---|---|
| Technology | 27 | $1,492B |
|
||
| Financial Services | 3 | $174B |
|
||
| Retail | 3 | $44B |
|
||
| Insurance | 3 | $26B |
|
||
| Media / Entertainment | 2 | $115B |
|
||
| Pharmaceuticals / Biotech | 2 | $62B |
|
||
Property tax history
-45.2%/yrLatest (2020): $52 · -45.2% YoY. Source: county tax records.
Cash-flow waterfall
monthlySold comps — $/sqft
last 12 mo · ≤1 miLoading sold comps…