 5-Plex
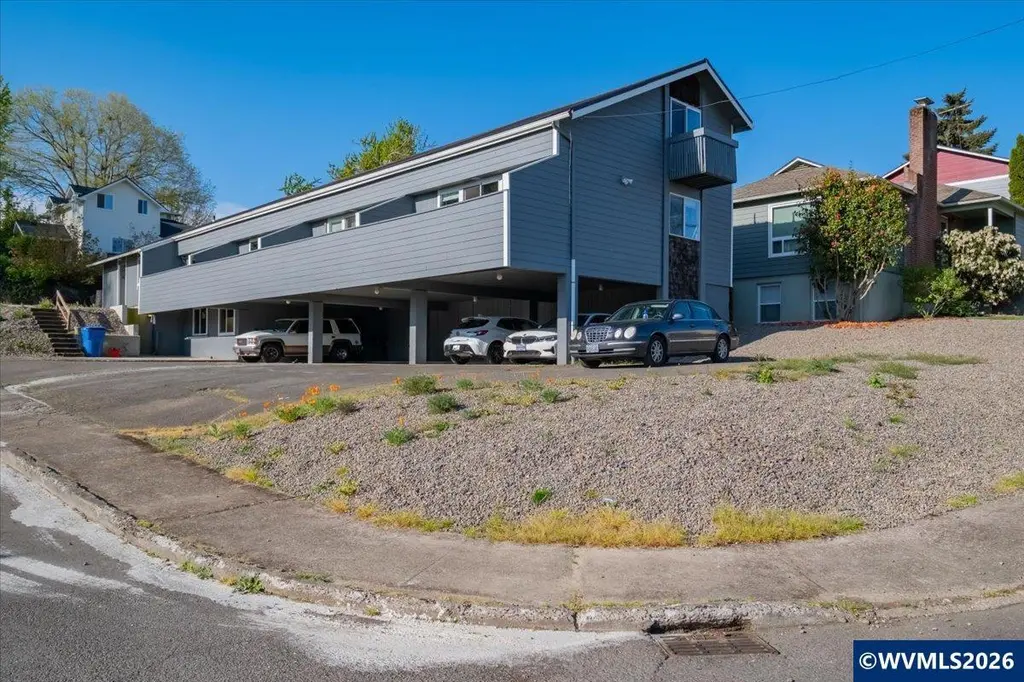
2005 Summer (-2045) St SE · Salem, OR
Flood risk 1/10 · Minimal
- FEMA flood zone
- X (unshaded)
- Chance of flooding over 30 yrs
- 0.0%
- Est. flood insurance / yr
- $507 – $1,088
Fire risk 3/10 · Minor
- Est. fire insurance / yr
- $498 – $926
Heat risk 3/10 · Minor
- Hot days now (above 92°F)
- 7 days/yr
- Hot days in 30 yrs
- 14 days/yr
Wind risk 1/10 · Minimal
- Chance of severe wind over 30 yrs
- —
Air-quality risk 9/10 · Severe
- Unhealthy air days now
- 12 days/yr
- Unhealthy air days in 30 yrs
- 13 days/yr
Risk factors via First Street. Map © Google.
Why this score? — see what drove the D grade
The composite is a weighted blend of 9 inputs, each scored 0–100. Each bar is that input's sub-score; the figure is the points it added to the 100-point composite (weight × sub-score).
- Cash flow +19.9/30.0
- DSCR +6.3/10.0
- 1% rule +4.2/10.0
- Livability +4.0/5.0
- Schools +3.7/10.0
- Rent growth +3.0/5.0
- Condition / age +2.5/5.0
- ARV discount +0.0/15.0
- Appreciation +0.0/10.0
$1,100,000
🖨 Deal sheet 📄 Offer letter ✓ Due diligence
Multi-family units
County records classify this as Multi-Family (5+ Unit). Listing-text estimate: 5 units. confirmed
5+ unit building — per-unit beds/baths from public records are typically unavailable; the breakdown below (if shown) is an estimate from the listing text.
Listing remarks MLS
Remodeled and renovated 5 plex in SE Salem, 6th unit (1 bed/1 bath) is almost finished, projected at $1300 rent. The other 5 units are all all leased. Very affordable taxes and upkeep. Parking is carport and driveway.
Key facts
- Remodeled
- Renovated
- Driveway
Tags
Neighborhood map
What this means for you Summary
Snapshot
- This is a 5 × 8-bed/?-bath units multifamily listed at $1.10M.
Deal economics
- At list price, monthly cash flow is $1k ($16k/yr) — positive. Per door: $265/mo.
- The deal already cash-flows at list — no discount required.
- To meet the 1% rule (rent ≥ 1% of price), the offer needs to be $1.02M (7.6% below list).
- Recommended offer: $1.02M (7.6% below list) — sets the bar for 1% rule.
- Cap rate 7.7% vs local median 2.9% in Salem — top-decile yield for the area; either an underpriced asset or a hidden risk that comps aren't pricing in. Stress-test before assuming the spread holds.
Location & tenants
- Location reads 79/100 on livability (#59 in OR, #2,084 nationally) — a middle-class / working-renter tenant base. Strengths: amenities A+, commute A+, housing A+; Watch: schools D, crime F.
- Salem-Keizer SD 24J (urban): math 34% / reading 47% proficiency, ranked #103 of 183 in OR (top 56%) — families likely to look elsewhere, expect single-tenant / working-renter base with shorter leases.
- Market conditions: Rents rising (+1.8%/yr); 242 active listings in the ZIP; solid renter incomes; 1,591 units permitted in Marion County in 2024 (716 in 5+ unit buildings).
- At $10,166/mo this rent would consume 142% of the median local household income ($86k/yr) (locally 1754% of renters already pay >50% of income on rent) — very limited rent-growth headroom before tenants either downsize or default.
Forward outlook
- Local home prices are declining (-3.0%/yr); year-one equity from $8k of loan paydown is wiped out by about $33k of value loss. Plan a longer hold.
- Marion County population projected at +17% by 2050 — long-run rental-demand tailwind backs the buy-and-hold thesis.
Negotiation context
- Only 3 days on market — expect competitive offers; lowballing is unlikely to land.
- Current owner paid $705k; list at $1.10M implies a 56% gain — meaningful room to come down on a strong offer.
Questions for the listing agent
- Can we see the unit-by-unit rent roll, current vacancy, and any below-market leases? What's the average tenancy length?
- What capital expenditures (roof, boiler, parking lot, exteriors) have been made in the last 5 years, and what's planned in the next 2?
- Built in 1972 — when were the roof, HVAC, electrical panel, plumbing, and water heater last replaced?
- Is there a deadline driving the sale (1031 exchange, divorce, estate, relocation)? That informs how much negotiation room exists.
- Schools are D-rated, which usually means shorter tenancies and higher turnover. Who's the typical renter profile here, and what's been the actual vacancy rate?
- Crime grade is F in this area — have there been break-ins, vandalism, or insurance claims at this property in the last 3 years? What carrier currently insures it and at what premium?
- The area grade is low — what's the realistic commute time and amenity access for the typical tenant pool here? Any planned neighborhood developments (good or bad) we should know about?
- What's the average days-on-market for RENTAL listings here right now (not sales)? A rising rental-DOM trend means longer vacancies and softer asking-rent achievability than the comps imply.
- What's the recent tenant-quality profile in this submarket — average credit score on applications, eviction rate, late-payment / NSF rate, and stable-employment percentage? A property-management company in the area should have these aggregated.
- How much new apartment / multifamily construction is in the pipeline within 1–3 miles? Heavy new supply (>2% of stock underway) typically softens rents 12–24 months out; light construction supports rent growth.
Investment metrics
- 1% rule
- 0.92% ✗
- Cap rate
- 7.74%
- Cash-on-cash
- 5.16%
- DSCR
- 1.23
- GRM
- 9.0
CMA / ARV
- ARV (median comp)
- $894,742
- List price
- $1,100,000
- Delta
- 22.94%
- Verdict
- OVERPRICED
- Comps
- 3 within 1.0 mi
Projected returns pro-forma
-3.0% appreciation · 1.84% rent growth · sell at horizon
- IRR
- -9.5%
- Equity multiple
- 0.66×
- Total profit
- $-105,999
- Equity at exit
- $164,014
- IRR
- -1.6%
- Equity multiple
- 0.90×
- Total profit
- $-32,290
- Equity at exit
- $95,108
Cash invested: $308,000 (down + closing). Projections, not guarantees.
Landlord ↔ Tenant lean methodology
- Overall (STATE)
- 28 Tenant-Leaning
- State Oregon
- 28 Tenant-Leaning · D+6
- County
- — inherits STATE
- City
- — inherits STATE
ZIP-level market 97302
- Rents YoY
- 1.8%
- Active inventory
- 242
- Price-to-rent
- 45.1×
Monthly cashflow live
- Estimated rent
- $10,166 medium interval (Pro) →
- Mortgage (P&I)
- −$5,769
- Tax from tax record
- −$480 /mo · $5,754/yr
- Insurance
- −$458
- HOA
- −$0
- Vacancy / Maint / Mgmt
- −$2,135
- Net cashflow
- $1,325
Break-even live
5-unit breakdown (identical units grouped — click to expand)
| Units | Beds | Baths | Est. rent |
|---|---|---|---|
| 5× units | 8 | — | $10,165 |
| #1 | 8 | — | $2,033 |
| #2 | 8 | — | $2,033 |
| #3 | 8 | — | $2,033 |
| #4 | 8 | — | $2,033 |
| #5 | 8 | — | $2,033 |
| Total (5 units) | $10,166 | ||
UW: 25.0% down · 7.5% · 30yr · 1.5% tax · 5.0% vac · 8.0% maint · 8.0% mgmt
Financing live
Cash to close
- Down payment
- $275,000
- Closing costs
- $33,000
- Reserves months
- —
- Total cash needed
- —
Loan-product check · same deal, 3 products live
Conventional
25% down · 7.5% · 30yr
- Down + closing
- —
- Monthly P&I
- —
- Monthly cashflow
- —
- DSCR
- —
- Eligible?
- —
Personal DTI + credit; lowest rate.
DSCR
20% down · 8.5% · 30yr
- Down + closing
- —
- Monthly P&I
- —
- Monthly cashflow
- —
- DSCR
- —
- Eligible?
- —
No personal income docs; deal must DSCR.
Hard money
10% down · 12.0% · 12mo
- Down + closing
- —
- Monthly P&I
- —
- Monthly cashflow
- —
- DSCR
- —
- Eligible?
- —
Short-term bridge; refi at stabilization.
Listing history 18 events
-
2026-06-18days on market $1,100,000 Active 3 DOM
-
2026-06-17days on market $1,100,000 Active 2 DOM
-
2026-06-15days on market $1,100,000 Active 1 DOM
-
2026-06-15days on market $1,100,000 Active 47 DOM
-
2026-06-14days on market $1,100,000 Active 45 DOM
-
2026-06-10days on market $1,100,000 Active 42 DOM
-
2026-06-09days on market $1,100,000 Active 41 DOM
-
2026-06-08days on market $1,100,000 Active 40 DOM
-
2026-06-07days on market $1,100,000 Active 39 DOM
-
2026-06-03days on market $1,100,000 Active 35 DOM
-
2026-06-02days on market $1,100,000 Active 34 DOM
-
2026-06-01days on market $1,100,000 Active 33 DOM
-
2026-05-31days on market $1,100,000 Active 32 DOM
-
2026-05-30days on market $1,100,000 Active 31 DOM
-
2026-04-29$1,100,000 Active 217-char remark
Show marketing remark (217 chars)
Remodeled and renovated 5 plex in SE Salem, 6th unit (1 bed/1 bath) is almost finished, projected at $1300 rent. The other 5 units are all all leased. Very affordable taxes and upkeep. Parking is carport and driveway.
-
2023-10-25soldstatus $705,000
-
2008-02-22soldstatus $125,500
-
1993-08-04soldstatus $125,550
ⓘ Source: listings_history table (triggers on properties + properties_extension) + one-shot
backfill from property_details.listing_events for pre-trigger history.
Tax reassessment forecast OR · Resets to sale price
- Current annual tax
- $5,754 · $480/mo
- Projected year-2 tax
- $10,670 · $889/mo
- Expected delta
- +$4,916/yr (+$410/mo · 85.4%)
ⓘ Screening estimate from a state-policy table — verify with the county assessor before closing.
Climate risk First Street
- Flood 1/10 Low FEMA zone X (unshaded) · 0% chance over 30 yrs
- Wildfire 3/10 Moderate
- Heat 3/10 Moderate 7 d/yr ≥92°F today · 14 d/yr by 30 yrs out
- Wind 1/10 Low
- Air quality 9/10 Extreme 12 unhealthy d/yr today · 13 by 30 yrs out
Nearby sold comps map
Loading sold comps map…
Walkable amenities ~0.75 mi
Loading nearby amenities…
Taxation est. · year 1
- Rental income
- $121,992
- − Mortgage interest
- −$61,617
- − Property taxes
- −$5,754
- − Insurance
- −$5,500
- − Repairs & maintenance
- −$9,759
- − Management
- −$9,759
- − Depreciation
- −$32,000
- Taxable loss
- −$2,398
- Est. tax savings @ 24.0%
- +$576
- After-tax cash flow
- $16,473/yr
For passive investors: Depreciation is non-cash, so a rental often shows a tax loss while cash-flowing — sheltering income. Rental losses are passive: they offset passive income freely, and up to $25,000/yr can offset ordinary (W-2) income if you actively participate and your MAGI is under $100k (phasing out to $0 by $150k); unused losses carry forward. On sale, claimed depreciation is recaptured at up to 25%, and gains may owe capital-gains tax (a 1031 exchange can defer both). Figures are a year-1 estimate at your 24.0% rate — not tax advice; consult a CPA.
Schools (NCES district)
- District
- Salem-Keizer SD 24J
- NCES district ID
- 4110820
- Math proficiency
- 34% ▼ -1.00%
- Reading proficiency
- 47% ▼ -2.00%
- Median HH income
- $48,632
- Composite
- 37.16/100
- National rank
- #9017
- State rank
- #103 of 183 in OR
Livability — Salem
- Score
- 79/100
- State rank
- #59
- US rank
- #2084
Category grades
Schools grade is shown separately in the Schools card above.
Census & demographics
- Census place
- Salem, OR
- County
- Marion County · 258,219 people
- City population
- 193,601
- Metro
- Salem, OR
- Population (ZIP)
- 40,799
- Household income
- $85,833
- Rent vs Own
- Severe rent burden
- 1754.0
Population outlook (Marion County) Hauer SSP2
- Today (2025)
- 360,940 people
- By 2030
- 375,178 · +3.9%
- By 2040
- 400,914 · +11.1%
- By 2050
- 422,187 · +17.0%
- By 2075
- 460,305 · +27.5%
- By 2100
- 464,025 · +28.6%
Race, ethnicity, and origin ACS 2023
- Neighborhood character
- Predominantly White (77%)
- Race & ethnicity
- White 77% Hispanic / Latino 12% Two or more races 10% Black 2% Pacific Islander 1% Asian 1%
- Hispanic origin (detail)
- Mexican 10%
- Common ancestry
- Italian 4% Slovak 4% Portuguese 3%
- Foreign-born
- 6% · Canada, South Korea
- Languages at home
- 90% English-only · Spanish 6% Other Asian/Pacific 1%
Political lean MEDSL · Marion
- 2024 margin
- Toss-up / Even · D 47.5% · R 49.5% · Other 3.0%
- 2008→2024 swing
- -4.2pp toward R · 2008: 2.2pp · 2024: -2.0pp
- All cycles
- 2024: R+2.0 2020: D+1.1 2016: R+5.0 2012: R+3.5 2008: D+2.2
Not yet ingested
- Civics
- —
Market trends
- HPI YoY
- ▼ -382.78%
- Current HPI
- 296.7837
- Rent YoY
- ▲ 1.84%
- Metro
- Salem, OR
- State GDP YoY
- ▲ 2.05%
- F500 in state
- 2
Industry mix (Fortune 500 HQ in OR)
| Industry | F500 HQs | Revenue |
|---|---|---|
| Consumer Goods | 1 | $51B |
|
||
Price history
+776.1% since first listed4 events — show timeline
- 2026-04-29 Listed $1,100,000 WVMLS
- 2023-10-25 Sold (Public Records) $705,000 Public Records
- 2008-02-22 Sold (Public Records) $125,500 Public Records
- 1993-08-04 Sold (Public Records) $125,550 Public Records
Property tax history
+3.4%/yrLatest (2025): $5,754 · +7.8% YoY. Source: county tax records.
Cash-flow waterfall
monthlySold comps — $/sqft
last 12 mo · ≤1 miLoading sold comps…