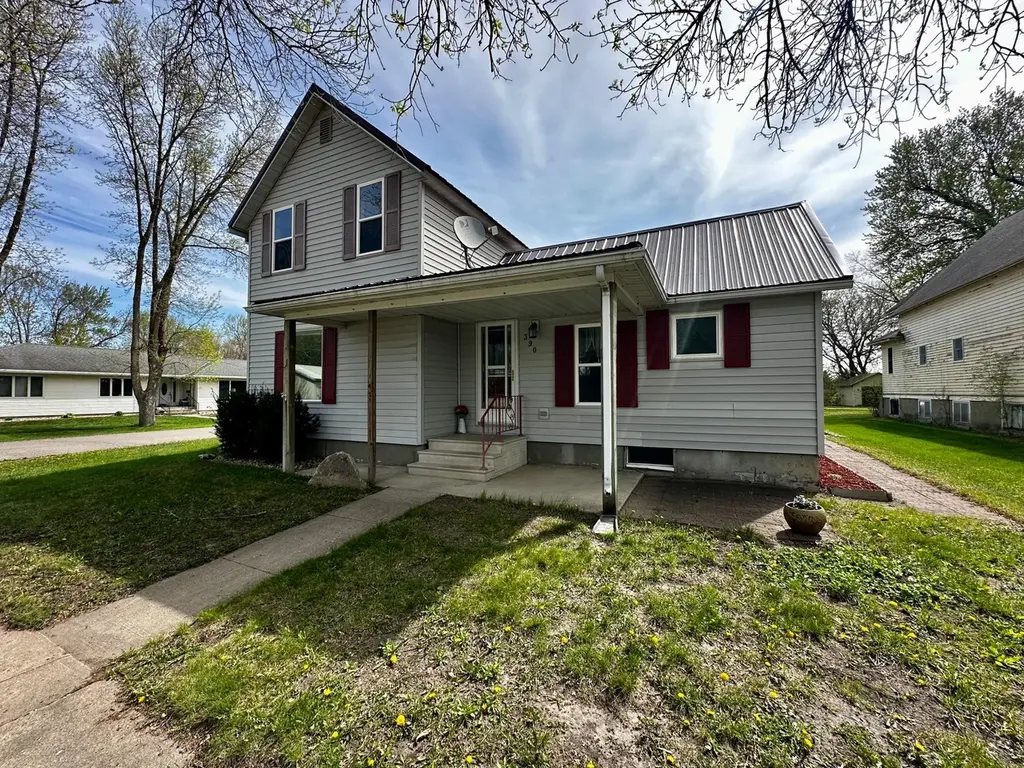
390 N Broadway St · Vesta, MN
Flood risk No data
- FEMA flood zone
- —
- Chance of flooding over 30 yrs
- —
- Est. flood insurance / yr
- —
Fire risk No data
- Est. fire insurance / yr
- —
Heat risk No data
- Hot days now (above threshold)
- —
- Hot days in 30 yrs
- —
Wind risk No data
- Chance of severe wind over 30 yrs
- —
Air-quality risk No data
- Unhealthy air days now
- —
- Unhealthy air days in 30 yrs
- —
Risk factors via First Street. Map © Google.
Why this score? — see what drove the C- grade
The composite is a weighted blend of 9 inputs, each scored 0–100. Each bar is that input's sub-score; the figure is the points it added to the 100-point composite (weight × sub-score).
- Cash flow +14.9/30.0
- ARV discount +9.2/15.0
- Appreciation +8.5/10.0
- DSCR +4.5/10.0
- Schools +4.2/10.0
- 1% rule +3.2/10.0
- Livability +3.2/5.0
- Rent growth +2.5/5.0
- Condition / age +2.5/5.0
$129,900
🖨 Deal sheet 📄 Offer letter ✓ Due diligence
Listing remarks
Welcome home to this inviting and versatile property on a large corner lot! This well-maintained two-bedroom, two-bath home offers a bright, open-concept kitchen that flows into the main living space, ideal for both everyday living and entertaining. Enjoy outdoor living from both the front and back patios, giving you the perfect spots for morning coffee or evening relaxation. There is a detached one-stall garage plus a storage shed in the backyard.
Key facts
- Open-concept kitchen
- Storage shed
- Corner lot
Tags
Property features AI
Exterior
- Parking: Gravel parking; 1-car garage
- Utilities: City water connected; City sewer connected; 200+ amp electric service; Propane fuel
- Home design: Residential property; One and one-half levels; Entry level includes main level and lower level
- Construction: Metal roof; Block foundation
- Exterior features: Vinyl exterior; Patio; Storage shed; Corner lot with medium tree coverage; City street frontage, public maintained road
Interior
- Kitchen: Range; Microwave; Refrigerator; Dishwasher not listed (not included)
- Bedrooms: 2 bedrooms (one located on the upper level, one on the upper level); Bonus room on lower level
- Bathrooms: 2 three-quarter bathrooms
- Heating & cooling: Forced air heat; Central air conditioning
- Interior features: Stainless steel appliances; Eat-in kitchen; Full basement
- Laundry & utility: Washer and dryer; Laundry located in basement
Neighborhood map
What this means for you Summary
Snapshot
- This is a 2-bed/2.0-bath single-family listed at $130k.
Deal economics
- At list price, monthly cash flow is $37 ($449/yr) — positive.
- The deal already cash-flows at list — no discount required.
- To meet the 1% rule (rent ≥ 1% of price), the offer needs to be $106k (18.1% below list).
- Recommended offer: $106k (18.1% below list) — sets the bar for 1% rule.
Location & tenants
- Location reads 64/100 on livability (#608 in MN) — a middle-class / working-renter tenant base. Strengths: cost of living A+, housing A+; Watch: employment C-, crime D+, health & safety D+.
- Wabasso Public School District (rural): math 50% / reading 48% proficiency, ranked #130 of 301 in MN (top 43%) — families likely to look elsewhere, expect single-tenant / working-renter base with shorter leases; only 18% free/reduced lunch — higher-income household profile.
- Market conditions: 5 active listings in the ZIP; 25 units permitted in Redwood County in 2024 (0 in 5+ unit buildings).
Forward outlook
- In year one you build about $10k of equity ($898 loan paydown + $9k appreciation (6.9% local appreciation)).
- Redwood County population projected at -16% by 2050 — secular population decline; favor cash flow + early exit over multi-decade hold.
- At projected returns (6.9% appreciation + 3.0% rent growth), your $36k cash investment doubles in ~4 years — after that, you're playing with house money.
- By year 4, paydown + projected appreciation supports a ~$34k cash-out refi (75% LTV) — recoverable capital for the next deal without selling this one.
Negotiation context
- It's been on market 45 days — a 3% lower offer ($126k) is reasonable based on typical stale-listing flexibility.
Risks & watch-outs
- Watch-outs: built in 1903 — expect roof / HVAC / electrical / plumbing capex.
Questions for the listing agent
- It's been on market 45 days. Have you received any prior offers? Is the seller open to a 18% concession, seller financing, or rate buy-down credit?
- Built in 1903 — when were the roof, HVAC, electrical panel, plumbing, and water heater last replaced?
- Is there a deadline driving the sale (1031 exchange, divorce, estate, relocation)? That informs how much negotiation room exists.
- Schools are F-rated, which usually means shorter tenancies and higher turnover. Who's the typical renter profile here, and what's been the actual vacancy rate?
- Crime grade is D in this area — have there been break-ins, vandalism, or insurance claims at this property in the last 3 years? What carrier currently insures it and at what premium?
- What's the average days-on-market for RENTAL listings here right now (not sales)? A rising rental-DOM trend means longer vacancies and softer asking-rent achievability than the comps imply.
- What's the recent tenant-quality profile in this submarket — average credit score on applications, eviction rate, late-payment / NSF rate, and stable-employment percentage? A property-management company in the area should have these aggregated.
- How much new for-sale + rental construction is in the pipeline within 1–3 miles? Heavy new supply typically softens prices + rents 12–24 months out; constrained supply supports both.
Investment metrics
- 1% rule
- 0.82% ✗
- Cap rate
- 6.64%
- Cash-on-cash
- 1.23%
- DSCR
- 1.05
- GRM
- 10.2
CMA / ARV
- ARV (median comp)
- $135,050
- List price
- $129,900
- Delta
- -3.81%
- Verdict
- FAIR
- Comps
- 1 within 2.0 mi
Projected returns pro-forma
6.92% appreciation · 3.0% rent growth · sell at horizon
- IRR
- 18.5%
- Equity multiple
- 2.29×
- Total profit
- $47,074
- Equity at exit
- $89,352
- IRR
- 17.7%
- Equity multiple
- 4.71×
- Total profit
- $135,027
- Equity at exit
- $169,131
Cash invested: $36,372 (down + closing). Projections, not guarantees.
Landlord ↔ Tenant lean methodology
- Overall (STATE)
- 46 Balanced
- State Minnesota
- 46 Balanced · D+2
- County
- — inherits STATE
- City
- — inherits STATE
ZIP-level market 56292
- Home prices YoY
- 4.8%
- Active inventory
- 5
- Price-to-rent
- 10.2×
Monthly cashflow live
- Estimated rent
- $1,064 medium interval (Pro) →
- Mortgage (P&I)
- −$681
- Tax from tax record
- −$68 /mo · $816/yr
- Insurance
- −$54
- HOA
- −$0
- Vacancy / Maint / Mgmt
- −$223
- Net cashflow
- $37
Break-even live
UW: 25.0% down · 7.5% · 30yr · 1.5% tax · 5.0% vac · 8.0% maint · 8.0% mgmt
Financing live
Cash to close
- Down payment
- $32,475
- Closing costs
- $3,897
- Reserves months
- —
- Total cash needed
- —
Loan-product check · same deal, 3 products live
Conventional
25% down · 7.5% · 30yr
- Down + closing
- —
- Monthly P&I
- —
- Monthly cashflow
- —
- DSCR
- —
- Eligible?
- —
Personal DTI + credit; lowest rate.
DSCR
20% down · 8.5% · 30yr
- Down + closing
- —
- Monthly P&I
- —
- Monthly cashflow
- —
- DSCR
- —
- Eligible?
- —
No personal income docs; deal must DSCR.
Hard money
10% down · 12.0% · 12mo
- Down + closing
- —
- Monthly P&I
- —
- Monthly cashflow
- —
- DSCR
- —
- Eligible?
- —
Short-term bridge; refi at stabilization.
Listing history 16 events
-
2026-06-18days on market $129,900 Active 45 DOM
-
2026-06-17days on market $129,900 Active 44 DOM
-
2026-06-16days on market $129,900 Active 43 DOM
-
2026-06-15days on market $129,900 Active 42 DOM
-
2026-06-13days on market $129,900 Active 40 DOM
-
2026-06-12days on market $129,900 Active 39 DOM
-
2026-06-09days on market $129,900 Active 36 DOM
-
2026-06-08days on market $129,900 Active 35 DOM
-
2026-06-07pricedays on market $129,900 Active 34 DOM
-
2026-06-07days on market $135,000 Active 33 DOM
-
2026-06-04days on market $135,000 Active 30 DOM
-
2026-06-02days on market $135,000 Active 29 DOM
-
2026-06-01days on market $135,000 Active 28 DOM
-
2026-05-31days on market $135,000 Active 27 DOM
-
2026-05-31days on market $135,000 Active 26 DOM
-
2026-05-04$135,000 Active 453-char remark
ⓘ Source: listings_history table (triggers on properties + properties_extension) + one-shot
backfill from property_details.listing_events for pre-trigger history.
Tax reassessment forecast MN · Partial reset (capped growth)
- Current annual tax
- $816 · $68/mo
- Projected year-2 tax
- $1,135 · $95/mo
- Expected delta
- +$319/yr (+$27/mo · 39.1%)
ⓘ Screening estimate from a state-policy table — verify with the county assessor before closing.
Nearby sold comps map
Loading sold comps map…
Walkable amenities ~0.75 mi
Loading nearby amenities…
Taxation est. · year 1
- Rental income
- $12,770
- − Mortgage interest
- −$7,276
- − Property taxes
- −$816
- − Insurance
- −$650
- − Repairs & maintenance
- −$1,022
- − Management
- −$1,022
- − Depreciation
- −$3,779
- Taxable loss
- −$1,794
- Est. tax savings @ 24.0%
- +$431
- After-tax cash flow
- $879/yr
For passive investors: Depreciation is non-cash, so a rental often shows a tax loss while cash-flowing — sheltering income. Rental losses are passive: they offset passive income freely, and up to $25,000/yr can offset ordinary (W-2) income if you actively participate and your MAGI is under $100k (phasing out to $0 by $150k); unused losses carry forward. On sale, claimed depreciation is recaptured at up to 25%, and gains may owe capital-gains tax (a 1031 exchange can defer both). Figures are a year-1 estimate at your 24.0% rate — not tax advice; consult a CPA.
Schools (NCES district)
- District
- Wabasso Public School District
- NCES district ID
- 2741430
- Math proficiency
- 50% ▼ -11.00%
- Reading proficiency
- 48% ▼ -8.00%
- Median HH income
- $50,656
- Composite
- 42.03/100
- National rank
- #3331
- State rank
- #130 of 301 in MN
Livability — Vesta
- Score
- 64/100
- State rank
- #608
- US rank
- #14516
Category grades
Schools grade is shown separately in the Schools card above.
Census & demographics
- Census place
- Vesta, MN
- Population (ZIP)
- 582
Population outlook (Redwood County) Hauer SSP2
- Today (2025)
- 14,504 people
- By 2030
- 13,983 · -3.6%
- By 2040
- 13,056 · -10.0%
- By 2050
- 12,225 · -15.7%
- By 2075
- 11,051 · -23.8%
- By 2100
- 9,786 · -32.5%
Race, ethnicity, and origin ACS 2023
- Neighborhood character
- Predominantly White (96%)
- Race & ethnicity
- White 96% Hispanic / Latino 2% Black 1%
- Common ancestry
- Portuguese 5% Iranian 3% Romanian 2%
- Foreign-born
- 2% · Canada
- Languages at home
- 98% English-only · Spanish 1%
Political lean MEDSL · Redwood
- 2024 margin
- Solid R (+43.3) · D 27.7% · R 71.0% · Other 1.2%
- 2008→2024 swing
- -29.8pp toward R · 2008: -13.6pp · 2024: -43.3pp
- All cycles
- 2024: R+43.3 2020: R+41.2 2016: R+43.0 2012: R+20.1 2008: R+13.6
Not yet ingested
- Civics
- —
Market trends
- HPI YoY
- ▲ 6.92%
- Current HPI
- 151.9207
- Rent YoY
- —
- Metro
- —
- State GDP YoY
- ▲ 2.41%
- F500 in state
- 34
Industry mix (Fortune 500 HQ in MN)
| Industry | F500 HQs | Revenue |
|---|---|---|
| Healthcare | 2 | $407B |
|
||
| Retail | 2 | $150B |
|
||
| Consumer Goods | 2 | $32B |
|
||
| Industrial Machinery | 2 | $6B |
|
||
| Agriculture | 1 | $40B |
|
||
| Healthcare / Medical Devices | 1 | $32B |
|
||
Price history
-3.8% since first listed2 events — show timeline
- 2026-06-07 Price Changed $129,900 NORTHSTARMLS as Distributed by MLS Grid
- 2026-05-04 Listed $135,000 NORTHSTARMLS as Distributed by MLS Grid
Property tax history
+5.1%/yrLatest (2025): $816 · +28.7% YoY. Source: county tax records.
Cash-flow waterfall
monthlySold comps — $/sqft
last 12 mo · ≤1 miLoading sold comps…