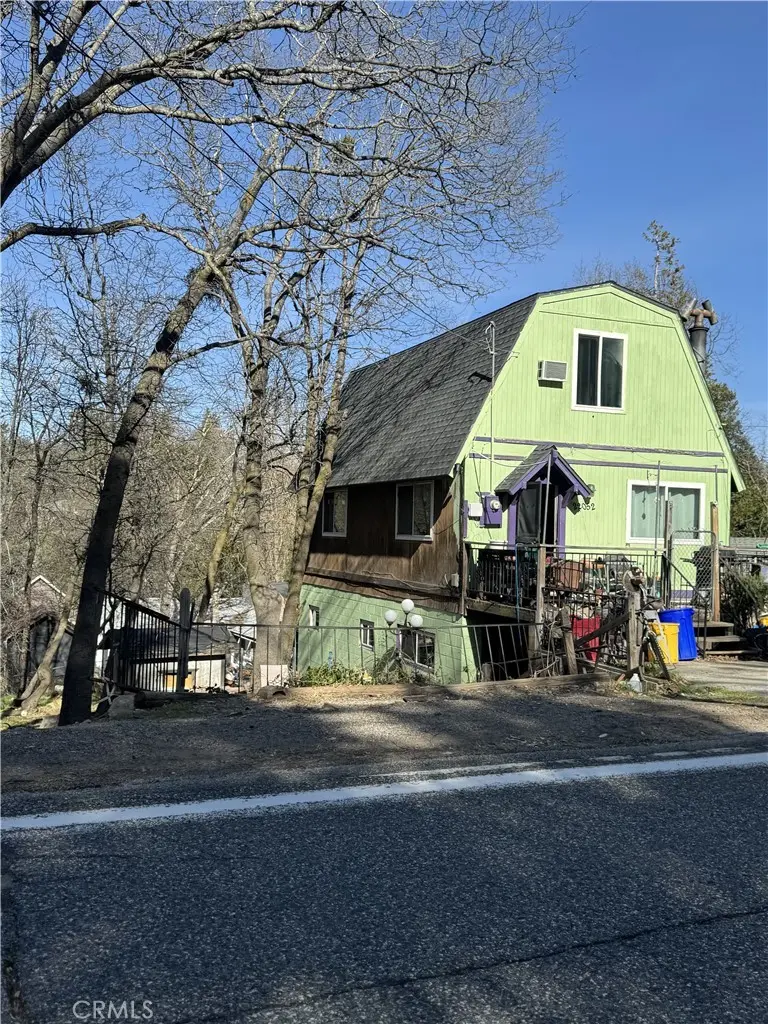
22052 Crest Frst · Crestline, CA
Flood risk 5/10 · Moderate
- FEMA flood zone
- D
- Chance of flooding over 30 yrs
- 0.65%
- Est. flood insurance / yr
- $400 – $4,352
Fire risk 9/10 · Severe
- Est. fire insurance / yr
- $659 – $1,223
Heat risk 3/10 · Minor
- Hot days now (above threshold)
- —
- Hot days in 30 yrs
- —
Wind risk 1/10 · Minimal
- Chance of severe wind over 30 yrs
- —
Air-quality risk 10/10 · Severe
- Unhealthy air days now
- 26 days/yr
- Unhealthy air days in 30 yrs
- 33 days/yr
Risk factors via First Street. Map © Google.
Why this score? — see what drove the C grade
The composite is a weighted blend of 9 inputs, each scored 0–100. Each bar is that input's sub-score; the figure is the points it added to the 100-point composite (weight × sub-score).
- Cash flow +21.2/30.0
- ARV discount +15.0/15.0
- DSCR +6.8/10.0
- 1% rule +5.1/10.0
- Livability +2.8/5.0
- Rent growth +2.5/5.0
- Condition / age +2.5/5.0
- Schools +2.1/10.0
- Appreciation +0.0/10.0
$199,000
🖨 Deal sheet 📄 Offer letter ✓ Due diligence
Key facts
- 2,500 sq ft lot
- Built 1972
- Listed 135 days
Neighborhood map
What this means for you Summary
Snapshot
- This is a 3-bed/1.0-bath single-family listed at $199k.
Deal economics
- At list price, monthly cash flow is $289 ($3k/yr) — positive.
- The deal already cash-flows at list — no discount required.
- Meets the 1% rule at list price ($2k rent vs $199k).
- Recommended offer: $175k (12.0% below list) — sets the bar for market timing.
- Cap rate 8.0% vs local median 3.9% in Crestline — top-decile yield for the area; either an underpriced asset or a hidden risk that comps aren't pricing in. Stress-test before assuming the spread holds.
Location & tenants
- Location reads 56/100 on livability (#805 in CA) — a working-class tenant base; expect higher turnover. Strengths: housing A+; Watch: commute D, schools D-, crime F.
- Rim Of The World Unified (town): math 13% / reading 34% proficiency, ranked #415 of 517 in CA (top 80%) — low school quality limits family demand, transient renter base, plan for 1-2y turnover.
- Market conditions: 80 active listings in the ZIP; 1 comparable units currently listed for rent nearby; 5,458 units permitted in San Bernardino County in 2024 (1,500 in 5+ unit buildings).
Forward outlook
- Local home prices are declining (-3.0%/yr); year-one equity from $1k of loan paydown is wiped out by about $6k of value loss. Plan a longer hold.
- San Bernardino County population projected at +15% by 2050 — modest demand growth; plan on rents tracking national, not racing it.
Negotiation context
- It's been on market 136 days — a 12% lower offer ($175k) is reasonable based on typical stale-listing flexibility.
- Current owner paid $70k; list at $199k implies a 184% gain — meaningful room to come down on a strong offer.
Risks & watch-outs
- Climate carrying-cost: moderate flood risk; severe wildfire risk — expect insurance premiums to compound above CPI over the hold.
Questions for the listing agent
- It's been on market 136 days. Have you received any prior offers? Is the seller open to a 12% concession, seller financing, or rate buy-down credit?
- Built in 1972 — when were the roof, HVAC, electrical panel, plumbing, and water heater last replaced?
- Why hasn't it sold? Are there any deal-killer items the seller is aware of (foundation, flood, title, zoning, code violations)?
- Is there a deadline driving the sale (1031 exchange, divorce, estate, relocation)? That informs how much negotiation room exists.
- Schools are D-rated, which usually means shorter tenancies and higher turnover. Who's the typical renter profile here, and what's been the actual vacancy rate?
- Crime grade is F in this area — have there been break-ins, vandalism, or insurance claims at this property in the last 3 years? What carrier currently insures it and at what premium?
- What's the average days-on-market for RENTAL listings here right now (not sales)? A rising rental-DOM trend means longer vacancies and softer asking-rent achievability than the comps imply.
- What's the recent tenant-quality profile in this submarket — average credit score on applications, eviction rate, late-payment / NSF rate, and stable-employment percentage? A property-management company in the area should have these aggregated.
- How much new for-sale + rental construction is in the pipeline within 1–3 miles? Heavy new supply typically softens prices + rents 12–24 months out; constrained supply supports both.
Investment metrics
- 1% rule
- 1.01% ✓
- Cap rate
- 8.04%
- Cash-on-cash
- 6.22%
- DSCR
- 1.28
- GRM
- 8.3
CMA / ARV
- ARV (median comp)
- $310,975
- List price
- $199,000
- Delta
- -36.01%
- Verdict
- UNDERPRICED
- Comps
- 20 within 1.0 mi
Show comp detail 10 sales within ~0.75 mi
| Address | Dist | Beds/Ba | Sqft | Sold | Price | $/sf | Match |
|---|---|---|---|---|---|---|---|
| 22158 Pine Dr | 0.17mi | 2/1.0 (-1) | 961 (-6%) | 7mo | $249,000 | $259 | 71 |
| 21968 Crest Forest Dr | 0.17mi | 2/1.0 (-1) | 979 (-4%) | 13mo | $270,000 | $276 | 69 |
| 587 Spring Dr | 0.40mi | 2/1.0 (-1) | 1,008 (-2%) | 7mo | $294,000 | $292 | 68 |
| 310 Big Deer Rd | 0.24mi | 3/1.0 | 1,120 (+9%) | 18mo | $270,000 | $241 | 58 |
| 22175 Pine Dr | 0.20mi | 2/1.0 (-1) | 876 (-14%) | 8mo | $256,500 | $293 | 55 |
| 288 Alder Creek Rd | 0.24mi | 3/1.0 | 1,144 (+12%) | 23mo | $389,000 | $340 | 50 |
| 21756 Devils Canyon Rd | 0.55mi | 2/2.0 (-1) | 1,056 (+3%) | 20mo | $375,000 | $355 | 43 |
| 22490 Rockwell Rd | 0.61mi | 2/1.0 (-1) | 930 (-9%) | 10mo | $240,000 | $258 | 43 |
| 22005 Mojave River Rd | 0.70mi | 3/1.0 | 940 (-8%) | 19mo | $310,000 | $330 | 38 |
| 22590 Waters Dr | 0.72mi | 2/1.0 (-1) | 1,106 (+8%) | 18mo | $330,000 | $298 | 33 |
Match score weights: distance 35% · size 25% · config 20% · recency 20%. Top-matched comps best support the ARV.
Projected returns pro-forma
-3.0% appreciation · 3.0% rent growth · sell at horizon
- IRR
- -6.7%
- Equity multiple
- 0.75×
- Total profit
- $-13,868
- Equity at exit
- $29,672
- IRR
- 2.9%
- Equity multiple
- 1.21×
- Total profit
- $11,530
- Equity at exit
- $17,206
Cash invested: $55,720 (down + closing). Projections, not guarantees.
Landlord ↔ Tenant lean methodology
- Overall (STATE)
- 18 Strongly Tenant-Friendly
- State California
- 18 Strongly Tenant-Friendly · D+13
- County
- — inherits STATE
- City
- — inherits STATE
ZIP-level market 92322
- Home prices YoY
- -4.6%
- Active inventory
- 80
- Price-to-rent
- 8.3×
Monthly cashflow live
- Estimated rent
- $2,000 medium interval (Pro) →
- Mortgage (P&I)
- −$1,044
- Tax from tax record
- −$165 /mo · $1,975/yr
- Insurance
- −$83
- HOA
- −$0
- Vacancy / Maint / Mgmt
- −$420
- Net cashflow
- $289
Break-even live
UW: 25.0% down · 7.5% · 30yr · 1.5% tax · 5.0% vac · 8.0% maint · 8.0% mgmt
Financing live
Cash to close
- Down payment
- $49,750
- Closing costs
- $5,970
- Reserves months
- —
- Total cash needed
- —
Loan-product check · same deal, 3 products live
Conventional
25% down · 7.5% · 30yr
- Down + closing
- —
- Monthly P&I
- —
- Monthly cashflow
- —
- DSCR
- —
- Eligible?
- —
Personal DTI + credit; lowest rate.
DSCR
20% down · 8.5% · 30yr
- Down + closing
- —
- Monthly P&I
- —
- Monthly cashflow
- —
- DSCR
- —
- Eligible?
- —
No personal income docs; deal must DSCR.
Hard money
10% down · 12.0% · 12mo
- Down + closing
- —
- Monthly P&I
- —
- Monthly cashflow
- —
- DSCR
- —
- Eligible?
- —
Short-term bridge; refi at stabilization.
Rent comps 1 comps
| Address | Beds | Baths | Sqft | Rent | $/sqft | DOM | Units | Dist |
|---|---|---|---|---|---|---|---|---|
| 22858 Lupin Ln Cedarpines Park, CA | 3.0 | 2.0 | 1176 | $2,000 | $1.70 | 1d | 1 | 0.99mi |
Listing history 18 events
-
2026-06-18days on market $199,000 Active 136 DOM
-
2026-06-17days on market $199,000 Active 135 DOM
-
2026-06-16days on market $199,000 Active 134 DOM
-
2026-06-15days on market $199,000 Active 133 DOM
-
2026-06-13days on market $199,000 Active 131 DOM
-
2026-06-13days on market $199,000 Active 130 DOM
-
2026-06-09days on market $199,000 Active 127 DOM
-
2026-06-08days on market $199,000 Active 126 DOM
-
2026-06-07days on market $199,000 Active 125 DOM
-
2026-06-04days on market $199,000 Active 122 DOM
-
2026-06-03days on market $199,000 Active 121 DOM
-
2026-06-02days on market $199,000 Active 120 DOM
-
2026-06-01days on market $199,000 Active 119 DOM
-
2026-05-31days on market $199,000 Active 118 DOM
-
2026-03-04price $199,000
-
2026-02-02$250,000 Active
-
1993-07-01soldstatus $70,000
-
1990-01-05soldstatus $89,500
ⓘ Source: listings_history table (triggers on properties + properties_extension) + one-shot
backfill from property_details.listing_events for pre-trigger history.
Tax reassessment forecast CA · Resets to sale price
- Current annual tax
- $1,975 · $165/mo
- Projected year-2 tax
- $1,975 · $165/mo
- Expected delta
- $0/yr ($0/mo · 0.0%)
ⓘ Screening estimate from a state-policy table — verify with the county assessor before closing.
Climate risk First Street
- Flood 5/10 Major FEMA zone D · 65% chance over 30 yrs
- Wildfire 9/10 Extreme
- Heat 3/10 Moderate
- Wind 1/10 Low
- Air quality 10/10 Extreme 26 unhealthy d/yr today · 33 by 30 yrs out
Nearby sold comps map
Loading sold comps map…
Walkable amenities ~0.75 mi
Loading nearby amenities…
Taxation est. · year 1
- Rental income
- $24,000
- − Mortgage interest
- −$11,147
- − Property taxes
- −$1,975
- − Insurance
- −$995
- − Repairs & maintenance
- −$1,920
- − Management
- −$1,920
- − Depreciation
- −$5,789
- Taxable income
- $254
- Est. tax owed @ 24.0%
- −$61
- After-tax cash flow
- $3,406/yr
For passive investors: Depreciation is non-cash, so a rental often shows a tax loss while cash-flowing — sheltering income. Rental losses are passive: they offset passive income freely, and up to $25,000/yr can offset ordinary (W-2) income if you actively participate and your MAGI is under $100k (phasing out to $0 by $150k); unused losses carry forward. On sale, claimed depreciation is recaptured at up to 25%, and gains may owe capital-gains tax (a 1031 exchange can defer both). Figures are a year-1 estimate at your 24.0% rate — not tax advice; consult a CPA.
Schools (NCES district)
- District
- Rim Of The World Unified
- NCES district ID
- 0632610
- Math proficiency
- 13% ▼ -10.00%
- Reading proficiency
- 34% ▼ -7.00%
- Median HH income
- $55,860
- Composite
- 21.29/100
- National rank
- #8389
- State rank
- #415 of 517 in CA
Livability — Crestline
- Score
- 56/100
- State rank
- #805
- US rank
- #22821
Category grades
Schools grade is shown separately in the Schools card above.
Census & demographics
- Census place
- Crestline, CA
- City population
- 9,065
- Population (ZIP)
- 605
Population outlook (San Bernardino County) Hauer SSP2
- Today (2025)
- 2,300,329 people
- By 2030
- 2,378,907 · +3.4%
- By 2040
- 2,523,137 · +9.7%
- By 2050
- 2,642,388 · +14.9%
- By 2075
- 2,880,769 · +25.2%
- By 2100
- 2,909,436 · +26.5%
Race, ethnicity, and origin ACS 2023
- Neighborhood character
- Diverse neighborhood (Simpson 0.64)
- Race & ethnicity
- White 54% Two or more races 42% Hispanic / Latino 26% Asian 4%
- Hispanic origin (detail)
- Mexican 26%
- Common ancestry
- Iranian 8%
- Foreign-born
- 5%
- Languages at home
- 96% English-only · Other Asian/Pacific 4%
Political lean MEDSL · San Bernardino
- 2024 margin
- Toss-up / Even · D 47.5% · R 49.7% · Other 2.8%
- 2008→2024 swing
- -8.5pp toward R · 2008: 6.3pp · 2024: -2.1pp
- All cycles
- 2024: R+2.1 2020: D+10.7 2016: D+9.8 2012: D+5.4 2008: D+6.3
Not yet ingested
- Civics
- —
Market trends
- HPI YoY
- ▼ -15.37%
- Current HPI
- 315.7772
- Rent YoY
- —
- Metro
- —
- State GDP YoY
- ▲ 3.21%
- F500 in state
- 116
Industry mix (Fortune 500 HQ in CA)
| Industry | F500 HQs | Revenue |
|---|---|---|
| Technology | 27 | $1,492B |
|
||
| Financial Services | 3 | $174B |
|
||
| Retail | 3 | $44B |
|
||
| Insurance | 3 | $26B |
|
||
| Media / Entertainment | 2 | $115B |
|
||
| Pharmaceuticals / Biotech | 2 | $62B |
|
||
Price history
+122.3% since first listed4 events — show timeline
- 2026-03-04 Price Changed $199,000 CRMLS
- 2026-02-02 Listed $250,000 CRMLS
- 1993-07-01 Sold (Public Records) $70,000 Public Records
- 1990-01-05 Sold (Public Records) $89,500 Public Records
Property tax history
+3.4%/yrLatest (2025): $1,975 · +20.9% YoY. Source: county tax records.
Cash-flow waterfall
monthlySold comps — $/sqft
last 12 mo · ≤1 miLoading sold comps…