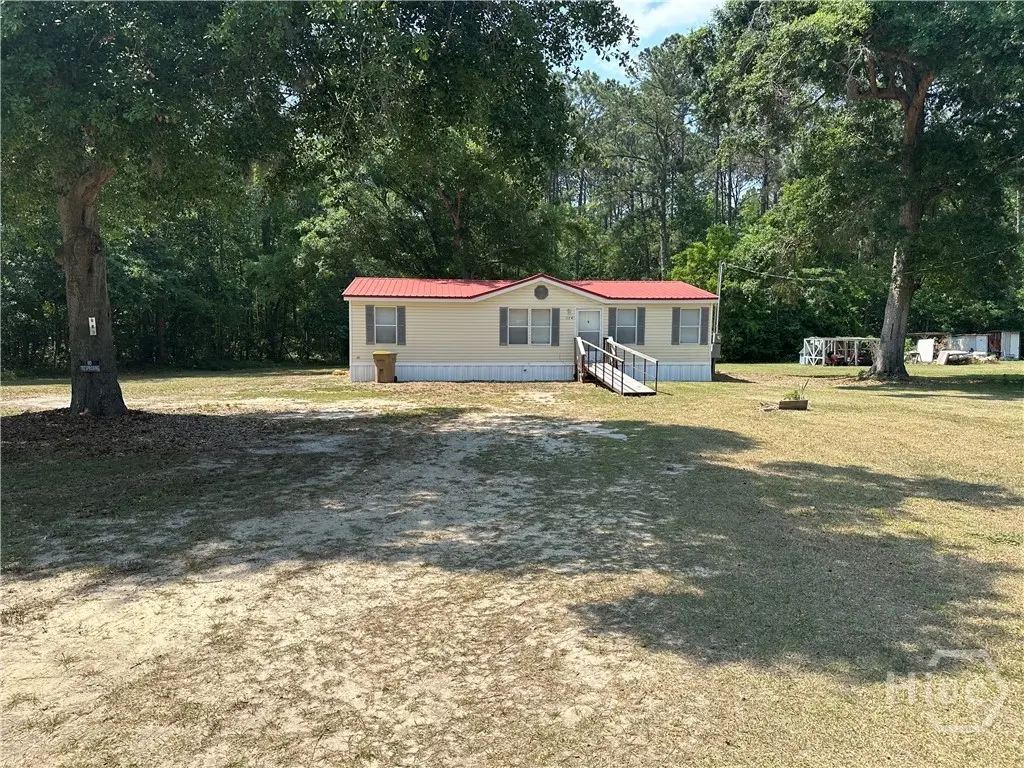
136 Corral Rd · Bloomingdale, GA
Flood risk 6/10 · Moderate
- FEMA flood zone
- X (unshaded)
- Chance of flooding over 30 yrs
- 0.74%
- Est. flood insurance / yr
- $507 – $1,088
Fire risk 4/10 · Minor
- Est. fire insurance / yr
- $963 – $1,789
Heat risk 9/10 · Severe
- Hot days now (above 108°F)
- 7 days/yr
- Hot days in 30 yrs
- 18 days/yr
Wind risk 8/10 · Major
- Chance of severe wind over 30 yrs
- 98.0%
Air-quality risk 2/10 · Minimal
- Unhealthy air days now
- 2 days/yr
- Unhealthy air days in 30 yrs
- 2 days/yr
Risk factors via First Street. Map © Google.
Why this score? — see what drove the B- grade
The composite is a weighted blend of 9 inputs, each scored 0–100. Each bar is that input's sub-score; the figure is the points it added to the 100-point composite (weight × sub-score).
- Cash flow +27.2/30.0
- ARV discount +15.0/15.0
- DSCR +9.5/10.0
- 1% rule +6.7/10.0
- Schools +4.3/10.0
- Livability +3.1/5.0
- Condition / age +2.5/5.0
- Rent growth +1.1/5.0
- Appreciation +0.0/10.0
$180,000
🖨 Deal sheet (PDF) 📄 Offer letter ✓ Due diligence
Listing remarks
Unlock the full potential of this 3 bedroom, 2 bath mobile home in Zeigler Farms in South Effingham County. Offering a solid footprint in a highly desirable area, this property is the perfect "blank canvas" for a complete renovation. Seller will make no repairs. Sold as-is, where-is, this is a prime opportunity for anyone wanting to make this mobile home your own. Schedule your showing today and bring your vision to life!
Key facts
- 2.63 acre lot
- Built 1999
- Listed 18 days
Property features AI
Exterior
- Parking: Off-street parking
- Utilities: Public water; Septic tank; Underground utilities
- Home design: Manufactured home; Single-story
- Exterior features: City lot; Publicly maintained road access; 2.63 acres
Interior
- Kitchen: Oven; Range; Refrigerator
- Bathrooms: 2 full bathrooms
- Heating & cooling: Central heating (electric); Central air conditioning (electric)
- Interior features: Ceiling fan(s); Fireplace
- Laundry & utility: Laundry room with washer hookup; Electric water heater
Neighborhood map
What this means for you Summary
Snapshot
- This is a 3-bed/2.0-bath other listed at $180k.
Deal economics
- At list price, monthly cash flow is $518 ($6k/yr) — positive.
- The deal already cash-flows at list — no discount required.
- Meets the 1% rule at list price ($2k rent vs $180k).
- Recommended offer: $177k (1.5% below list) — sets the bar for market timing.
- Cap rate 9.7% vs local median 4.1% in Bloomingdale — top-decile yield for the area; either an underpriced asset or a hidden risk that comps aren't pricing in. Stress-test before assuming the spread holds.
Location & tenants
- Location reads 61/100 on livability (#344 in GA) — a middle-class / working-renter tenant base. Strengths: cost of living A+, housing A+, crime A; Watch: schools F, amenities F, commute F.
- Effingham County (rural): math 49% / reading 48% proficiency, ranked #16 of 174 in GA (top 9%) — families likely to look elsewhere, expect single-tenant / working-renter base with shorter leases.
- Market conditions: Rents falling (-5.5%/yr); 262 active listings in the ZIP; 836 units permitted in Effingham County in 2024 (46 in 5+ unit buildings).
- This rent runs 37% of the median local income ($69k/yr) — at the standard rent-burdened threshold; future hikes will face affordability resistance.
Forward outlook
- Local home prices are declining (-3.0%/yr); year-one equity from $1k of loan paydown is wiped out by about $5k of value loss. Plan a longer hold.
- Effingham County population projected at +33% by 2050 — long-run rental-demand tailwind backs the buy-and-hold thesis.
Negotiation context
- It's been on market 18 days — a 2% lower offer ($177k) is reasonable based on typical stale-listing flexibility.
Risks & watch-outs
- Climate carrying-cost: major flood risk; severe wind risk, 98% chance of damaging wind over 30y; extreme-heat days projected 7→18/yr by 2055 (HVAC capex compounding) — expect insurance premiums to compound above CPI over the hold.
Questions for the listing agent
- Is there a deadline driving the sale (1031 exchange, divorce, estate, relocation)? That informs how much negotiation room exists.
- Schools are F-rated, which usually means shorter tenancies and higher turnover. Who's the typical renter profile here, and what's been the actual vacancy rate?
- What's the average days-on-market for RENTAL listings here right now (not sales)? A rising rental-DOM trend means longer vacancies and softer asking-rent achievability than the comps imply.
- What's the recent tenant-quality profile in this submarket — average credit score on applications, eviction rate, late-payment / NSF rate, and stable-employment percentage? A property-management company in the area should have these aggregated.
- How much new for-sale + rental construction is in the pipeline within 1–3 miles? Heavy new supply typically softens prices + rents 12–24 months out; constrained supply supports both.
Investment metrics
- 1% rule
- 1.17% ✓
- Cap rate
- 9.75%
- Cash-on-cash
- 12.33%
- DSCR
- 1.55
- GRM
- 7.1
CMA / ARV
- ARV (median comp)
- $253,700
- List price
- $180,000
- Delta
- -29.05%
- Verdict
- UNDERPRICED
- Comps
- 2 within 1.0 mi
Projected returns pro-forma
-3.0% appreciation · 0.0% rent growth · sell at horizon
- IRR
- -1.3%
- Equity multiple
- 0.95×
- Total profit
- $-2,393
- Equity at exit
- $26,839
- IRR
- 5.1%
- Equity multiple
- 1.33×
- Total profit
- $16,397
- Equity at exit
- $15,563
Cash invested: $50,400 (down + closing). Projections, not guarantees.
Landlord ↔ Tenant lean methodology
- Overall (STATE)
- 90 Strongly Landlord-Friendly
- State Georgia
- 90 Strongly Landlord-Friendly · R+3
- County
- — inherits STATE
- City
- — inherits STATE
ZIP-level market 31302
- Home prices YoY
- -18.5%
- Rents YoY
- -5.5%
- Active inventory
- 262
- Price-to-rent
- 7.1×
Monthly cashflow live
- Estimated rent
- $2,108 medium interval (Pro) →
- Mortgage (P&I)
- −$944
- Tax from tax record
- −$129 /mo · $1,543/yr
- Insurance
- −$75
- HOA
- −$0
- Vacancy / Maint / Mgmt
- −$443
- Net cashflow
- $518
Break-even live
Sensitivity live
| Price | -10% $620 | -5% $569 | +0% $518 | +5% $467 | +10% $416 |
|---|---|---|---|---|---|
| Rent | -10% $351 | -5% $435 | +0% $518 | +5% $601 | +10% $684 |
| Rate | -1.0pp $608 | -0.5pp $564 | base $518 | +0.5pp $471 | +1.0pp $424 |
UW: 25.0% down · 7.5% · 30yr · 1.5% tax · 5.0% vac · 8.0% maint · 8.0% mgmt
Financing live
Cash to close
- Down payment
- $45,000
- Closing costs
- $5,400
- Reserves months
- —
- Total cash needed
- —
Loan-product check · same deal, 3 products live
Conventional
25% down · 7.5% · 30yr
- Down + closing
- —
- Monthly P&I
- —
- Monthly cashflow
- —
- DSCR
- —
- Eligible?
- —
Personal DTI + credit; lowest rate.
DSCR
20% down · 8.5% · 30yr
- Down + closing
- —
- Monthly P&I
- —
- Monthly cashflow
- —
- DSCR
- —
- Eligible?
- —
No personal income docs; deal must DSCR.
Hard money
10% down · 12.0% · 12mo
- Down + closing
- —
- Monthly P&I
- —
- Monthly cashflow
- —
- DSCR
- —
- Eligible?
- —
Short-term bridge; refi at stabilization.
Listing history 3 events
-
2026-05-11status Pending 435-char remark
-
2026-05-06historical Active Under Contract 435-char remark
-
2026-04-23$180,000 Active 435-char remark
ⓘ Source: listings_history table (triggers on properties + properties_extension) + one-shot
backfill from property_details.listing_events for pre-trigger history.
Tax reassessment forecast GA · Resets to sale price
- Current annual tax
- $1,543 · $129/mo
- Projected year-2 tax
- $1,656 · $138/mo
- Expected delta
- +$113/yr (+$9/mo · 7.3%)
ⓘ Screening estimate from a state-policy table — verify with the county assessor before closing.
Climate risk First Street
- Flood 6/10 Major FEMA zone X (unshaded) · 74% chance over 30 yrs
- Wildfire 4/10 Moderate
- Heat 9/10 Extreme 7 d/yr ≥108°F today · 18 d/yr by 30 yrs out
- Wind 8/10 Severe 98% chance of damaging wind over 30 yrs
- Air quality 2/10 Low 2 unhealthy d/yr today · 2 by 30 yrs out
Nearby sold comps map
Loading sold comps map…
Walkable amenities ~0.75 mi
Loading nearby amenities…
Taxation est. · year 1
- Rental income
- $25,296
- − Mortgage interest
- −$10,083
- − Property taxes
- −$1,543
- − Insurance
- −$900
- − Repairs & maintenance
- −$2,024
- − Management
- −$2,024
- − Depreciation
- −$5,236
- Taxable income
- $3,487
- Est. tax owed @ 24.0%
- −$837
- After-tax cash flow
- $5,377/yr
For passive investors: Depreciation is non-cash, so a rental often shows a tax loss while cash-flowing — sheltering income. Rental losses are passive: they offset passive income freely, and up to $25,000/yr can offset ordinary (W-2) income if you actively participate and your MAGI is under $100k (phasing out to $0 by $150k); unused losses carry forward. On sale, claimed depreciation is recaptured at up to 25%, and gains may owe capital-gains tax (a 1031 exchange can defer both). Figures are a year-1 estimate at your 24.0% rate — not tax advice; consult a CPA.
Schools (NCES district)
- District
- Effingham County
- NCES district ID
- 1301980
- Math proficiency
- 49% ▼ -6.00%
- Reading proficiency
- 48% ▼ -5.00%
- Median HH income
- $60,503
- Composite
- 42.56/100
- National rank
- #3195
- State rank
- #16 of 174 in GA
Livability — Bloomingdale
- Score
- 61/100
- State rank
- #344
- US rank
- #17885
Category grades
Schools grade is shown separately in the Schools card above.
Census & demographics
- County
- Effingham County · 68,439 people
- City population
- 8,899
- Metro
- Savannah, GA
- Population (ZIP)
- 8,899
- Household income
- $68,998
- Rent vs Own
- Severe rent burden
- 188.0
Population outlook (Effingham County) Hauer SSP2
- Today (2025)
- 67,399 people
- By 2030
- 72,297 · +7.3%
- By 2040
- 81,602 · +21.1%
- By 2050
- 89,494 · +32.8%
- By 2075
- 105,976 · +57.2%
- By 2100
- 111,943 · +66.1%
Race, ethnicity, and origin ACS 2023
- Neighborhood character
- Predominantly White (79%)
- Race & ethnicity
- White 79% Black 8% Two or more races 8% Hispanic / Latino 6%
- Hispanic origin (detail)
- Mexican 1%
- Common ancestry
- Serbian 2% Lithuanian 2% Italian 2%
- Foreign-born
- 3% · Canada, Dominican Republic
- Languages at home
- 96% English-only · Spanish 2% German/W. Germanic 1% Other Indo-European 1%
Political lean MEDSL · Effingham
- 2024 margin
- Solid R (+49.1) · D 25.2% · R 74.3%
- 2008→2024 swing
- +1.6pp toward D · 2008: -50.7pp · 2024: -49.1pp
- All cycles
- 2024: R+49.1 2020: R+49.5 2016: R+55.6 2012: R+51.2 2008: R+50.7
Not yet ingested
- Civics
- —
Market trends
- HPI YoY
- ▼ -66.89%
- Current HPI
- 293.9427
- Rent YoY
- ▼ -5.51%
- Metro
- Savannah, GA
- State GDP YoY
- ▲ 2.66%
- F500 in state
- 28
Industry mix (Fortune 500 HQ in GA)
| Industry | F500 HQs | Revenue |
|---|---|---|
| Paper / Packaging | 2 | $29B |
|
||
| Retail | 1 | $160B |
|
||
| Transportation / Logistics | 1 | $91B |
|
||
| Airlines | 1 | $62B |
|
||
| Consumer Goods | 1 | $47B |
|
||
| Utilities | 1 | $25B |
|
||
Price history
3 events — show timeline
- 2026-05-11 Pending — Hive MLS
- 2026-05-06 Contingent — Hive MLS
- 2026-04-23 Listed $180,000 Hive MLS
Property tax history
+5.5%/yrLatest (2025): $1,543 · +22.5% YoY. Source: county tax records.
Cash-flow waterfall
monthlySold comps — $/sqft
last 12 mo · ≤1 miLoading sold comps…