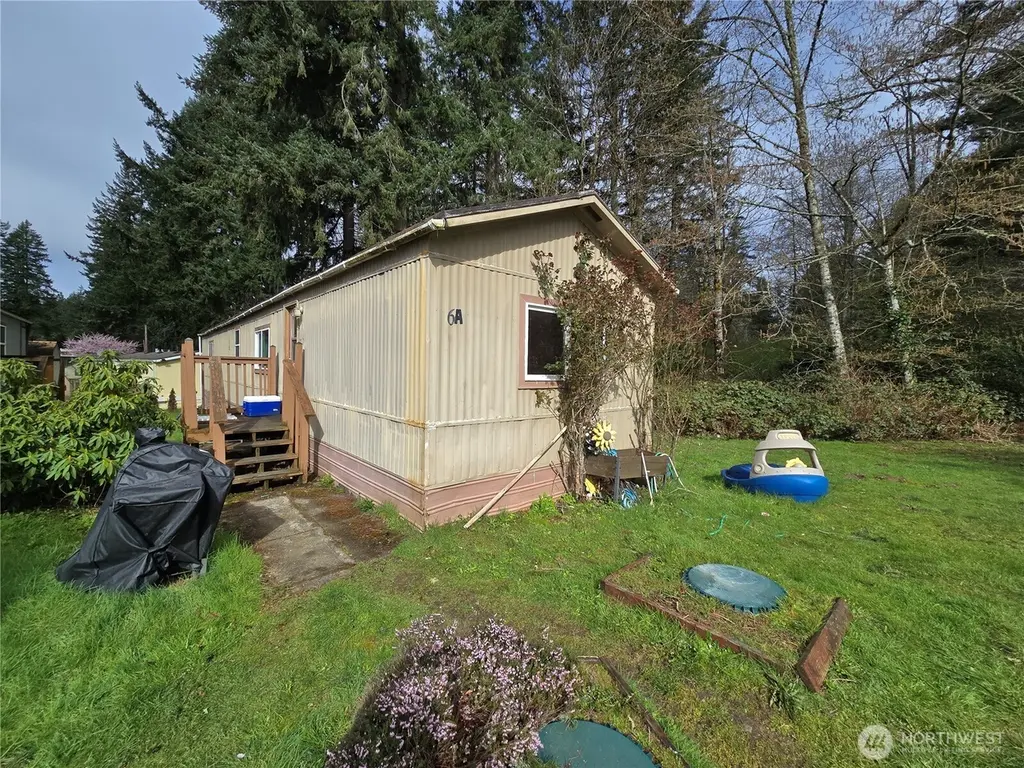
5673 Bethel Rd SE Unit 6A · Bethel, WA
Flood risk 1/10 · Minimal
- FEMA flood zone
- X (unshaded)
- Chance of flooding over 30 yrs
- 0.0%
- Est. flood insurance / yr
- $507 – $1,088
Fire risk 1/10 · Minimal
- Est. fire insurance / yr
- $604 – $1,122
Heat risk 3/10 · Minor
- Hot days now (above 86°F)
- 7 days/yr
- Hot days in 30 yrs
- 14 days/yr
Wind risk 1/10 · Minimal
- Chance of severe wind over 30 yrs
- —
Air-quality risk 7/10 · Major
- Unhealthy air days now
- 9 days/yr
- Unhealthy air days in 30 yrs
- 10 days/yr
Risk factors via First Street. Map © Google.
Why this score? — see what drove the D+ grade
The composite is a weighted blend of 9 inputs, each scored 0–100. Each bar is that input's sub-score; the figure is the points it added to the 100-point composite (weight × sub-score).
- Cash flow +15.0/30.0
- ARV discount +7.5/15.0
- Schools +5.2/10.0
- 1% rule +5.0/10.0
- DSCR +5.0/10.0
- Livability +3.4/5.0
- Rent growth +2.9/5.0
- Condition / age +2.5/5.0
- Appreciation +0.0/10.0
$19,900
🖨 Deal sheet (PDF) 📄 Offer letter ✓ Due diligence
Listing remarks
Welcome to this Port Orchard manufactured home featuring 2 bedrooms and 1.5 baths with a functional and comfortable layout. The kitchen offers generous cabinetry, ample counter space, eating nook, and a practical U-shaped design. A great opportunity to make this home your own.
Key facts
- Parking
- Built 1985
- Listed 61 days
Neighborhood map
What this means for you Summary
Snapshot
- This is a 2-bed/1.5-bath manufactured listed at $20k.
Deal economics
- At list price, monthly cash flow is $2k ($20k/yr) — positive.
- The deal already cash-flows at list — no discount required.
- Meets the 1% rule at list price ($2k rent vs $20k).
- Recommended offer: $19k (6.0% below list) — sets the bar for market timing.
- Cap rate 104.5% vs local median 3.6% in Bethel — top-decile yield for the area; either an underpriced asset or a hidden risk that comps aren't pricing in. Stress-test before assuming the spread holds.
Location & tenants
- Location reads 68/100 on livability (#279 in WA) — a middle-class / working-renter tenant base. Strengths: housing A+, employment A, crime B+; Watch: health & safety C-, cost of living D+, schools D-.
- South Kitsap School District (suburban): math 52% / reading 64% proficiency, ranked #71 of 291 in WA (top 24%) — acceptable for families but not a draw, mixed tenant base, ~2y average lease.
- Market conditions: Rents rising (+1.6%/yr); 341 active listings in the ZIP; 15 comparable units currently listed for rent nearby; rentals lingering (median 45d on market — plan ~5-8 weeks vacancy on turnover, expect pricing pressure); 53% of comp listings sitting > 30 days — soft ceiling on asking rent; high-income renter base; 1,294 units permitted in Kitsap County in 2024 (302 in 5+ unit buildings).
Forward outlook
- Local home prices are declining (-3.0%/yr); year-one equity from $138 of loan paydown is wiped out by about $597 of value loss. Plan a longer hold.
- Kitsap County population projected at +8% by 2050 — modest demand growth; plan on rents tracking national, not racing it.
- At projected returns (-3.0% appreciation + 1.6% rent growth), your $6k cash investment doubles in ~1 year — after that, you're playing with house money.
Negotiation context
- It's been on market 61 days — a 6% lower offer ($19k) is reasonable based on typical stale-listing flexibility.
- 3 sale attempts since 12y ago; this cycle's ask has dropped $15k (43%) from the opening price — seller is motivated, your offer sets the floor, not the list.
- Current owner paid $14k; 37% above their basis — modest negotiation headroom, anchor on the comps not their cost.
Questions for the listing agent
- It's been on market 61 days. Have you received any prior offers? Is the seller open to a 6% concession, seller financing, or rate buy-down credit?
- Why hasn't it sold? Are there any deal-killer items the seller is aware of (foundation, flood, title, zoning, code violations)?
- Is there a deadline driving the sale (1031 exchange, divorce, estate, relocation)? That informs how much negotiation room exists.
- Schools are D-rated, which usually means shorter tenancies and higher turnover. Who's the typical renter profile here, and what's been the actual vacancy rate?
- The area grade is low — what's the realistic commute time and amenity access for the typical tenant pool here? Any planned neighborhood developments (good or bad) we should know about?
- What's the average days-on-market for RENTAL listings here right now (not sales)? A rising rental-DOM trend means longer vacancies and softer asking-rent achievability than the comps imply.
- What's the recent tenant-quality profile in this submarket — average credit score on applications, eviction rate, late-payment / NSF rate, and stable-employment percentage? A property-management company in the area should have these aggregated.
- How much new for-sale + rental construction is in the pipeline within 1–3 miles? Heavy new supply typically softens prices + rents 12–24 months out; constrained supply supports both.
Investment metrics
- 1% rule
- 11.24% ✓
- Cap rate
- 104.53%
- Cash-on-cash
- 350.84%
- DSCR
- 16.61
- GRM
- 0.7
CMA / ARV
- ARV (median comp)
- $77,880
- List price
- $19,900
- Delta
- -74.45%
- Verdict
- UNDERPRICED
- Comps
- 3 within 1.0 mi
Show comp detail 1 sale within ~0.75 mi
| Address | Dist | Beds/Ba | Sqft | Sold | Price | $/sf | Match |
|---|---|---|---|---|---|---|---|
| 5673 Bethel Rd SE #28 | 0.01mi | 2/1.0 | 980 (+6%) | 3mo | $69,500 | $71 | 84 |
Match score weights: distance 35% · size 25% · config 20% · recency 20%. Top-matched comps best support the ARV.
Projected returns pro-forma
-3.0% appreciation · 1.6% rent growth · sell at horizon
- IRR
- —
- Equity multiple
- 18.49×
- Total profit
- $97,459
- Equity at exit
- $2,967
- IRR
- —
- Equity multiple
- 38.01×
- Total profit
- $206,212
- Equity at exit
- $1,721
Cash invested: $5,572 (down + closing). Projections, not guarantees.
Landlord ↔ Tenant lean methodology
- Overall (STATE)
- 28 Tenant-Leaning
- State Washington
- 28 Tenant-Leaning · D+8
- County
- — inherits STATE
- City
- — inherits STATE
ZIP-level market 98367
- Rents YoY
- 1.6%
- Active inventory
- 341
- Price-to-rent
- 0.7×
Monthly cashflow live
- Estimated rent
- $2,236 high interval (Pro) →
- Mortgage (P&I)
- −$104
- Tax est. 1.5%
- −$25 /mo · $298/yr
- Insurance
- −$8
- HOA
- −$0
- Vacancy / Maint / Mgmt
- −$470
- Net cashflow
- $1,629
Break-even live
Sensitivity live
| Price | -10% $1,643 | -5% $1,636 | +0% $1,629 | +5% $1,622 | +10% $1,615 |
|---|---|---|---|---|---|
| Rent | -10% $1,452 | -5% $1,541 | +0% $1,629 | +5% $1,717 | +10% $1,806 |
| Rate | -1.0pp $1,639 | -0.5pp $1,634 | base $1,629 | +0.5pp $1,624 | +1.0pp $1,619 |
UW: 25.0% down · 7.5% · 30yr · 1.5% tax · 5.0% vac · 8.0% maint · 8.0% mgmt
Financing live
Cash to close
- Down payment
- $4,975
- Closing costs
- $597
- Reserves months
- —
- Total cash needed
- —
Loan-product check · same deal, 3 products live
Conventional
25% down · 7.5% · 30yr
- Down + closing
- —
- Monthly P&I
- —
- Monthly cashflow
- —
- DSCR
- —
- Eligible?
- —
Personal DTI + credit; lowest rate.
DSCR
20% down · 8.5% · 30yr
- Down + closing
- —
- Monthly P&I
- —
- Monthly cashflow
- —
- DSCR
- —
- Eligible?
- —
No personal income docs; deal must DSCR.
Hard money
10% down · 12.0% · 12mo
- Down + closing
- —
- Monthly P&I
- —
- Monthly cashflow
- —
- DSCR
- —
- Eligible?
- —
Short-term bridge; refi at stabilization.
Rent comps 15 comps
| Address | Beds | Baths | Sqft | Rent | $/sqft | DOM | Units | Dist |
|---|---|---|---|---|---|---|---|---|
| 2192 SE Sedgwick Rd Port Orchard, WA | 2.0 | 1.0–2.0 | 739 | $2,450 | $3.31 | 14d | 22 | 0.50mi |
| 1501 SE Blueberry Rd Apt 106 Port Orchard, WA | 2.0 | 1.0 | 820 | $2,150 | $2.62 | 44d | 1 | 0.86mi |
| 1501 SE Blueberry Rd Unit 108 Port Orchard, WA | 2.0 | 1.0 | 820 | $2,175 | $2.65 | 44d | 1 | 0.86mi |
| 1501 SE Blueberry Rd Apt 305 Port Orchard, WA | 2.0 | 1.5 | 930 | $2,150 | $2.31 | 44d | 1 | 0.86mi |
| 1501 SE Blueberry Rd Apt 107 Port Orchard, WA | 2.0 | 1.0 | 930 | $2,125 | $2.28 | 44d | 1 | 0.86mi |
| 1501 SE Blueberry Rd Apt 307 Port Orchard, WA | 2.0 | 1.5 | 930 | $2,175 | $2.34 | 44d | 1 | 0.86mi |
| 1491 SE Blueberry Rd Unit 206 Port Orchard, WA | 2.0 | 2.0 | 1000 | $2,195 | $2.19 | 21d | 1 | 0.87mi |
| 1491 SE Blueberry Rd Unit 308 Port Orchard, WA | 2.0 | 2.0 | 1000 | $2,295 | $2.29 | 14d | 1 | 0.87mi |
| 1511 SE Blueberry Rd Unit 301 Port Orchard, WA | 2.0 | 1.5 | 880 | $2,175 | $2.47 | 44d | 1 | 0.87mi |
| 1511 SE Blueberry Rd Unit 104 Port Orchard, WA | 2.0 | 1.0 | 820 | $2,150 | $2.62 | 44d | 1 | 0.87mi |
| 1481 SE Blueberry Rd Port Orchard, WA | 1.0–2.0 | 1.0–2.0 | 847 | $2,295 | $2.71 | 44d | 11 | 0.89mi |
| 4210 Eastwood Ave SE Port Orchard, WA | 3.0 | 2.0 | 1008 | $2,800 | $2.78 | 21d | 1 | 1.10mi |
| 414 SW Hayworth Dr Port Orchard, WA | 1.0–2.0 | 1.0–2.0 | 828 | $1,930 | $2.33 | 14d | 6 | 1.24mi |
| 4999 Sidney Rd SW Port Orchard, WA | 1.0–3.0 | 1.0–2.0 | 961 | $2,160 | $2.25 | 14d | 21 | 1.25mi |
| 3390 Starboard Ln SE Port Orchard, WA | 2.0–3.0 | 2.0 | 975 | $1,995 | $2.05 | 14d | 3 | 1.32mi |
Listing history 23 events
-
2026-06-18days on market $19,900 Active 61 DOM
-
2026-06-17days on market $19,900 Active 60 DOM
-
2026-06-16days on market $19,900 Active 59 DOM
-
2026-06-15days on market $19,900 Active 58 DOM
-
2026-06-14days on market $19,900 Active 56 DOM
-
2026-06-13days on market $19,900 Active 55 DOM
-
2026-06-10pricedays on market $19,900 Active 53 DOM
-
2026-06-09days on market $24,900 Active 52 DOM
-
2026-06-08days on market $24,900 Active 51 DOM
-
2026-06-07days on market $24,900 Active 50 DOM
-
2026-06-05days on market $24,900 Active 47 DOM
-
2026-06-03days on market $24,900 Active 46 DOM
-
2026-06-02days on market $24,900 Active 45 DOM
-
2026-06-01days on market $24,900 Active 44 DOM
-
2026-05-31days on market $24,900 Active 43 DOM
-
2026-05-30days on market $24,900 Active 42 DOM
-
2026-05-12price $24,900
-
2026-04-24status Active
-
2026-04-20status Pending
-
2026-04-14$35,000 Active
-
2014-04-21soldstatus $14,500 Sold
-
2014-04-07status Pending
-
2014-01-26$14,500 Active
ⓘ Source: listings_history table (triggers on properties + properties_extension) + one-shot
backfill from property_details.listing_events for pre-trigger history.
Climate risk First Street
- Flood 1/10 Low FEMA zone X (unshaded) · 0% chance over 30 yrs
- Wildfire 1/10 Low
- Heat 3/10 Moderate 7 d/yr ≥86°F today · 14 d/yr by 30 yrs out
- Wind 1/10 Low
- Air quality 7/10 Severe 9 unhealthy d/yr today · 10 by 30 yrs out
Nearby sold comps map
Loading sold comps map…
Walkable amenities ~0.75 mi
Loading nearby amenities…
Taxation est. · year 1
- Rental income
- $26,835
- − Mortgage interest
- −$1,115
- − Property taxes
- −$298
- − Insurance
- −$100
- − Repairs & maintenance
- −$2,147
- − Management
- −$2,147
- − Depreciation
- −$579
- Taxable income
- $20,449
- Est. tax owed @ 24.0%
- −$4,908
- After-tax cash flow
- $14,641/yr
For passive investors: Depreciation is non-cash, so a rental often shows a tax loss while cash-flowing — sheltering income. Rental losses are passive: they offset passive income freely, and up to $25,000/yr can offset ordinary (W-2) income if you actively participate and your MAGI is under $100k (phasing out to $0 by $150k); unused losses carry forward. On sale, claimed depreciation is recaptured at up to 25%, and gains may owe capital-gains tax (a 1031 exchange can defer both). Figures are a year-1 estimate at your 24.0% rate — not tax advice; consult a CPA.
Schools (NCES district)
- District
- South Kitsap School District
- NCES district ID
- 5308160
- Math proficiency
- 52% ▲ 2.00%
- Reading proficiency
- 64% ▲ 3.00%
- Median HH income
- $62,824
- Composite
- 52.31/100
- National rank
- #3445
- State rank
- #71 of 291 in WA
Livability — Bethel
- Score
- 68/100
- State rank
- #279
- US rank
- #9629
Category grades
Schools grade is shown separately in the Schools card above.
Census & demographics
- Census place
- Bethel, WA
- County
- Kitsap County · 243,099 people
- Metro
- Bremerton-Silverdale-Port Orchard, WA
- Population (ZIP)
- 31,756
- Household income
- $115,482
- Rent vs Own
- Severe rent burden
- 595.0
Population outlook (Kitsap County) Hauer SSP2
- Today (2025)
- 277,525 people
- By 2030
- 285,040 · +2.7%
- By 2040
- 294,957 · +6.3%
- By 2050
- 300,622 · +8.3%
- By 2075
- 315,580 · +13.7%
- By 2100
- 304,340 · +9.7%
Race, ethnicity, and origin ACS 2023
- Neighborhood character
- Predominantly White (78%)
- Race & ethnicity
- White 78% Two or more races 11% Hispanic / Latino 7% Asian 4% Pacific Islander 1%
- Hispanic origin (detail)
- Mexican 5%
- Common ancestry
- Italian 7% Portuguese 6% Slovak 4%
- Foreign-born
- 6% · Canada, South Korea, Vietnam
- Languages at home
- 91% English-only · Spanish 3% Tagalog/Filipino 2% Other Asian/Pacific 2%
Political lean MEDSL · Kitsap
- 2024 margin
- Strong D (+20.9) · D 58.8% · R 37.9% · Other 3.3%
- 2008→2024 swing
- +8.6pp toward D · 2008: 12.3pp · 2024: 20.9pp
- All cycles
- 2024: D+20.9 2020: D+18.1 2016: D+11.6 2012: D+11.1 2008: D+12.3
Not yet ingested
- Civics
- —
Market trends
- HPI YoY
- ▼ -441.02%
- Current HPI
- 351.671
- Rent YoY
- ▲ 1.60%
- Metro
- Bremerton-Silverdale-Port Orchard, WA
- State GDP YoY
- ▲ 4.65%
- F500 in state
- 22
Industry mix (Fortune 500 HQ in WA)
| Industry | F500 HQs | Revenue |
|---|---|---|
| Retail | 2 | $269B |
|
||
| Technology / Retail | 1 | $638B |
|
||
| Technology | 1 | $245B |
|
||
| Telecommunications | 1 | $38B |
|
||
| Food / Beverage | 1 | $36B |
|
||
| Automotive / Trucks | 1 | $34B |
|
||
Price history
+71.7% since first listed7 events — show timeline
- 2026-05-12 Price Changed $24,900 NWMLS as Distributed by MLS Grid
- 2026-04-24 Relisted — NWMLS as Distributed by MLS Grid
- 2026-04-20 Pending — NWMLS as Distributed by MLS Grid
- 2026-04-14 Listed $35,000 NWMLS as Distributed by MLS Grid
- 2014-04-21 Sold (MLS) $14,500 NWMLS as Distributed by MLS Grid
- 2014-04-07 Pending — NWMLS as Distributed by MLS Grid
- 2014-01-26 Listed $14,500 NWMLS as Distributed by MLS Grid
Cash-flow waterfall
monthlySold comps — $/sqft
last 12 mo · ≤1 miLoading sold comps…