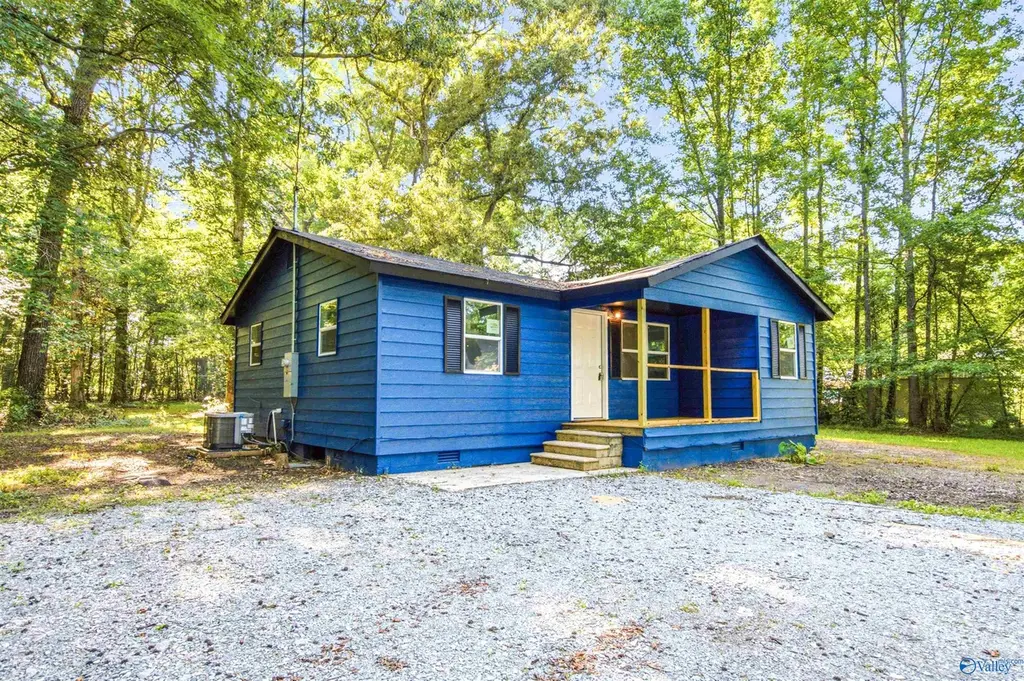
23365 Highway 251 · Harvest, AL
Flood risk 1/10 · Minimal
- FEMA flood zone
- X (unshaded)
- Chance of flooding over 30 yrs
- 0.0%
- Est. flood insurance / yr
- $507 – $1,088
Fire risk 3/10 · Minor
- Est. fire insurance / yr
- $916 – $1,700
Heat risk 5/10 · Moderate
- Hot days now (above 104°F)
- 7 days/yr
- Hot days in 30 yrs
- 19 days/yr
Wind risk 4/10 · Minor
- Chance of severe wind over 30 yrs
- 16.0%
Air-quality risk 1/10 · Minimal
- Unhealthy air days now
- 0 days/yr
- Unhealthy air days in 30 yrs
- 0 days/yr
Risk factors via First Street. Map © Google.
Why this score? — see what drove the C grade
The composite is a weighted blend of 9 inputs, each scored 0–100. Each bar is that input's sub-score; the figure is the points it added to the 100-point composite (weight × sub-score).
- Cash flow +19.5/30.0
- Appreciation +10.0/10.0
- ARV discount +7.5/15.0
- DSCR +6.2/10.0
- 1% rule +5.2/10.0
- Livability +3.6/5.0
- Schools +2.8/10.0
- Rent growth +2.5/5.0
- Condition / age +2.5/5.0
$150,000
🖨 Deal sheet 📄 Offer letter ✓ Due diligence
Listing remarks
Completely remodeled and move-in ready! Situated on a spacious 1-acre lot, this beautifully updated home offers the peace of country living with the confidence of major modern upgrades already completed. Renovations completed this year include new PEX plumbing throughout, updated electrical, a replaced and upgraded electric meter, new windows, doors, cabinetry, interior paint, fixtures, and a freshly painted exterior. The roof is approximately 5 years old, adding even more value and peace of mind. Outside, you'll find two storage sheds providing plenty of room for tools, equipment, hobbies, or additional storage.
Key facts
- Move-in ready
- Remodeled
- Updated electrical
Tags
Property features AI
Finance
- Other: Subdivision: Metes And Bounds
- HOA & community: No homeowners association
Exterior
- Parking: Gravel driveway
- Utilities: Public water; Septic tank sewer
- Home design: Single-family residence; One story; Built in 1967; Vinyl siding
- Construction: Vinyl siding construction; Built in 1967
- Exterior features: Detached building; Gravel driveway; Approximately 1.01-acre lot (420 x 105)
Interior
- Bathrooms: 1 full bathroom
- Heating & cooling: Central heating; Central cooling
- Interior features: 5 total rooms; Crawl space basement
Neighborhood map
What this means for you Summary
Snapshot
- This is a 3-bed/1.0-bath single-family listed at $150k.
Deal economics
- At list price, monthly cash flow is $171 ($2k/yr) — positive.
- The deal already cash-flows at list — no discount required.
- Meets the 1% rule at list price ($2k rent vs $150k).
- Cap rate 7.7% vs local median 3.5% in Harvest — top-decile yield for the area; either an underpriced asset or a hidden risk that comps aren't pricing in. Stress-test before assuming the spread holds.
Location & tenants
- Location reads 72/100 on livability (#27 in AL) — a middle-class / working-renter tenant base. Strengths: crime A+, employment A+, cost of living A+; Watch: amenities F, commute F, health & safety F.
- Limestone County (rural): math 21% / reading 44% proficiency, ranked #52 of 129 in AL (top 40%) — families likely to look elsewhere, expect single-tenant / working-renter base with shorter leases.
- Zoned schools: Johnson Elementary School (math 37% / reading 57%, grade D-, #142 of 627 statewide, top 25%, 363 students, 51% FRL); Ardmore High School (math 15% / reading 38%, grade F, #107 of 305 statewide, top 36%, 993 students, 50% FRL).
- Market conditions: 319 active listings in the ZIP; 494 units permitted in Limestone County in 2024 (0 in 5+ unit buildings).
Forward outlook
- In year one you build about $16k of equity ($1k loan paydown + $15k appreciation (10.0% local appreciation)).
- Limestone County population projected at +43% by 2050 — long-run rental-demand tailwind backs the buy-and-hold thesis.
- At projected returns (10.0% appreciation + 3.0% rent growth), your $42k cash investment doubles in ~3 years — after that, you're playing with house money.
- By year 3, paydown + projected appreciation supports a ~$41k cash-out refi (75% LTV) — recoverable capital for the next deal without selling this one.
Negotiation context
- Only 6 days on market — expect competitive offers; lowballing is unlikely to land.
Risks & watch-outs
- Climate carrying-cost: extreme-heat days projected 7→19/yr by 2055 (HVAC capex compounding) — expect insurance premiums to compound above CPI over the hold.
Questions for the listing agent
- Built in 1967 — when were the roof, HVAC, electrical panel, plumbing, and water heater last replaced?
- Is there a deadline driving the sale (1031 exchange, divorce, estate, relocation)? That informs how much negotiation room exists.
- What's the average days-on-market for RENTAL listings here right now (not sales)? A rising rental-DOM trend means longer vacancies and softer asking-rent achievability than the comps imply.
- What's the recent tenant-quality profile in this submarket — average credit score on applications, eviction rate, late-payment / NSF rate, and stable-employment percentage? A property-management company in the area should have these aggregated.
- How much new for-sale + rental construction is in the pipeline within 1–3 miles? Heavy new supply typically softens prices + rents 12–24 months out; constrained supply supports both.
Investment metrics
- 1% rule
- 1.02% ✓
- Cap rate
- 7.66%
- Cash-on-cash
- 4.88%
- DSCR
- 1.22
- GRM
- 8.2
CMA / ARV
No comps found within radius.
Projected returns pro-forma
10.0% appreciation · 3.0% rent growth · sell at horizon
- IRR
- 27.8%
- Equity multiple
- 3.20×
- Total profit
- $92,591
- Equity at exit
- $135,132
- IRR
- 24.3%
- Equity multiple
- 7.29×
- Total profit
- $264,159
- Equity at exit
- $291,417
Cash invested: $42,000 (down + closing). Projections, not guarantees.
Landlord ↔ Tenant lean methodology
- Overall (STATE)
- 90 Strongly Landlord-Friendly
- State Alabama
- 90 Strongly Landlord-Friendly · R+15
- County
- — inherits STATE
- City
- — inherits STATE
ZIP-level market 35773
- Home prices YoY
- 28.8%
- Active inventory
- 319
- Price-to-rent
- 8.2×
Monthly cashflow live
- Estimated rent
- $1,528 medium interval (Pro) →
- Mortgage (P&I)
- −$787
- Tax est. 1.5%
- −$188 /mo · $2,250/yr
- Insurance
- −$62
- HOA
- −$0
- Vacancy / Maint / Mgmt
- −$321
- Net cashflow
- $171
Break-even live
UW: 25.0% down · 7.5% · 30yr · 1.5% tax · 5.0% vac · 8.0% maint · 8.0% mgmt
Financing live
Cash to close
- Down payment
- $37,500
- Closing costs
- $4,500
- Reserves months
- —
- Total cash needed
- —
Loan-product check · same deal, 3 products live
Conventional
25% down · 7.5% · 30yr
- Down + closing
- —
- Monthly P&I
- —
- Monthly cashflow
- —
- DSCR
- —
- Eligible?
- —
Personal DTI + credit; lowest rate.
DSCR
20% down · 8.5% · 30yr
- Down + closing
- —
- Monthly P&I
- —
- Monthly cashflow
- —
- DSCR
- —
- Eligible?
- —
No personal income docs; deal must DSCR.
Hard money
10% down · 12.0% · 12mo
- Down + closing
- —
- Monthly P&I
- —
- Monthly cashflow
- —
- DSCR
- —
- Eligible?
- —
Short-term bridge; refi at stabilization.
Listing history 6 events
-
2026-06-18days on market $150,000 Active 6 DOM
-
2026-06-17days on market $150,000 Active 5 DOM
-
2026-06-16days on market $150,000 Active 4 DOM
-
2026-06-15days on market $150,000 Active 3 DOM
-
2026-06-14remarks 620-char remark
-
2026-06-14$150,000 Active 1 DOM
ⓘ Source: listings_history table (triggers on properties + properties_extension) + one-shot
backfill from property_details.listing_events for pre-trigger history.
Climate risk First Street
- Flood 1/10 Low FEMA zone X (unshaded) · 0% chance over 30 yrs
- Wildfire 3/10 Moderate
- Heat 5/10 Major 7 d/yr ≥104°F today · 19 d/yr by 30 yrs out
- Wind 4/10 Moderate 16% chance of damaging wind over 30 yrs
- Air quality 1/10 Low 0 unhealthy d/yr today · 0 by 30 yrs out
Nearby sold comps map
Loading sold comps map…
Walkable amenities ~0.75 mi
Loading nearby amenities…
Taxation est. · year 1
- Rental income
- $18,339
- − Mortgage interest
- −$8,402
- − Property taxes
- −$2,250
- − Insurance
- −$750
- − Repairs & maintenance
- −$1,467
- − Management
- −$1,467
- − Depreciation
- −$4,364
- Taxable loss
- −$361
- Est. tax savings @ 24.0%
- +$87
- After-tax cash flow
- $2,135/yr
For passive investors: Depreciation is non-cash, so a rental often shows a tax loss while cash-flowing — sheltering income. Rental losses are passive: they offset passive income freely, and up to $25,000/yr can offset ordinary (W-2) income if you actively participate and your MAGI is under $100k (phasing out to $0 by $150k); unused losses carry forward. On sale, claimed depreciation is recaptured at up to 25%, and gains may owe capital-gains tax (a 1031 exchange can defer both). Figures are a year-1 estimate at your 24.0% rate — not tax advice; consult a CPA.
Schools (NCES district)
- District
- Limestone County
- NCES district ID
- 0102100
- Math proficiency
- 21% ▼ -23.00%
- Reading proficiency
- 44% ▼ -3.00%
- Median HH income
- $48,972
- Composite
- 28.09/100
- National rank
- #6829
- State rank
- #52 of 129 in AL
Livability — Harvest
- Score
- 72/100
- State rank
- #27
- US rank
- #5986
Category grades
Schools grade is shown separately in the Schools card above.
Census & demographics
- City population
- 30,710
- Population (ZIP)
- 13,977
Population outlook (Limestone County) Hauer SSP2
- Today (2025)
- 111,441 people
- By 2030
- 121,272 · +8.8%
- By 2040
- 140,705 · +26.3%
- By 2050
- 159,069 · +42.7%
- By 2075
- 202,231 · +81.5%
- By 2100
- 230,608 · +106.9%
Race, ethnicity, and origin ACS 2023
- Neighborhood character
- Predominantly White (72%)
- Race & ethnicity
- White 72% Black 17% Hispanic / Latino 7% Two or more races 3% Asian 2%
- Hispanic origin (detail)
- Mexican 5%
- Common ancestry
- Italian 3% Slovak 1% Serbian 1%
- Foreign-born
- 2% · Canada
- Languages at home
- 95% English-only · Spanish 4%
Political lean MEDSL · Limestone
- 2024 margin
- Solid R (+43.9) · D 27.5% · R 71.4% · Other 1.2%
- 2008→2024 swing
- -2.0pp toward R · 2008: -41.9pp · 2024: -43.9pp
- All cycles
- 2024: R+43.9 2020: R+42.6 2016: R+49.5 2012: R+43.6 2008: R+41.9
Not yet ingested
- Civics
- —
Market trends
- HPI YoY
- ▲ 149.14%
- Current HPI
- 666.8602
- Rent YoY
- —
- Metro
- —
- State GDP YoY
- ▲ 2.94%
- F500 in state
- 4
Industry mix (Fortune 500 HQ in AL)
| Industry | F500 HQs | Revenue |
|---|---|---|
| Financial Services | 1 | $8B |
|
||
| Healthcare | 1 | $5B |
|
||
Price history
1 event — show timeline
- 2026-06-12 Listed $150,000 VMLS
Property tax history
+6.4%/yrLatest (2025): $212 · -23.7% YoY. Source: county tax records.
Cash-flow waterfall
monthlySold comps — $/sqft
last 12 mo · ≤1 miLoading sold comps…