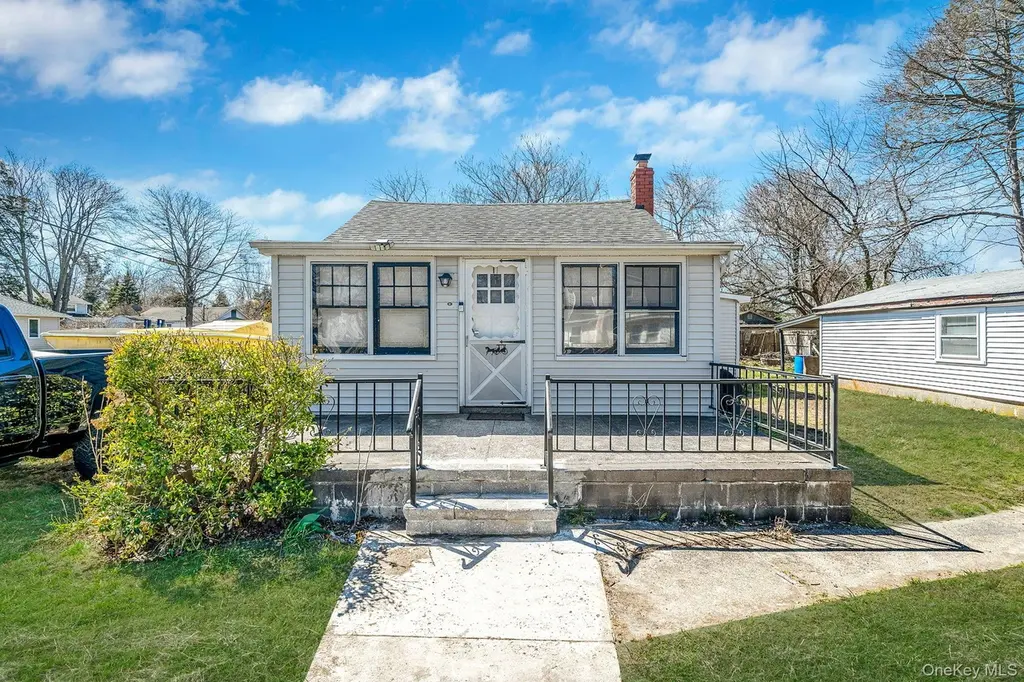
2 Roberts Ave · Mastic Beach, NY
Flood risk 5/10 · Moderate
- FEMA flood zone
- X (unshaded)
- Chance of flooding over 30 yrs
- 0.41%
- Est. flood insurance / yr
- $473 – $860
Fire risk 1/10 · Minimal
- Est. fire insurance / yr
- $691 – $1,283
Heat risk 4/10 · Minor
- Hot days now (above 92°F)
- 7 days/yr
- Hot days in 30 yrs
- 20 days/yr
Wind risk 8/10 · Major
- Chance of severe wind over 30 yrs
- 80.0%
Air-quality risk 4/10 · Minor
- Unhealthy air days now
- 3 days/yr
- Unhealthy air days in 30 yrs
- 5 days/yr
Risk factors via First Street. Map © Google.
Why this score? — see what drove the C+ grade
The composite is a weighted blend of 9 inputs, each scored 0–100. Each bar is that input's sub-score; the figure is the points it added to the 100-point composite (weight × sub-score).
- Cash flow +18.8/30.0
- Appreciation +10.0/10.0
- ARV discount +7.5/15.0
- DSCR +5.9/10.0
- 1% rule +5.0/10.0
- Schools +4.7/10.0
- Livability +3.1/5.0
- Rent growth +2.5/5.0
- Condition / age +2.5/5.0
$399,999
🖨 Deal sheet 📄 Offer letter ✓ Due diligence
Listing remarks MLS
Welcome to this cute 3 bedroom, 1 bathroom Cottage. Beautiful level property with detached garage. Lots of potential!
Key facts
- 8,799 sq ft lot
- 2 garage spots
- Built 1900
Property features AI
Exterior
- Parking: 2-car garage
- Utilities: Electric service connected (PSEG); Cesspool sewer
- Home design: Single family residence; One level
- Construction: Aluminum siding construction
- Exterior features: Aluminum siding; Fenced yard; Additional parcels included; Not waterfront
Interior
- Kitchen: Oven; Microwave; Refrigerator; Dishwasher
- Bedrooms: Bedroom on the first floor
- Bathrooms: 1 full bathroom
- Heating & cooling: Oil heating; Wall/window air conditioning units
- Interior features: First-floor bedroom; First-floor full bathroom; Porch; Partial attic; Crawl space basement; 8 total rooms
- Laundry & utility: Laundry room; Washer; Dryer
Neighborhood map
What this means for you Summary
Snapshot
- This is a 3-bed/1.0-bath other listed at $400k.
Deal economics
- At list price, monthly cash flow is $404 ($5k/yr) — positive.
- The deal already cash-flows at list — no discount required.
- Meets the 1% rule at list price ($4k rent vs $400k).
- Cap rate 7.5% vs local median 4.7% in Mastic Beach — top-decile yield for the area; either an underpriced asset or a hidden risk that comps aren't pricing in. Stress-test before assuming the spread holds.
Location & tenants
- Location reads 61/100 on livability (#936 in NY) — a middle-class / working-renter tenant base. Strengths: employment A+, housing A+; Watch: crime D, amenities F, commute F.
- William Floyd Union Free School District (suburban): math 48% / reading 57% proficiency, ranked #309 of 590 in NY (top 52%) — acceptable for families but not a draw, mixed tenant base, ~2y average lease.
- Zoned schools: John S Hobart Elementary School (math 48% / reading 42%, grade D-, #1,274 of 2,108 statewide, top 61%, 798 students, 58% FRL); William Paca Middle School (math 31% / reading 37%, grade F, #497 of 729 statewide, top 69%, 1,009 students, 59% FRL); William Floyd High School (math 65% / reading 87%, grade A-, #616 of 1,100 statewide, top 57%, 3,013 students, 54% FRL).
- Market conditions: 133 active listings in the ZIP; 6 comparable units currently listed for rent nearby; rentals leasing fast (median 1d on market — plan ~1-2 weeks tenant-placement turnaround); 1,366 units permitted in Suffolk County in 2024 (216 in 5+ unit buildings).
Forward outlook
- In year one you build about $43k of equity ($3k loan paydown + $40k appreciation (10.0% local appreciation)).
- Suffolk County population projected to shrink 5% by 2050 — rents likely to lag national; underwrite the cash flow, not the appreciation.
- At projected returns (10.0% appreciation + 3.0% rent growth), your $112k cash investment doubles in ~3 years — after that, you're playing with house money.
- By year 2, paydown + projected appreciation supports a ~$69k cash-out refi (75% LTV) — recoverable capital for the next deal without selling this one.
Negotiation context
- Only 4 days on market — expect competitive offers; lowballing is unlikely to land.
- 4 sale attempts since 5y ago with the ask held roughly flat each time — persistent listings suggest the price (not the market) is what's stuck; bring a comps-based counter.
- Current owner paid $305k; 31% above their basis — modest negotiation headroom, anchor on the comps not their cost.
Risks & watch-outs
- Watch-outs: built in 1900 — expect roof / HVAC / electrical / plumbing capex.
- Climate carrying-cost: moderate flood risk; severe wind risk, 80% chance of damaging wind over 30y — expect insurance premiums to compound above CPI over the hold.
Questions for the listing agent
- Built in 1900 — when were the roof, HVAC, electrical panel, plumbing, and water heater last replaced?
- Is there a deadline driving the sale (1031 exchange, divorce, estate, relocation)? That informs how much negotiation room exists.
- Schools are D-rated, which usually means shorter tenancies and higher turnover. Who's the typical renter profile here, and what's been the actual vacancy rate?
- Crime grade is D in this area — have there been break-ins, vandalism, or insurance claims at this property in the last 3 years? What carrier currently insures it and at what premium?
- What's the average days-on-market for RENTAL listings here right now (not sales)? A rising rental-DOM trend means longer vacancies and softer asking-rent achievability than the comps imply.
- What's the recent tenant-quality profile in this submarket — average credit score on applications, eviction rate, late-payment / NSF rate, and stable-employment percentage? A property-management company in the area should have these aggregated.
- How much new for-sale + rental construction is in the pipeline within 1–3 miles? Heavy new supply typically softens prices + rents 12–24 months out; constrained supply supports both.
Investment metrics
- 1% rule
- 1.00% ✓
- Cap rate
- 7.51%
- Cash-on-cash
- 4.33%
- DSCR
- 1.19
- GRM
- 8.3
CMA / ARV
No comps found within radius.
Projected returns pro-forma
10.0% appreciation · 3.0% rent growth · sell at horizon
- IRR
- 27.4%
- Equity multiple
- 3.18×
- Total profit
- $243,668
- Equity at exit
- $360,351
- IRR
- 23.9%
- Equity multiple
- 7.23×
- Total profit
- $697,427
- Equity at exit
- $777,110
Cash invested: $112,000 (down + closing). Projections, not guarantees.
Landlord ↔ Tenant lean methodology
- Overall (STATE)
- 15 Strongly Tenant-Friendly
- State New York
- 15 Strongly Tenant-Friendly · D+10
- County
- — inherits STATE
- City
- — inherits STATE
ZIP-level market 11951
- Home prices YoY
- 4.3%
- Active inventory
- 133
- Price-to-rent
- 8.3×
Monthly cashflow live
- Estimated rent
- $4,011 high interval (Pro) →
- Mortgage (P&I)
- −$2,098
- Tax est. 1.5%
- −$500 /mo · $6,000/yr
- Insurance
- −$167
- HOA
- −$0
- Vacancy / Maint / Mgmt
- −$842
- Net cashflow
- $404
Break-even live
UW: 25.0% down · 7.5% · 30yr · 1.5% tax · 5.0% vac · 8.0% maint · 8.0% mgmt
Financing live
Cash to close
- Down payment
- $100,000
- Closing costs
- $12,000
- Reserves months
- —
- Total cash needed
- —
Loan-product check · same deal, 3 products live
Conventional
25% down · 7.5% · 30yr
- Down + closing
- —
- Monthly P&I
- —
- Monthly cashflow
- —
- DSCR
- —
- Eligible?
- —
Personal DTI + credit; lowest rate.
DSCR
20% down · 8.5% · 30yr
- Down + closing
- —
- Monthly P&I
- —
- Monthly cashflow
- —
- DSCR
- —
- Eligible?
- —
No personal income docs; deal must DSCR.
Hard money
10% down · 12.0% · 12mo
- Down + closing
- —
- Monthly P&I
- —
- Monthly cashflow
- —
- DSCR
- —
- Eligible?
- —
Short-term bridge; refi at stabilization.
Rent comps 6 comps
| Address | Beds | Baths | Sqft | Rent | $/sqft | DOM | Units | Dist |
|---|---|---|---|---|---|---|---|---|
| 165 Lynbrook Dr Mastic Beach, NY | 3.0 | 2.0 | 1520 | $4,000 | $2.63 | 1d | 1 | 0.25mi |
| 126 Flower Rd Shirley, NY | 4.0 | 1.0 | 1756 | $4,100 | $2.33 | 1d | 1 | 0.64mi |
| 6 Fairview Dr Shirley, NY | 4.0 | 2.0 | 1302 | $4,299 | $3.30 | 2d | 1 | 0.72mi |
| 192 Cypress Dr Mastic Beach, NY | 4.0 | 2.0 | 1404 | $3,800 | $2.71 | 43d | 1 | 1.09mi |
| 44 Pine Tree Dr Shirley, NY | 4.0 | 2.0 | 1600 | $4,200 | $2.62 | 1d | 1 | 1.25mi |
| 149 Washington Dr Mastic Beach, NY | 3.0 | 1.0 | 1152 | $3,400 | $2.95 | 1d | 1 | 1.31mi |
Listing history 12 events
-
2026-04-22status Pending
-
2026-04-09status Active
-
2026-04-09$399,999 Active
-
2026-04-07historical $399,999
-
2022-10-31soldstatus $305,000
-
2022-09-19soldstatus $305,000 Closed 117-char remark
Show marketing remark (117 chars)
Welcome to this cute 3 bedroom, 1 bathroom Cottage. Beautiful level property with detached garage. Lots of potential!
-
2022-08-10status Pending 117-char remark
Show marketing remark (117 chars)
Welcome to this cute 3 bedroom, 1 bathroom Cottage. Beautiful level property with detached garage. Lots of potential!
-
2022-06-10status Active 117-char remark
Show marketing remark (117 chars)
Welcome to this cute 3 bedroom, 1 bathroom Cottage. Beautiful level property with detached garage. Lots of potential!
-
2022-02-28status Pending 117-char remark
Show marketing remark (117 chars)
Welcome to this cute 3 bedroom, 1 bathroom Cottage. Beautiful level property with detached garage. Lots of potential!
-
2021-12-27price $299,000 117-char remark
Show marketing remark (117 chars)
Welcome to this cute 3 bedroom, 1 bathroom Cottage. Beautiful level property with detached garage. Lots of potential!
-
2021-12-02$310,000 Active 117-char remark
Show marketing remark (117 chars)
Welcome to this cute 3 bedroom, 1 bathroom Cottage. Beautiful level property with detached garage. Lots of potential!
-
2003-03-06soldstatus $175,000
ⓘ Source: listings_history table (triggers on properties + properties_extension) + one-shot
backfill from property_details.listing_events for pre-trigger history.
Climate risk First Street
- Flood 5/10 Major FEMA zone X (unshaded) · 41% chance over 30 yrs
- Wildfire 1/10 Low
- Heat 4/10 Moderate 7 d/yr ≥92°F today · 20 d/yr by 30 yrs out
- Wind 8/10 Severe 80% chance of damaging wind over 30 yrs
- Air quality 4/10 Moderate 3 unhealthy d/yr today · 5 by 30 yrs out
Nearby sold comps map
Loading sold comps map…
Walkable amenities ~0.75 mi
Loading nearby amenities…
Taxation est. · year 1
- Rental income
- $48,132
- − Mortgage interest
- −$22,406
- − Property taxes
- −$6,000
- − Insurance
- −$2,000
- − Repairs & maintenance
- −$3,851
- − Management
- −$3,851
- − Depreciation
- −$11,636
- Taxable loss
- −$1,611
- Est. tax savings @ 24.0%
- +$387
- After-tax cash flow
- $5,240/yr
For passive investors: Depreciation is non-cash, so a rental often shows a tax loss while cash-flowing — sheltering income. Rental losses are passive: they offset passive income freely, and up to $25,000/yr can offset ordinary (W-2) income if you actively participate and your MAGI is under $100k (phasing out to $0 by $150k); unused losses carry forward. On sale, claimed depreciation is recaptured at up to 25%, and gains may owe capital-gains tax (a 1031 exchange can defer both). Figures are a year-1 estimate at your 24.0% rate — not tax advice; consult a CPA.
Schools (NCES district)
- District
- William Floyd Union Free School District
- NCES district ID
- 3618690
- Math proficiency
- 48% ▲ 3.00%
- Reading proficiency
- 57% ▲ 11.00%
- Median HH income
- $70,564
- Composite
- 46.79/100
- National rank
- #2383
- State rank
- #309 of 590 in NY
Livability — Mastic Beach
- Score
- 61/100
- State rank
- #936
- US rank
- #18216
Category grades
Schools grade is shown separately in the Schools card above.
Census & demographics
- Census place
- Mastic Beach, NY
- City population
- 15,830
- Population (ZIP)
- 15,830
Population outlook (Suffolk County) Hauer SSP2
- Today (2025)
- 1,505,262 people
- By 2030
- 1,498,318 · -0.5%
- By 2040
- 1,471,101 · -2.3%
- By 2050
- 1,424,848 · -5.3%
- By 2075
- 1,337,157 · -11.2%
- By 2100
- 1,217,720 · -19.1%
Race, ethnicity, and origin ACS 2023
- Neighborhood character
- Predominantly White (68%)
- Race & ethnicity
- White 68% Hispanic / Latino 17% Two or more races 9% Black 6% Asian 2%
- Hispanic origin (detail)
- Mexican 1% Puerto Rican 6% Cuban 2%
- Common ancestry
- Lithuanian 3% Romanian 2% Italian 2%
- Foreign-born
- 7% · Canada, Vietnam
- Languages at home
- 84% English-only · Spanish 10% Other Indo-European 3% Chinese 1%
Political lean MEDSL · Suffolk
- 2024 margin
- Lean R (+10.0) · D 45.0% · R 55.0%
- 2008→2024 swing
- -16.0pp toward R · 2008: 6.0pp · 2024: -10.0pp
- All cycles
- 2024: R+10.0 2020: R+0.0 2016: R+8.2 2012: D+2.9 2008: D+6.0
Not yet ingested
- Civics
- —
Market trends
- HPI YoY
- ▲ 34.46%
- Current HPI
- 829.86
- Rent YoY
- —
- Metro
- —
- State GDP YoY
- ▲ 2.60%
- F500 in state
- 92
Industry mix (Fortune 500 HQ in NY)
| Industry | F500 HQs | Revenue |
|---|---|---|
| Financial Services | 10 | $950B |
|
||
| Consumer Goods | 9 | $162B |
|
||
| Insurance | 4 | $225B |
|
||
| Telecommunications | 2 | $144B |
|
||
| Pharmaceuticals | 2 | $112B |
|
||
| Media / Entertainment | 2 | $69B |
|
||
Price history
+128.6% since first listed12 events — show timeline
- 2026-04-22 Pending — OneKey® MLS as Distributed by MLS Grid
- 2026-04-09 Relisted — OneKey® MLS as Distributed by MLS Grid
- 2026-04-09 Listed $399,999 OneKey® MLS as Distributed by MLS Grid
- 2026-04-07 Coming Soon $399,999 OneKey® MLS as Distributed by MLS Grid
- 2022-10-31 Sold (Public Records) $305,000 Public Records
- 2022-09-19 Sold (MLS) $305,000 OneKey® MLS as Distributed by MLS Grid
- 2022-08-10 Pending — OneKey® MLS as Distributed by MLS Grid
- 2022-06-10 Relisted — OneKey® MLS as Distributed by MLS Grid
- 2022-02-28 Pending — OneKey® MLS as Distributed by MLS Grid
- 2021-12-27 Price Changed $299,000 OneKey® MLS as Distributed by MLS Grid
- 2021-12-02 Listed $310,000 OneKey® MLS as Distributed by MLS Grid
- 2003-03-06 Sold (Public Records) $175,000 Public Records
Property tax history
+0.1%/yrLatest (2025): $328 · +0.0% YoY. Source: county tax records.
Cash-flow waterfall
monthlySold comps — $/sqft
last 12 mo · ≤1 miLoading sold comps…