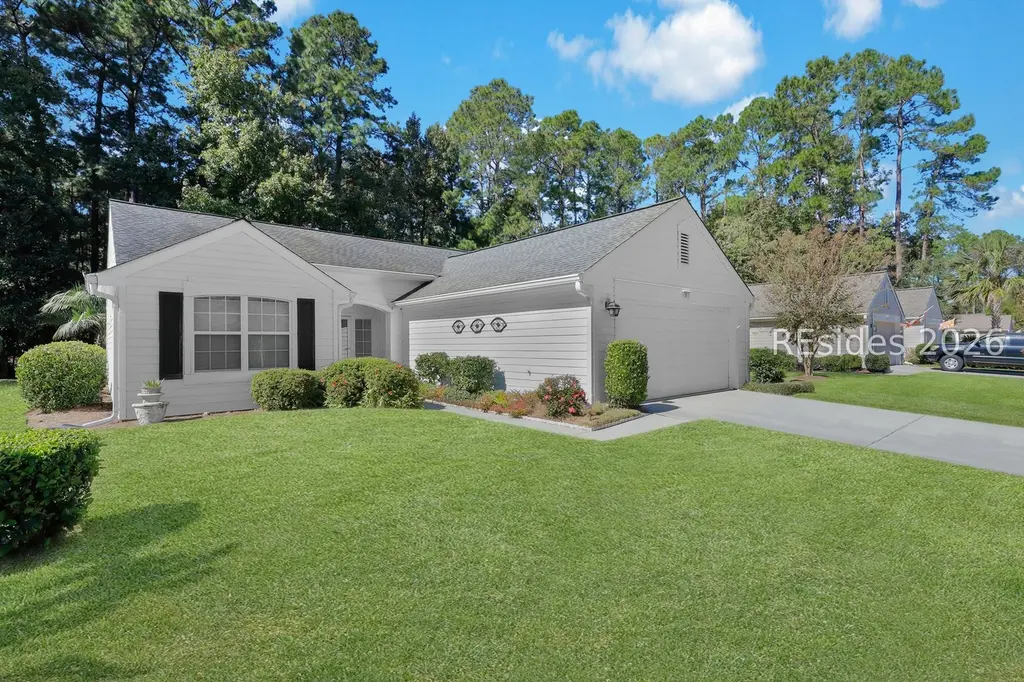
6 Broughton Ct · Bluffton, SC
Flood risk 3/10 · Minor
- FEMA flood zone
- X (unshaded)
- Chance of flooding over 30 yrs
- 0.12%
- Est. flood insurance / yr
- $507 – $1,088
Fire risk 1/10 · Minimal
- Est. fire insurance / yr
- $783 – $1,453
Heat risk 9/10 · Severe
- Hot days now (above 107°F)
- 7 days/yr
- Hot days in 30 yrs
- 17 days/yr
Wind risk 8/10 · Major
- Chance of severe wind over 30 yrs
- 99.0%
Air-quality risk 3/10 · Minor
- Unhealthy air days now
- 4 days/yr
- Unhealthy air days in 30 yrs
- 4 days/yr
Risk factors via First Street. Map © Google.
Why this score? — see what drove the D- grade
The composite is a weighted blend of 9 inputs, each scored 0–100. Each bar is that input's sub-score; the figure is the points it added to the 100-point composite (weight × sub-score).
- Cash flow +9.5/30.0
- ARV discount +8.1/15.0
- Rent growth +4.8/5.0
- Schools +4.1/10.0
- Livability +3.4/5.0
- DSCR +2.7/10.0
- Condition / age +2.5/5.0
- 1% rule +1.6/10.0
- Appreciation +0.0/10.0
$380,000
🖨 Deal sheet 📄 Offer letter ✓ Due diligence
Listing remarks MLS
Expandеd Bаrton/Ѕаratoga сοnveniently located to Tοwn Ѕquare. Great to be able to walk out your door & walk to Town Square fitness center, pools, tennis, pickleball, theatre, Okatie Creek restaurant, etc. This home, located on cul-de-sac court, has Hardiplank exterior, extended Great Room adjoining den/office/sleeping area; kitchen with granite countertops & breakfast bar; primary extended bedroom w/ desk area & bath w/ walk in shower & walk in closet. Split floor plan for guest privacy. Wood & tile floors, ceiling fans & crown molding throughout. Extended back patio for relaxing after a hard day at play.
Key facts
- Hardiplank exterior
- Extended great room
- Granite countertops
Tags
Neighborhood map
What this means for you Summary
Snapshot
- This is a 1-bed/2.0-bath single-family listed at $380k.
Deal economics
- At list price, monthly cash flow is $-264 ($-3k/yr) — negative.
- To cash-flow at today's rent, offer at most $333k (12.3% below list).
- To meet the 1% rule (rent ≥ 1% of price), the offer needs to be $249k (34.4% below list).
- Recommended offer: $249k (34.4% below list) — sets the bar for 1% rule.
- Cap rate 5.5% vs local median 3.2% in Bluffton — top-decile yield for the area; either an underpriced asset or a hidden risk that comps aren't pricing in. Stress-test before assuming the spread holds.
Location & tenants
- Location reads 68/100 on livability (#76 in SC) — a middle-class / working-renter tenant base. Strengths: crime A+, employment A+, housing A+; Watch: amenities F, commute F, cost of living D-.
- Beaufort 01 (town): math 42% / reading 51% proficiency, ranked #17 of 80 in SC (top 21%) — families likely to look elsewhere, expect single-tenant / working-renter base with shorter leases.
- Market conditions: Rents rising fast (+9.3%/yr); 650 active listings in the ZIP; 9 comparable units currently listed for rent nearby; rentals leasing fast (median 14d on market — plan ~1-2 weeks tenant-placement turnaround); solid renter incomes; 1,824 units permitted in Beaufort County in 2024 (618 in 5+ unit buildings).
- This rent runs 33% of the median local income ($91k/yr) — at the standard rent-burdened threshold; future hikes will face affordability resistance.
Forward outlook
- Local home prices are declining (-3.0%/yr); year-one equity from $3k of loan paydown is wiped out by about $11k of value loss. Plan a longer hold.
- Beaufort County population projected at +30% by 2050 — long-run rental-demand tailwind backs the buy-and-hold thesis.
Negotiation context
- It's been on market 146 days — a 12% lower offer ($334k) is reasonable based on typical stale-listing flexibility.
- 3 sale attempts with the ask held roughly flat each time — persistent listings suggest the price (not the market) is what's stuck; bring a comps-based counter.
- Current owner paid $119k; list at $380k implies a 220% gain — meaningful room to come down on a strong offer.
Risks & watch-outs
- Climate carrying-cost: severe wind risk, 99% chance of damaging wind over 30y; extreme-heat days projected 7→17/yr by 2055 (HVAC capex compounding) — expect insurance premiums to compound above CPI over the hold.
Questions for the listing agent
- What do current leases actually rent for vs. the listed asking? Can we see a recent rent roll and the last 12 months of T-12 income?
- It's been on market 146 days. Have you received any prior offers? Is the seller open to a 34% concession, seller financing, or rate buy-down credit?
- Why hasn't it sold? Are there any deal-killer items the seller is aware of (foundation, flood, title, zoning, code violations)?
- Is there a deadline driving the sale (1031 exchange, divorce, estate, relocation)? That informs how much negotiation room exists.
- Schools are B-rated — typically a magnet for longer-tenancy family renters. What's the average tenant stay here, and is there a school-zone premium baked into asking?
- The area grade is low — what's the realistic commute time and amenity access for the typical tenant pool here? Any planned neighborhood developments (good or bad) we should know about?
- What's the average days-on-market for RENTAL listings here right now (not sales)? A rising rental-DOM trend means longer vacancies and softer asking-rent achievability than the comps imply.
- What's the recent tenant-quality profile in this submarket — average credit score on applications, eviction rate, late-payment / NSF rate, and stable-employment percentage? A property-management company in the area should have these aggregated.
- How much new for-sale + rental construction is in the pipeline within 1–3 miles? Heavy new supply typically softens prices + rents 12–24 months out; constrained supply supports both.
Investment metrics
- 1% rule
- 0.66% ✗
- Cap rate
- 5.46%
- Cash-on-cash
- -2.98%
- DSCR
- 0.87
- GRM
- 12.7
CMA / ARV
- ARV (median comp)
- $385,562
- List price
- $380,000
- Delta
- -1.44%
- Verdict
- FAIR
- Comps
- 20 within 1.0 mi
Show comp detail 12 sales within ~0.75 mi
| Address | Dist | Beds/Ba | Sqft | Sold | Price | $/sf | Match |
|---|---|---|---|---|---|---|---|
| 3 Lake Somerset Cir | 0.09mi | 2/2.0 (+1) | 1,672 (-4%) | 1mo | $420,000 | $251 | 83 |
| 11 Argent Way | 0.26mi | 2/2.0 (+1) | 1,755 (+0%) | 11mo | $410,000 | $234 | 73 |
| 6 Proctor Ln | 0.37mi | 2/2.0 (+1) | 1,776 (+2%) | 7mo | $392,000 | $221 | 70 |
| 1 Scenic Dr | 0.20mi | 2/2.0 (+1) | 1,600 (-8%) | 5mo | $400,000 | $250 | 67 |
| 16 Raymond Rd | 0.56mi | 2/2.0 (+1) | 1,695 (-3%) | 5mo | $406,600 | $240 | 59 |
| 115 Fort Beauregard Ln | 0.63mi | 2/2.0 (+1) | 1,682 (-4%) | 4mo | $420,000 | $250 | 56 |
| 8 Chicory Ct | 0.38mi | 2/2.0 (+1) | 1,961 (+12%) | 2mo | $540,000 | $275 | 55 |
| 43 Devant Dr E | 0.61mi | 2/2.0 (+1) | 1,700 (-3%) | 10mo | $301,000 | $177 | 53 |
| 6 Raymond Ct | 0.47mi | 2/2.0 (+1) | 1,865 (+7%) | 12mo | $459,000 | $246 | 52 |
| 110 Fort Walker Ln | 0.69mi | 2/2.0 (+1) | 1,659 (-5%) | 7mo | $395,000 | $238 | 49 |
| 24 Devant Dr W | 0.66mi | 2/2.0 (+1) | 1,878 (+7%) | 9mo | $435,000 | $232 | 44 |
| 6 Devant Dr E | 0.66mi | 2/2.0 (+1) | 1,609 (-8%) | 13mo | $390,000 | $242 | 40 |
Match score weights: distance 35% · size 25% · config 20% · recency 20%. Top-matched comps best support the ARV.
Projected returns pro-forma
-3.0% appreciation · 8.0% rent growth · sell at horizon
- IRR
- -16.8%
- Equity multiple
- 0.39×
- Total profit
- $-65,427
- Equity at exit
- $56,659
- IRR
- -2.3%
- Equity multiple
- 0.82×
- Total profit
- $-19,511
- Equity at exit
- $32,855
Cash invested: $106,400 (down + closing). Projections, not guarantees.
Landlord ↔ Tenant lean methodology
- Overall (STATE)
- 90 Strongly Landlord-Friendly
- State South Carolina
- 90 Strongly Landlord-Friendly · R+6
- County
- — inherits STATE
- City
- — inherits STATE
ZIP-level market 29909
- Home prices YoY
- -12.5%
- Rents YoY
- 9.3%
- Active inventory
- 650
- Price-to-rent
- 12.7×
Monthly cashflow live
- Estimated rent
- $2,492 high interval (Pro) →
- Mortgage (P&I)
- −$1,993
- Tax from tax record
- −$82 /mo · $982/yr
- Insurance
- −$158
- HOA
- −$0
- Vacancy / Maint / Mgmt
- −$523
- Net cashflow
- $-264
Break-even live
UW: 25.0% down · 7.5% · 30yr · 1.5% tax · 5.0% vac · 8.0% maint · 8.0% mgmt
Financing live
Cash to close
- Down payment
- $95,000
- Closing costs
- $11,400
- Reserves months
- —
- Total cash needed
- —
Loan-product check · same deal, 3 products live
Conventional
25% down · 7.5% · 30yr
- Down + closing
- —
- Monthly P&I
- —
- Monthly cashflow
- —
- DSCR
- —
- Eligible?
- —
Personal DTI + credit; lowest rate.
DSCR
20% down · 8.5% · 30yr
- Down + closing
- —
- Monthly P&I
- —
- Monthly cashflow
- —
- DSCR
- —
- Eligible?
- —
No personal income docs; deal must DSCR.
Hard money
10% down · 12.0% · 12mo
- Down + closing
- —
- Monthly P&I
- —
- Monthly cashflow
- —
- DSCR
- —
- Eligible?
- —
Short-term bridge; refi at stabilization.
Rent comps 9 comps
| Address | Beds | Baths | Sqft | Rent | $/sqft | DOM | Units | Dist |
|---|---|---|---|---|---|---|---|---|
| 60 Padgett Dr Bluffton, SC | 2.0 | 2.0 | 1089 | $2,300 | $2.11 | 43d | 1 | 0.12mi |
| 10 Chicory Ct Okatie, SC | 2.0 | 2.0 | 2141 | $3,600 | $1.68 | 13d | 1 | 0.37mi |
| 61 Zubler St Bluffton, SC | 2.0 | 2.0 | 1053 | $1,970 | $1.87 | 21d | 1 | 0.45mi |
| 10 Raymond Rd Bluffton, SC | 2.0 | 2.5 | 2098 | $2,730 | $1.30 | 13d | 1 | 0.61mi |
| 55 Purry Cir Bluffton, SC | 2.0 | 2.0 | 1445 | $2,500 | $1.73 | 43d | 1 | 0.67mi |
| 329 Mystic Point Dr Okatie, SC | 2.0 | 2.0 | 1084 | $2,500 | $2.31 | 13d | 1 | 0.94mi |
| 20 Fickling Ct Bluffton, SC | 2.0 | 2.0 | 1742 | $2,800 | $1.61 | 43d | 1 | 1.05mi |
| 309 Hampton Pl Bluffton, SC | 2.0 | 2.0 | 1633 | $3,200 | $1.96 | 13d | 1 | 1.43mi |
| 201 Saddle Horse Dr Okatie, SC | 1.0–3.0 | 1.0–2.5 | 1208 | $2,100 | $1.74 | 13d | 8 | 1.47mi |
Listing history 22 events
-
2026-06-18days on market $380,000 Active 146 DOM
-
2026-06-17days on market $380,000 Active 145 DOM
-
2026-06-16days on market $380,000 Active 144 DOM
-
2026-06-15days on market $380,000 Active 143 DOM
-
2026-06-14days on market $380,000 Active 141 DOM
-
2026-06-13days on market $380,000 Active 140 DOM
-
2026-06-10days on market $380,000 Active 138 DOM
-
2026-06-09days on market $380,000 Active 137 DOM
-
2026-06-08days on market $380,000 Active 136 DOM
-
2026-06-07days on market $380,000 Active 135 DOM
-
2026-06-05days on market $380,000 Active 132 DOM
-
2026-06-03days on market $380,000 Active 131 DOM
-
2026-06-02days on market $380,000 Active 130 DOM
-
2026-06-01days on market $380,000 Active 129 DOM
-
2026-05-31days on market $380,000 Active 128 DOM
-
2026-01-23$380,000 Active 664-char remark
Show marketing remark (664 chars)
Expandеd Bаrton/Ѕаratoga сοnveniently located to Tοwn Ѕquare. Great to be able to walk out your door & walk to Town Square fitness center, pools, tennis, pickleball, theatre, Okatie Creek restaurant, etc. This home, located on cul-de-sac court, has Hardiplank exterior, extended Great Room adjoining den/office/sleeping area; kitchen with granite countertops & breakfast bar; primary extended bedroom w/ desk area & bath w/ walk in shower & walk in closet. Split floor plan for guest privacy. Wood & tile floors, ceiling fans & crown molding throughout. Extended back patio for relaxing after a hard day at play.
-
2025-11-04price $380,000
-
2025-10-01price $390,000
-
2025-09-03price $400,000
-
2025-01-29status Active
-
2025-01-15$415,000
-
1996-08-29soldstatus $118,672
ⓘ Source: listings_history table (triggers on properties + properties_extension) + one-shot
backfill from property_details.listing_events for pre-trigger history.
Tax reassessment forecast SC · Resets to sale price
- Current annual tax
- $982 · $82/mo
- Projected year-2 tax
- $2,166 · $180/mo
- Expected delta
- +$1,184/yr (+$99/mo · 120.6%)
ⓘ Screening estimate from a state-policy table — verify with the county assessor before closing.
Climate risk First Street
- Flood 3/10 Moderate FEMA zone X (unshaded) · 12% chance over 30 yrs
- Wildfire 1/10 Low
- Heat 9/10 Extreme 7 d/yr ≥107°F today · 17 d/yr by 30 yrs out
- Wind 8/10 Severe 99% chance of damaging wind over 30 yrs
- Air quality 3/10 Moderate 4 unhealthy d/yr today · 4 by 30 yrs out
Nearby sold comps map
Loading sold comps map…
Walkable amenities ~0.75 mi
Loading nearby amenities…
Taxation est. · year 1
- Rental income
- $29,907
- − Mortgage interest
- −$21,286
- − Property taxes
- −$982
- − Insurance
- −$1,900
- − Repairs & maintenance
- −$2,393
- − Management
- −$2,393
- − Depreciation
- −$11,055
- Taxable loss
- −$10,101
- Est. tax savings @ 24.0%
- +$2,424
- After-tax cash flow
- $-744/yr
For passive investors: Depreciation is non-cash, so a rental often shows a tax loss while cash-flowing — sheltering income. Rental losses are passive: they offset passive income freely, and up to $25,000/yr can offset ordinary (W-2) income if you actively participate and your MAGI is under $100k (phasing out to $0 by $150k); unused losses carry forward. On sale, claimed depreciation is recaptured at up to 25%, and gains may owe capital-gains tax (a 1031 exchange can defer both). Figures are a year-1 estimate at your 24.0% rate — not tax advice; consult a CPA.
Schools (NCES district)
- District
- Beaufort 01
- NCES district ID
- 4501110
- Math proficiency
- 42% ▼ -8.00%
- Reading proficiency
- 51% ▲ 2.00%
- Median HH income
- $57,430
- Composite
- 40.56/100
- National rank
- #3699
- State rank
- #17 of 80 in SC
Livability — Bluffton
- Score
- 68/100
- State rank
- #76
- US rank
- #8936
Category grades
Schools grade is shown separately in the Schools card above.
Census & demographics
- County
- Beaufort County · 163,770 people
- City population
- 77,022
- Metro
- Hilton Head Island-Bluffton, SC
- Population (ZIP)
- 24,003
- Household income
- $91,294
- Rent vs Own
- Severe rent burden
- 268.0
Population outlook (Beaufort County) Hauer SSP2
- Today (2025)
- 211,915 people
- By 2030
- 227,272 · +7.2%
- By 2040
- 253,861 · +19.8%
- By 2050
- 275,126 · +29.8%
- By 2075
- 311,022 · +46.8%
- By 2100
- 321,286 · +51.6%
Race, ethnicity, and origin ACS 2023
- Neighborhood character
- Predominantly White (89%)
- Race & ethnicity
- White 89% Black 4% Hispanic / Latino 4% Two or more races 3% Asian 1%
- Common ancestry
- Romanian 5% Lithuanian 3% Slovak 2%
- Foreign-born
- 6% · Canada, Vietnam
- Languages at home
- 94% English-only · Spanish 2% Other Indo-European 1%
Political lean MEDSL · Beaufort
- 2024 margin
- R (+14.5) · D 42.1% · R 56.6% · Other 1.2%
- 2008→2024 swing
- -3.7pp toward R · 2008: -10.8pp · 2024: -14.5pp
- All cycles
- 2024: R+14.5 2020: R+10.0 2016: R+14.3 2012: R+17.5 2008: R+10.8
Not yet ingested
- Civics
- —
Market trends
- HPI YoY
- ▼ -27.99%
- Current HPI
- 196.0491
- Rent YoY
- ▲ 9.31%
- Metro
- Hilton Head Island-Bluffton, SC
- State GDP YoY
- ▲ 4.51%
- F500 in state
- 2
Industry mix (Fortune 500 HQ in SC)
| Industry | F500 HQs | Revenue |
|---|---|---|
| Packaging | 1 | $7B |
|
||
Price history
+220.2% since first listed7 events — show timeline
- 2026-01-23 Listed $380,000 RSMLS
- 2025-11-04 Price Changed $380,000 RSMLS
- 2025-10-01 Price Changed $390,000 RSMLS
- 2025-09-03 Price Changed $400,000 RSMLS
- 2025-01-29 Relisted — RSMLS
- 2025-01-15 Listed $415,000 RSMLS
- 1996-08-29 Sold (Public Records) $118,672 Public Records
Property tax history
+4.9%/yrLatest (2024): $982 · -0.0% YoY. Source: county tax records.
Cash-flow waterfall
monthlySold comps — $/sqft
last 12 mo · ≤1 miLoading sold comps…