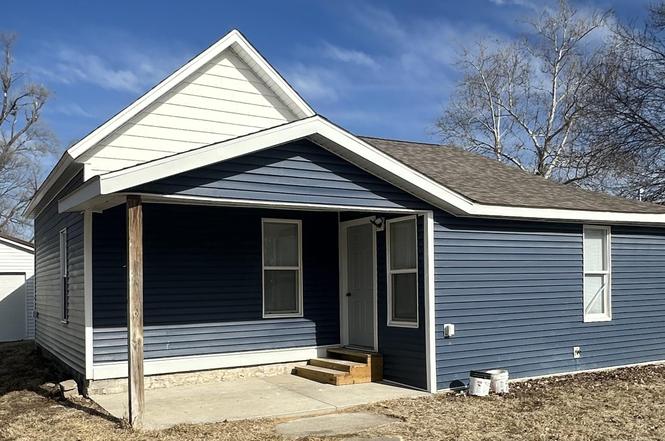
306 N 1st St E · Delta, IA
Flood risk 1/10 · Minimal
- FEMA flood zone
- X (unshaded)
- Chance of flooding over 30 yrs
- 0.0%
- Est. flood insurance / yr
- $507 – $1,088
Fire risk 1/10 · Minimal
- Est. fire insurance / yr
- $902 – $1,676
Heat risk 3/10 · Minor
- Hot days now (above 105°F)
- 7 days/yr
- Hot days in 30 yrs
- 15 days/yr
Wind risk 2/10 · Minimal
- Chance of severe wind over 30 yrs
- —
Air-quality risk 2/10 · Minimal
- Unhealthy air days now
- 1 days/yr
- Unhealthy air days in 30 yrs
- 2 days/yr
Risk factors via First Street. Map © Google.
Why this score? — see what drove the B grade
The composite is a weighted blend of 9 inputs, each scored 0–100. Each bar is that input's sub-score; the figure is the points it added to the 100-point composite (weight × sub-score).
- Cash flow +26.6/30.0
- DSCR +9.1/10.0
- ARV discount +7.6/15.0
- Appreciation +7.3/10.0
- 1% rule +6.3/10.0
- Schools +6.1/10.0
- Livability +3.0/5.0
- Rent growth +2.5/5.0
- Condition / age +2.5/5.0
$88,888
🖨 Deal sheet (PDF) 📄 Offer letter ✓ Due diligence
Listing remarks
Two Bedroom and One Bathroom Ranch home with one car detached garage. Remodeled top to bottom 2025.
Key facts
- 7,841 sq ft lot
- Garage
- Built 1875
Neighborhood map
What this means for you Summary
Snapshot
- This is a 2-bed/1.0-bath single-family listed at $89k.
Deal economics
- At list price, monthly cash flow is $239 ($3k/yr) — positive.
- The deal already cash-flows at list — no discount required.
- Meets the 1% rule at list price ($1k rent vs $89k).
- Recommended offer: $84k (6.0% below list) — sets the bar for market timing.
Location & tenants
- Location reads 59/100 on livability (#865 in IA) — a working-class tenant base; expect higher turnover. Strengths: cost of living A+, housing A+; Watch: crime D+, health & safety D, schools F.
- Sigourney Community School District (rural): math 76% / reading 68% proficiency, ranked #122 of 289 in IA (top 42%) — strong family-tenant draw, lease renewals of 3-5y typical.
- Market conditions: 3 active listings in the ZIP; 1 units permitted in Keokuk County in 2024 (0 in 5+ unit buildings).
Forward outlook
- In year one you build about $5k of equity ($615 loan paydown + $4k appreciation (4.6% local appreciation)).
- Keokuk County population projected at -24% by 2050 — secular population decline; favor cash flow + early exit over multi-decade hold.
- At projected returns (4.6% appreciation + 3.0% rent growth), your $25k cash investment doubles in ~4 years — after that, you're playing with house money.
- By year 8, paydown + projected appreciation supports a ~$35k cash-out refi (75% LTV) — recoverable capital for the next deal without selling this one.
Negotiation context
- It's been on market 69 days — a 6% lower offer ($84k) is reasonable based on typical stale-listing flexibility.
- Current owner paid $25k; list at $89k implies a 256% gain — meaningful room to come down on a strong offer.
Risks & watch-outs
- Watch-outs: built in 1875 — expect roof / HVAC / electrical / plumbing capex.
Questions for the listing agent
- It's been on market 69 days. Have you received any prior offers? Is the seller open to a 6% concession, seller financing, or rate buy-down credit?
- Built in 1875 — when were the roof, HVAC, electrical panel, plumbing, and water heater last replaced?
- Why hasn't it sold? Are there any deal-killer items the seller is aware of (foundation, flood, title, zoning, code violations)?
- Is there a deadline driving the sale (1031 exchange, divorce, estate, relocation)? That informs how much negotiation room exists.
- Schools are F-rated, which usually means shorter tenancies and higher turnover. Who's the typical renter profile here, and what's been the actual vacancy rate?
- Crime grade is D in this area — have there been break-ins, vandalism, or insurance claims at this property in the last 3 years? What carrier currently insures it and at what premium?
- What's the average days-on-market for RENTAL listings here right now (not sales)? A rising rental-DOM trend means longer vacancies and softer asking-rent achievability than the comps imply.
- What's the recent tenant-quality profile in this submarket — average credit score on applications, eviction rate, late-payment / NSF rate, and stable-employment percentage? A property-management company in the area should have these aggregated.
- How much new for-sale + rental construction is in the pipeline within 1–3 miles? Heavy new supply typically softens prices + rents 12–24 months out; constrained supply supports both.
Investment metrics
- 1% rule
- 1.13% ✓
- Cap rate
- 9.52%
- Cash-on-cash
- 11.52%
- DSCR
- 1.51
- GRM
- 7.4
CMA / ARV
- ARV (on-the-fly)
- $89,012
- Comps found
- 2
Show comp detail 2 sales within ~0.75 mi
| Address | Dist | Beds/Ba | Sqft | Sold | Price | $/sf | Match |
|---|---|---|---|---|---|---|---|
| 306 N 1st St E | 0.00mi | 2/1.0 | 1,156 (0%) | 1mo | $88,888 | $77 | 100 |
| 207 East St | 0.12mi | 2/1.0 | 1,192 (+3%) | 8mo | $57,500 | $48 | 83 |
Match score weights: distance 35% · size 25% · config 20% · recency 20%. Top-matched comps best support the ARV.
Projected returns pro-forma
4.58% appreciation · 3.0% rent growth · sell at horizon
- IRR
- 21.9%
- Equity multiple
- 2.35×
- Total profit
- $33,555
- Equity at exit
- $48,108
- IRR
- 21.7%
- Equity multiple
- 4.59×
- Total profit
- $89,312
- Equity at exit
- $81,213
Cash invested: $24,889 (down + closing). Projections, not guarantees.
Landlord ↔ Tenant lean methodology
- Overall (STATE)
- 83 Strongly Landlord-Friendly
- State Iowa
- 83 Strongly Landlord-Friendly · R+6
- County
- — inherits STATE
- City
- — inherits STATE
ZIP-level market 52550
- Home prices YoY
- 5.2%
- Active inventory
- 3
- Price-to-rent
- 7.4×
Monthly cashflow live
- Estimated rent
- $1,003 medium interval (Pro) →
- Mortgage (P&I)
- −$466
- Tax from tax record
- −$50 /mo · $606/yr
- Insurance
- −$37
- HOA
- −$0
- Vacancy / Maint / Mgmt
- −$211
- Net cashflow
- $239
Break-even live
Sensitivity live
| Price | -10% $289 | -5% $264 | +0% $239 | +5% $214 | +10% $189 |
|---|---|---|---|---|---|
| Rent | -10% $160 | -5% $199 | +0% $239 | +5% $279 | +10% $318 |
| Rate | -1.0pp $284 | -0.5pp $262 | base $239 | +0.5pp $216 | +1.0pp $192 |
UW: 25.0% down · 7.5% · 30yr · 1.5% tax · 5.0% vac · 8.0% maint · 8.0% mgmt
Financing live
Cash to close
- Down payment
- $22,222
- Closing costs
- $2,667
- Reserves months
- —
- Total cash needed
- —
Loan-product check · same deal, 3 products live
Conventional
25% down · 7.5% · 30yr
- Down + closing
- —
- Monthly P&I
- —
- Monthly cashflow
- —
- DSCR
- —
- Eligible?
- —
Personal DTI + credit; lowest rate.
DSCR
20% down · 8.5% · 30yr
- Down + closing
- —
- Monthly P&I
- —
- Monthly cashflow
- —
- DSCR
- —
- Eligible?
- —
No personal income docs; deal must DSCR.
Hard money
10% down · 12.0% · 12mo
- Down + closing
- —
- Monthly P&I
- —
- Monthly cashflow
- —
- DSCR
- —
- Eligible?
- —
Short-term bridge; refi at stabilization.
Listing history 4 events
-
2026-04-21status Pending
-
2026-04-03price $88,888
-
2026-02-11$99,000 Active
-
2013-07-09soldstatus $25,000
ⓘ Source: listings_history table (triggers on properties + properties_extension) + one-shot
backfill from property_details.listing_events for pre-trigger history.
Tax reassessment forecast IA · Partial reset (capped growth)
- Current annual tax
- $606 · $50/mo
- Projected year-2 tax
- $1,001 · $83/mo
- Expected delta
- +$395/yr (+$33/mo · 65.1%)
ⓘ Screening estimate from a state-policy table — verify with the county assessor before closing.
Climate risk First Street
- Flood 1/10 Low FEMA zone X (unshaded) · 0% chance over 30 yrs
- Wildfire 1/10 Low
- Heat 3/10 Moderate 7 d/yr ≥105°F today · 15 d/yr by 30 yrs out
- Wind 2/10 Low
- Air quality 2/10 Low 1 unhealthy d/yr today · 2 by 30 yrs out
Nearby sold comps map
Loading sold comps map…
Walkable amenities ~0.75 mi
Loading nearby amenities…
Taxation est. · year 1
- Rental income
- $12,040
- − Mortgage interest
- −$4,979
- − Property taxes
- −$606
- − Insurance
- −$444
- − Repairs & maintenance
- −$963
- − Management
- −$963
- − Depreciation
- −$2,586
- Taxable income
- $1,498
- Est. tax owed @ 24.0%
- −$360
- After-tax cash flow
- $2,508/yr
For passive investors: Depreciation is non-cash, so a rental often shows a tax loss while cash-flowing — sheltering income. Rental losses are passive: they offset passive income freely, and up to $25,000/yr can offset ordinary (W-2) income if you actively participate and your MAGI is under $100k (phasing out to $0 by $150k); unused losses carry forward. On sale, claimed depreciation is recaptured at up to 25%, and gains may owe capital-gains tax (a 1031 exchange can defer both). Figures are a year-1 estimate at your 24.0% rate — not tax advice; consult a CPA.
Schools (NCES district)
- District
- Sigourney Community School District
- NCES district ID
- 1926280
- Math proficiency
- 76% ▼ -7.00%
- Reading proficiency
- 68% ▼ -9.00%
- Median HH income
- $44,250
- Composite
- 60.52/100
- National rank
- #840
- State rank
- #122 of 289 in IA
Livability — Delta
- Score
- 59/100
- State rank
- #865
- US rank
- #20132
Category grades
Schools grade is shown separately in the Schools card above.
Census & demographics
- Census place
- Delta, IA
- Population (ZIP)
- 635
Population outlook (Keokuk County) Hauer SSP2
- Today (2025)
- 9,354 people
- By 2030
- 8,885 · -5.0%
- By 2040
- 7,956 · -14.9%
- By 2050
- 7,123 · -23.9%
- By 2075
- 5,777 · -38.2%
- By 2100
- 4,808 · -48.6%
Race, ethnicity, and origin ACS 2023
- Neighborhood character
- Predominantly White (92%)
- Race & ethnicity
- White 92% Hispanic / Latino 3% Two or more races 3%
- Common ancestry
- Lithuanian 5% Iranian 3% Slovak 3%
- Foreign-born
- 3% · Canada
- Languages at home
- 96% English-only · Spanish 4%
Political lean MEDSL · Keokuk
- 2024 margin
- Solid R (+51.5) · D 23.7% · R 75.2% · Other 1.1%
- 2008→2024 swing
- -47.9pp toward R · 2008: -3.6pp · 2024: -51.5pp
- All cycles
- 2024: R+51.5 2020: R+44.9 2016: R+43.6 2012: R+10.4 2008: R+3.6
Not yet ingested
- Civics
- —
Market trends
- HPI YoY
- ▲ 4.58%
- Current HPI
- 93.0787
- Rent YoY
- —
- Metro
- —
- State GDP YoY
- ▲ 2.48%
- F500 in state
- 4
Industry mix (Fortune 500 HQ in IA)
| Industry | F500 HQs | Revenue |
|---|---|---|
| Financial Services | 1 | $16B |
|
||
| Retail / Convenience | 1 | $15B |
|
||
Price history
+255.6% since first listed4 events — show timeline
- 2026-04-21 Pending — IAR
- 2026-04-03 Price Changed $88,888 IAR
- 2026-02-11 Listed $99,000 IAR
- 2013-07-09 Sold (Public Records) $25,000 Public Records
Property tax history
+6.6%/yrLatest (2025): $606 · -1.9% YoY. Source: county tax records.
Cash-flow waterfall
monthlySold comps — $/sqft
last 12 mo · ≤1 miLoading sold comps…