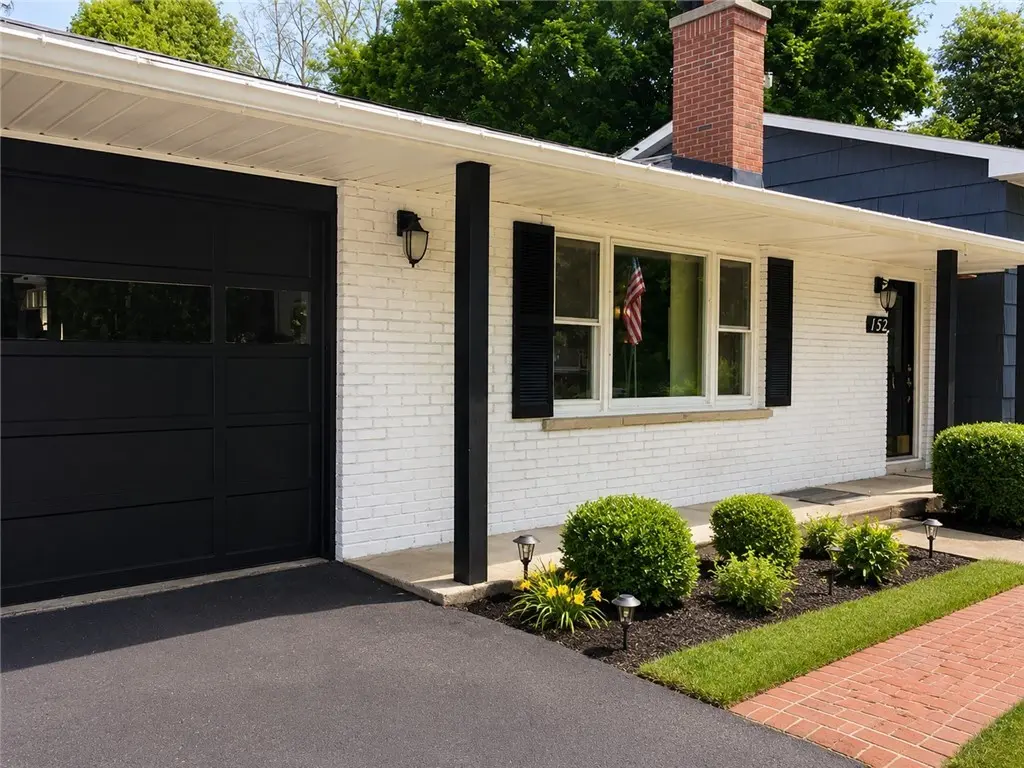
152 Berkshire Dr · Greece, NY
Flood risk 1/10 · Minimal
- FEMA flood zone
- X (unshaded)
- Chance of flooding over 30 yrs
- 0.0%
- Est. flood insurance / yr
- $473 – $860
Fire risk 1/10 · Minimal
- Est. fire insurance / yr
- $691 – $1,283
Heat risk 2/10 · Minimal
- Hot days now (above 96°F)
- 7 days/yr
- Hot days in 30 yrs
- 15 days/yr
Wind risk 1/10 · Minimal
- Chance of severe wind over 30 yrs
- —
Air-quality risk 2/10 · Minimal
- Unhealthy air days now
- 1 days/yr
- Unhealthy air days in 30 yrs
- 2 days/yr
Risk factors via First Street. Map © Google.
Why this score? — see what drove the C+ grade
The composite is a weighted blend of 9 inputs, each scored 0–100. Each bar is that input's sub-score; the figure is the points it added to the 100-point composite (weight × sub-score).
- Cash flow +20.6/30.0
- ARV discount +15.0/15.0
- DSCR +6.6/10.0
- 1% rule +6.5/10.0
- Livability +4.0/5.0
- Schools +3.2/10.0
- Rent growth +3.1/5.0
- Condition / age +2.5/5.0
- Appreciation +0.0/10.0
$209,900
🖨 Deal sheet (PDF) 📄 Offer letter ✓ Due diligence
Listing remarks
Charming home with smart updates and a fantastic location. Enjoy peace of mind with newer mechanicals, a brand-new roof, and newer energy efficient windows. Inside, tasteful decor and a thoughtful layout create a warm, move-in ready feel. Outside, a large back yard offers plenty of space to play, for gardening and entertaining. Custom built covered pergola on paver patio. Minutes to shopping, dining, parks, schools and major routes- close to everything you need. This is the perfect blend of comfort, convenience and style. Open house 06/13/26 11:30am-1:00 PM AND 06/14/26 11:30AM-1:00 PM. Delayed negotiations until June 15th at noon. Disclaimer: Some listing photos have been AI-edited for mar
Key facts
- Brand-new roof
- Large back yard
- Newer mechanicals
Tags
Property features AI
Exterior
- Parking: Attached garage (1 car)
- Utilities: Public water connected; Sewer connected; Electricity connected (circuit breakers); Cable available
- Home design: Single-story home; Existing construction; Facing direction not specified
- Construction: Brick and cedar construction; Asphalt roof; Block foundation; Below-grade finished area present
- Exterior features: Blacktop driveway; Patio; Open porch; Shed(s)/storage
Interior
- Kitchen: Gas oven; Gas range; Microwave; Dishwasher; Disposal; Refrigerator
- Bedrooms: Total of 6 rooms including living and recreation areas (bedroom count not specified)
- Flooring: Ceramic tile; Hardwood; Laminate; Varied flooring
- Bathrooms: 1 full bathroom; 1 half bathroom
- Heating & cooling: Gas forced-air heating; Central air conditioning
- Interior features: Separate formal dining room; Separate formal living room; Partially finished basement
- Laundry & utility: Washer; Dryer; Gas water heater
Neighborhood map
What this means for you Summary
Snapshot
- This is a 3-bed/1.5-bath single-family listed at $210k.
Deal economics
- At list price, monthly cash flow is $282 ($3k/yr) — positive.
- The deal already cash-flows at list — no discount required.
- Meets the 1% rule at list price ($2k rent vs $210k).
- Cap rate 7.9% vs local median 3.7% in Greece — top-decile yield for the area; either an underpriced asset or a hidden risk that comps aren't pricing in. Stress-test before assuming the spread holds.
Location & tenants
- Location reads 79/100 on livability (#145 in NY, #2,223 nationally) — a middle-class / working-renter tenant base. Strengths: commute A+, housing A+, health & safety A+; Watch: schools D-, crime D-.
- Greece Central School District (suburban): math 35% / reading 39% proficiency, ranked #544 of 590 in NY (top 92%) — families likely to look elsewhere, expect single-tenant / working-renter base with shorter leases.
- Market conditions: Rents rising (+2.5%/yr); 126 active listings in the ZIP; 3 comparable units currently listed for rent nearby; rentals leasing fast (median 4d on market — plan ~1-2 weeks tenant-placement turnaround); solid renter incomes; 1,169 units permitted in Monroe County in 2024 (591 in 5+ unit buildings).
- This rent runs 37% of the median local income ($78k/yr) — at the standard rent-burdened threshold; future hikes will face affordability resistance.
Forward outlook
- Local home prices are declining (-3.0%/yr); year-one equity from $1k of loan paydown is wiped out by about $6k of value loss. Plan a longer hold.
- Monroe County population projected to shrink 6% by 2050 — rents likely to lag national; underwrite the cash flow, not the appreciation.
Negotiation context
- Only 9 days on market — expect competitive offers; lowballing is unlikely to land.
- 8 sale attempts since 12y ago with the ask held roughly flat each time — persistent listings suggest the price (not the market) is what's stuck; bring a comps-based counter.
- Current owner paid $104k; list at $210k implies a 103% gain — meaningful room to come down on a strong offer.
Risks & watch-outs
- Watch-outs: property tax is 2.5% of price.
Questions for the listing agent
- Built in 1962 — when were the roof, HVAC, electrical panel, plumbing, and water heater last replaced?
- Property tax is high relative to price — has the assessment been appealed recently, and will the sale trigger a re-assessment?
- Is there a deadline driving the sale (1031 exchange, divorce, estate, relocation)? That informs how much negotiation room exists.
- Schools are D-rated, which usually means shorter tenancies and higher turnover. Who's the typical renter profile here, and what's been the actual vacancy rate?
- Crime grade is D in this area — have there been break-ins, vandalism, or insurance claims at this property in the last 3 years? What carrier currently insures it and at what premium?
- What's the average days-on-market for RENTAL listings here right now (not sales)? A rising rental-DOM trend means longer vacancies and softer asking-rent achievability than the comps imply.
- What's the recent tenant-quality profile in this submarket — average credit score on applications, eviction rate, late-payment / NSF rate, and stable-employment percentage? A property-management company in the area should have these aggregated.
- How much new for-sale + rental construction is in the pipeline within 1–3 miles? Heavy new supply typically softens prices + rents 12–24 months out; constrained supply supports both.
Investment metrics
- 1% rule
- 1.15% ✓
- Cap rate
- 7.91%
- Cash-on-cash
- 5.76%
- DSCR
- 1.26
- GRM
- 7.2
CMA / ARV
- ARV (on-the-fly)
- $276,548
- Comps found
- 12
Show comp detail 12 sales within ~0.75 mi
| Address | Dist | Beds/Ba | Sqft | Sold | Price | $/sf | Match |
|---|---|---|---|---|---|---|---|
| 170 Elmgrove Rd | 0.20mi | 3/1.5 | 1,364 (-7%) | 3mo | $275,000 | $202 | 76 |
| 282 Straub Rd | 0.31mi | 3/1.5 | 1,385 (-6%) | 5mo | $215,000 | $155 | 71 |
| 293 Elmgrove Rd | 0.60mi | 3/2.0 | 1,390 (-6%) | 5mo | $271,000 | $195 | 56 |
| 295 Straub Rd | 0.37mi | 3/1.0 | 1,284 (-13%) | 4mo | $271,000 | $211 | 56 |
| 222 W Craig Hill Dr | 0.50mi | 3/1.0 | 1,312 (-11%) | 2mo | $242,000 | $184 | 55 |
| 3607 W Ridge Rd | 0.71mi | 3/2.0 | 1,356 (-8%) | 2mo | $250,000 | $184 | 50 |
| 169 Straub Rd | 0.64mi | 3/1.5 | 1,333 (-9%) | 6mo | $250,000 | $188 | 50 |
| 218 Ridgewood Rd | 0.72mi | 4/1.5 (+1) | 1,517 (+3%) | 9mo | $215,000 | $142 | 48 |
| 213 Pine Valley Dr | 0.62mi | 3/2.5 | 1,631 (+11%) | 8mo | $325,000 | $199 | 43 |
| 3463 W Ridge Rd | 0.74mi | 2/1.0 (-1) | 1,604 (+9%) | 3mo | $310,000 | $193 | 40 |
| 250 Ridgewood Rd | 0.71mi | 4/1.5 (+1) | 1,628 (+11%) | 8mo | $240,000 | $147 | 38 |
| 59 Winston Dr | 0.73mi | 3/1.5 | 1,680 (+14%) | 7mo | $221,525 | $132 | 36 |
Match score weights: distance 35% · size 25% · config 20% · recency 20%. Top-matched comps best support the ARV.
Projected returns pro-forma
-3.0% appreciation · 2.5% rent growth · sell at horizon
- IRR
- -7.9%
- Equity multiple
- 0.71×
- Total profit
- $-17,114
- Equity at exit
- $31,297
- IRR
- 1.0%
- Equity multiple
- 1.07×
- Total profit
- $3,904
- Equity at exit
- $18,148
Cash invested: $58,772 (down + closing). Projections, not guarantees.
Landlord ↔ Tenant lean methodology
- Overall (STATE)
- 15 Strongly Tenant-Friendly
- State New York
- 15 Strongly Tenant-Friendly · D+10
- County
- — inherits STATE
- City
- — inherits STATE
ZIP-level market 14626
- Home prices YoY
- -31.4%
- Rents YoY
- 2.5%
- Active inventory
- 126
- Price-to-rent
- 7.2×
Monthly cashflow live
- Estimated rent
- $2,423 medium interval (Pro) →
- Mortgage (P&I)
- −$1,101
- Tax from tax record
- −$444 /mo · $5,323/yr
- Insurance
- −$87
- HOA
- −$0
- Vacancy / Maint / Mgmt
- −$509
- Net cashflow
- $282
Break-even live
Sensitivity live
| Price | -10% $401 | -5% $341 | +0% $282 | +5% $223 | +10% $163 |
|---|---|---|---|---|---|
| Rent | -10% $91 | -5% $186 | +0% $282 | +5% $378 | +10% $473 |
| Rate | -1.0pp $388 | -0.5pp $335 | base $282 | +0.5pp $228 | +1.0pp $172 |
UW: 25.0% down · 7.5% · 30yr · 1.5% tax · 5.0% vac · 8.0% maint · 8.0% mgmt
Financing live
Cash to close
- Down payment
- $52,475
- Closing costs
- $6,297
- Reserves months
- —
- Total cash needed
- —
Loan-product check · same deal, 3 products live
Conventional
25% down · 7.5% · 30yr
- Down + closing
- —
- Monthly P&I
- —
- Monthly cashflow
- —
- DSCR
- —
- Eligible?
- —
Personal DTI + credit; lowest rate.
DSCR
20% down · 8.5% · 30yr
- Down + closing
- —
- Monthly P&I
- —
- Monthly cashflow
- —
- DSCR
- —
- Eligible?
- —
No personal income docs; deal must DSCR.
Hard money
10% down · 12.0% · 12mo
- Down + closing
- —
- Monthly P&I
- —
- Monthly cashflow
- —
- DSCR
- —
- Eligible?
- —
Short-term bridge; refi at stabilization.
Rent comps 3 comps
| Address | Beds | Baths | Sqft | Rent | $/sqft | DOM | Units | Dist |
|---|---|---|---|---|---|---|---|---|
| 254 W Craig Hill Dr Rochester, NY | 3.0 | 1.0 | 1042 | $2,600 | $2.50 | 3d | 1 | 0.47mi |
| 49 Lianne Dr Rochester, NY | 3.0 | 2.0 | 1281 | $2,650 | $2.07 | 3d | 1 | 1.28mi |
| 598 Bram Hall Dr Rochester, NY | 3.0 | 2.5 | 1740 | $2,750 | $1.58 | 3d | 1 | 1.37mi |
Listing history 9 events
-
2026-06-17days on market $209,900 Active 9 DOM
-
2026-06-16days on market $209,900 Active 8 DOM
-
2026-06-15days on market $209,900 Active 7 DOM
-
2026-06-13days on market $209,900 Active 5 DOM
-
2026-06-13days on market $209,900 Active 4 DOM
-
2026-06-10remarks 699-char remark
-
2026-06-10days on market $209,900 Active 2 DOM
-
2026-06-09remarks 634-char remark
-
2026-06-09$209,900 Active 1 DOM
ⓘ Source: listings_history table (triggers on properties + properties_extension) + one-shot
backfill from property_details.listing_events for pre-trigger history.
Tax reassessment forecast NY · Partial reset (capped growth)
- Current annual tax
- $5,323 · $444/mo
- Projected year-2 tax
- $5,323 · $444/mo
- Expected delta
- $0/yr ($0/mo · 0.0%)
ⓘ Screening estimate from a state-policy table — verify with the county assessor before closing.
Climate risk First Street
- Flood 1/10 Low FEMA zone X (unshaded) · 0% chance over 30 yrs
- Wildfire 1/10 Low
- Heat 2/10 Low 7 d/yr ≥96°F today · 15 d/yr by 30 yrs out
- Wind 1/10 Low
- Air quality 2/10 Low 1 unhealthy d/yr today · 2 by 30 yrs out
Nearby sold comps map
Loading sold comps map…
Walkable amenities ~0.75 mi
Loading nearby amenities…
Taxation est. · year 1
- Rental income
- $29,071
- − Mortgage interest
- −$11,758
- − Property taxes
- −$5,323
- − Insurance
- −$1,050
- − Repairs & maintenance
- −$2,326
- − Management
- −$2,326
- − Depreciation
- −$6,106
- Taxable income
- $183
- Est. tax owed @ 24.0%
- −$44
- After-tax cash flow
- $3,341/yr
For passive investors: Depreciation is non-cash, so a rental often shows a tax loss while cash-flowing — sheltering income. Rental losses are passive: they offset passive income freely, and up to $25,000/yr can offset ordinary (W-2) income if you actively participate and your MAGI is under $100k (phasing out to $0 by $150k); unused losses carry forward. On sale, claimed depreciation is recaptured at up to 25%, and gains may owe capital-gains tax (a 1031 exchange can defer both). Figures are a year-1 estimate at your 24.0% rate — not tax advice; consult a CPA.
Schools (NCES district)
- District
- Greece Central School District
- NCES district ID
- 3612630
- Math proficiency
- 35% ▼ -14.00%
- Reading proficiency
- 39% ▼ -3.00%
- Median HH income
- $52,718
- Composite
- 32.26/100
- National rank
- #5761
- State rank
- #544 of 590 in NY
Livability — Greece
- Score
- 79/100
- State rank
- #145
- US rank
- #2223
Category grades
Schools grade is shown separately in the Schools card above.
Census & demographics
- Census place
- Greece, NY
- County
- Monroe County · 674,131 people
- City population
- 29,210
- Metro
- Rochester, NY
- Population (ZIP)
- 29,273
- Household income
- $78,204
- Rent vs Own
- Severe rent burden
- 810.0
Population outlook (Monroe County) Hauer SSP2
- Today (2025)
- 759,460 people
- By 2030
- 757,154 · -0.3%
- By 2040
- 740,644 · -2.5%
- By 2050
- 714,443 · -5.9%
- By 2075
- 645,883 · -15.0%
- By 2100
- 547,084 · -28.0%
Race, ethnicity, and origin ACS 2023
- Neighborhood character
- Predominantly White (77%)
- Race & ethnicity
- White 77% Black 9% Hispanic / Latino 8% Two or more races 6% Asian 3%
- Hispanic origin (detail)
- Mexican 1% Puerto Rican 5%
- Common ancestry
- Romanian 5% Lithuanian 2% Subsaharan African 2%
- Foreign-born
- 9% · Canada, Vietnam, South Korea
- Languages at home
- 89% English-only · Other Indo-European 3% Spanish 3% Russian/Polish/Slavic 1%
Political lean MEDSL · Monroe
- 2024 margin
- D (+19.1) · D 59.5% · R 40.5%
- 2008→2024 swing
- +1.4pp toward D · 2008: 17.7pp · 2024: 19.1pp
- All cycles
- 2024: D+19.1 2020: D+21.0 2016: D+14.1 2012: D+17.4 2008: D+17.7
Not yet ingested
- Civics
- —
Market trends
- HPI YoY
- ▼ -113.91%
- Current HPI
- 248.9836
- Rent YoY
- ▲ 2.50%
- Metro
- Rochester, NY
- State GDP YoY
- ▲ 2.60%
- F500 in state
- 92
Industry mix (Fortune 500 HQ in NY)
| Industry | F500 HQs | Revenue |
|---|---|---|
| Financial Services | 10 | $950B |
|
||
| Consumer Goods | 9 | $162B |
|
||
| Insurance | 4 | $225B |
|
||
| Telecommunications | 2 | $144B |
|
||
| Pharmaceuticals | 2 | $112B |
|
||
| Media / Entertainment | 2 | $69B |
|
||
Price history
+75.1% since first listed18 events — show timeline
- 2026-06-08 Listed $209,900 UNYREIS
- 2025-01-28 Listing Removed — UNYREIS
- 2025-01-27 Listing Removed — UNYREIS
- 2025-01-14 Price Changed $239,000 UNYREIS
- 2025-01-08 Listed $259,900 UNYREIS
- 2018-12-13 Listing Removed — UNYREIS
- 2018-12-06 Listed $148,000 UNYREIS
- 2018-11-26 Listing Removed — UNYREIS
- 2018-11-09 Price Changed $149,900 UNYREIS
- 2018-10-31 Price Changed $152,900 UNYREIS
- 2018-10-23 Price Changed $154,900 UNYREIS
- 2018-10-16 Listed $159,900 UNYREIS
- 2014-12-08 Sold (Public Records) $103,500 Public Records
- 2014-12-05 Sold (MLS) $103,500 UNYREIS
- 2014-09-30 Listed $99,900 UNYREIS
- 2014-07-07 Listed $104,900 UNYREIS
- 2014-06-09 Listed $112,000 UNYREIS
- 2014-03-11 Listed $119,900 UNYREIS
Property tax history
+4.3%/yrLatest (2025): $5,323 · +156.7% YoY. Source: county tax records.
Cash-flow waterfall
monthlySold comps — $/sqft
last 12 mo · ≤1 miLoading sold comps…