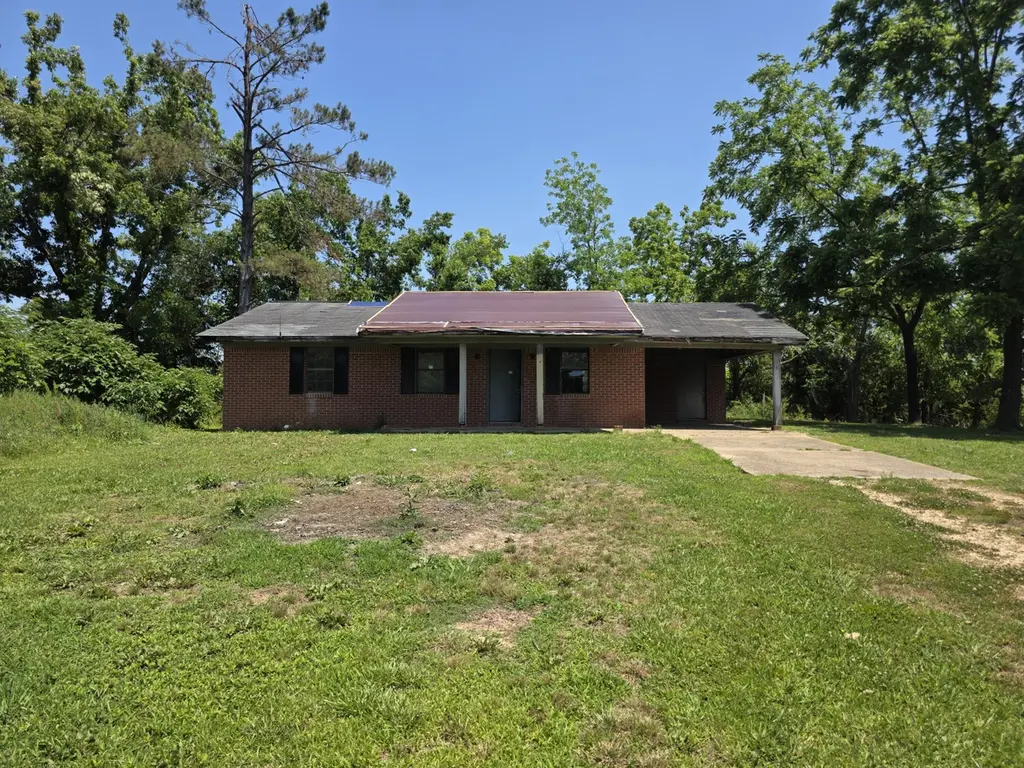
377 County Road 8301 · Jumpertown, MS
Flood risk 1/10 · Minimal
- FEMA flood zone
- X (unshaded)
- Chance of flooding over 30 yrs
- 0.0%
- Est. flood insurance / yr
- $507 – $1,088
Fire risk 7/10 · Major
- Est. fire insurance / yr
- $1,241 – $2,305
Heat risk 6/10 · Moderate
- Hot days now (above 108°F)
- 7 days/yr
- Hot days in 30 yrs
- 20 days/yr
Wind risk 6/10 · Moderate
- Chance of severe wind over 30 yrs
- 27.0%
Air-quality risk 1/10 · Minimal
- Unhealthy air days now
- 0 days/yr
- Unhealthy air days in 30 yrs
- 0 days/yr
Risk factors via First Street. Map © Google.
Why this score? — see what drove the D grade
The composite is a weighted blend of 9 inputs, each scored 0–100. Each bar is that input's sub-score; the figure is the points it added to the 100-point composite (weight × sub-score).
- Cash flow +15.0/30.0
- ARV discount +7.5/15.0
- 1% rule +5.0/10.0
- DSCR +5.0/10.0
- Schools +3.2/10.0
- Livability +3.0/5.0
- Rent growth +2.5/5.0
- Condition / age +2.5/5.0
- Appreciation +0.0/10.0
$16,300
🖨 Deal sheet 📄 Offer letter ✓ Due diligence
Listing remarks
Property to be sold AS IS. 3 bed 1 bath, great for fixer-uppers! HOLD HARMLESS must be signed prior to showing and is attached in documents section for agents. Buyer is responsible for all closing costs at the buyer's sole expense including tax stamps, transfer taxes unless state guidelines require differently. It is the buyer's responsibility to independently verify all property information. Broker does not warrant lot size or dimensions. Property must be listed on the market 5 days prior to accepting/negotiating offers/bids. Offers/bids must be submitted through the Auction platform at http://www. homes4purchase.com starting on May 27.
Key facts
- 0.8 acre lot
- Built 1990
- Listed 15 days
Property features AI
Finance
- Financial info: Annual tax approximately $477.99
Exterior
- Home design: Single-story ranch-style single family residence
- Exterior features: Lot approximately 0.8 acre; Lot dimensions about 100 x 348.48; Rural zoning
Interior
- Bathrooms: 1 full bathroom
- Interior features: 7 total rooms
Neighborhood map
What this means for you Summary
Snapshot
- This is a 3-bed/1.0-bath single-family listed at $16k.
Deal economics
- At list price, monthly cash flow is $719 ($9k/yr) — positive.
- The deal already cash-flows at list — no discount required.
- Meets the 1% rule at list price ($1k rent vs $16k).
- Recommended offer: $16k (1.5% below list) — sets the bar for market timing.
Location & tenants
- Location reads 60/100 on livability (#222 in MS) — a middle-class / working-renter tenant base. Strengths: cost of living A+, housing B+; Watch: schools F, amenities F, commute F.
- Prentiss County School District (rural): math 38% / reading 39% proficiency, ranked #44 of 130 in MS (top 34%) — families likely to look elsewhere, expect single-tenant / working-renter base with shorter leases.
- Market conditions: 18 active listings in the ZIP; 11 units permitted in Prentiss County in 2024 (0 in 5+ unit buildings).
Forward outlook
- Local home prices are declining (-3.0%/yr); year-one equity from $113 of loan paydown is wiped out by about $489 of value loss. Plan a longer hold.
- Prentiss County population projected to shrink 6% by 2050 — rents likely to lag national; underwrite the cash flow, not the appreciation.
- At projected returns (-3.0% appreciation + 3.0% rent growth), your $5k cash investment doubles in ~1 year — after that, you're playing with house money.
Negotiation context
- It's been on market 15 days — a 2% lower offer ($16k) is reasonable based on typical stale-listing flexibility.
Risks & watch-outs
- Climate carrying-cost: major wind risk, 27% chance of damaging wind over 30y; major wildfire risk; extreme-heat days projected 7→20/yr by 2055 (HVAC capex compounding) — expect insurance premiums to compound above CPI over the hold.
Questions for the listing agent
- Is there a deadline driving the sale (1031 exchange, divorce, estate, relocation)? That informs how much negotiation room exists.
- Schools are F-rated, which usually means shorter tenancies and higher turnover. Who's the typical renter profile here, and what's been the actual vacancy rate?
- The area grade is low — what's the realistic commute time and amenity access for the typical tenant pool here? Any planned neighborhood developments (good or bad) we should know about?
- What's the average days-on-market for RENTAL listings here right now (not sales)? A rising rental-DOM trend means longer vacancies and softer asking-rent achievability than the comps imply.
- What's the recent tenant-quality profile in this submarket — average credit score on applications, eviction rate, late-payment / NSF rate, and stable-employment percentage? A property-management company in the area should have these aggregated.
- How much new for-sale + rental construction is in the pipeline within 1–3 miles? Heavy new supply typically softens prices + rents 12–24 months out; constrained supply supports both.
Investment metrics
- 1% rule
- 6.46% ✓
- Cap rate
- 59.24%
- Cash-on-cash
- 189.08%
- DSCR
- 9.41
- GRM
- 1.3
CMA / ARV
No comps found within radius.
Projected returns pro-forma
-3.0% appreciation · 3.0% rent growth · sell at horizon
- IRR
- —
- Equity multiple
- 10.46×
- Total profit
- $43,177
- Equity at exit
- $2,430
- IRR
- —
- Equity multiple
- 22.17×
- Total profit
- $96,641
- Equity at exit
- $1,409
Cash invested: $4,564 (down + closing). Projections, not guarantees.
Landlord ↔ Tenant lean methodology
- Overall (STATE)
- 90 Strongly Landlord-Friendly
- State Mississippi
- 90 Strongly Landlord-Friendly · R+11
- County
- — inherits STATE
- City
- — inherits STATE
ZIP-level market 38865
- Home prices YoY
- -11.8%
- Active inventory
- 18
- Price-to-rent
- 1.3×
Monthly cashflow live
- Estimated rent
- $1,053 medium interval (Pro) →
- Mortgage (P&I)
- −$85
- Tax est. 1.5%
- −$20 /mo · $244/yr
- Insurance
- −$7
- HOA
- −$0
- Vacancy / Maint / Mgmt
- −$221
- Net cashflow
- $719
Break-even live
UW: 25.0% down · 7.5% · 30yr · 1.5% tax · 5.0% vac · 8.0% maint · 8.0% mgmt
Financing live
Cash to close
- Down payment
- $4,075
- Closing costs
- $489
- Reserves months
- —
- Total cash needed
- —
Loan-product check · same deal, 3 products live
Conventional
25% down · 7.5% · 30yr
- Down + closing
- —
- Monthly P&I
- —
- Monthly cashflow
- —
- DSCR
- —
- Eligible?
- —
Personal DTI + credit; lowest rate.
DSCR
20% down · 8.5% · 30yr
- Down + closing
- —
- Monthly P&I
- —
- Monthly cashflow
- —
- DSCR
- —
- Eligible?
- —
No personal income docs; deal must DSCR.
Hard money
10% down · 12.0% · 12mo
- Down + closing
- —
- Monthly P&I
- —
- Monthly cashflow
- —
- DSCR
- —
- Eligible?
- —
Short-term bridge; refi at stabilization.
Listing history 2 events
-
2026-06-01statusdays on market $16,300 Pending 15 DOM
-
2026-05-15$16,300 Active 646-char remark
ⓘ Source: listings_history table (triggers on properties + properties_extension) + one-shot
backfill from property_details.listing_events for pre-trigger history.
Climate risk First Street
- Flood 1/10 Low FEMA zone X (unshaded) · 0% chance over 30 yrs
- Wildfire 7/10 Severe
- Heat 6/10 Major 7 d/yr ≥108°F today · 20 d/yr by 30 yrs out
- Wind 6/10 Major 27% chance of damaging wind over 30 yrs
- Air quality 1/10 Low 0 unhealthy d/yr today · 0 by 30 yrs out
Nearby sold comps map
Loading sold comps map…
Walkable amenities ~0.75 mi
Loading nearby amenities…
Taxation est. · year 1
- Rental income
- $12,635
- − Mortgage interest
- −$913
- − Property taxes
- −$244
- − Insurance
- −$82
- − Repairs & maintenance
- −$1,011
- − Management
- −$1,011
- − Depreciation
- −$474
- Taxable income
- $8,900
- Est. tax owed @ 24.0%
- −$2,136
- After-tax cash flow
- $6,494/yr
For passive investors: Depreciation is non-cash, so a rental often shows a tax loss while cash-flowing — sheltering income. Rental losses are passive: they offset passive income freely, and up to $25,000/yr can offset ordinary (W-2) income if you actively participate and your MAGI is under $100k (phasing out to $0 by $150k); unused losses carry forward. On sale, claimed depreciation is recaptured at up to 25%, and gains may owe capital-gains tax (a 1031 exchange can defer both). Figures are a year-1 estimate at your 24.0% rate — not tax advice; consult a CPA.
Schools (NCES district)
- District
- Prentiss County School District
- NCES district ID
- 2803750
- Math proficiency
- 38% ▼ -19.00%
- Reading proficiency
- 39% ▼ -14.00%
- Median HH income
- $36,980
- Composite
- 32.01/100
- National rank
- #5829
- State rank
- #44 of 130 in MS
Livability — Jumpertown
- Score
- 60/100
- State rank
- #222
- US rank
- #19089
Category grades
Schools grade is shown separately in the Schools card above.
Census & demographics
- Population (ZIP)
- 5,367
Population outlook (Prentiss County) Hauer SSP2
- Today (2025)
- 25,348 people
- By 2030
- 25,247 · -0.4%
- By 2040
- 24,786 · -2.2%
- By 2050
- 23,851 · -5.9%
- By 2075
- 20,434 · -19.4%
- By 2100
- 15,359 · -39.4%
Race, ethnicity, and origin ACS 2023
- Neighborhood character
- Predominantly White (68%)
- Race & ethnicity
- White 68% Two or more races 16% Black 14% Hispanic / Latino 3%
- Common ancestry
- Scotch-Irish 1% Romanian 1% Russian 1%
- Foreign-born
- 0%
- Languages at home
- 99% English-only · Spanish 1%
Political lean MEDSL · Prentiss
- 2024 margin
- Solid R (+66.0) · D 16.6% · R 82.7%
- 2008→2024 swing
- -23.2pp toward R · 2008: -42.8pp · 2024: -66.0pp
- All cycles
- 2024: R+66.0 2020: R+58.3 2016: R+56.5 2012: R+42.4 2008: R+42.8
Not yet ingested
- Civics
- —
Market trends
- HPI YoY
- ▼ -22.90%
- Current HPI
- 170.9891
- Rent YoY
- —
- Metro
- —
- State GDP YoY
- —
- F500 in state
- 0
Price history
2 events — show timeline
- 2026-06-01 Pending — NEMSBD
- 2026-05-15 Listed $16,300 NEMSBD
Cash-flow waterfall
monthlySold comps — $/sqft
last 12 mo · ≤1 miLoading sold comps…