 🌊 Lakefront
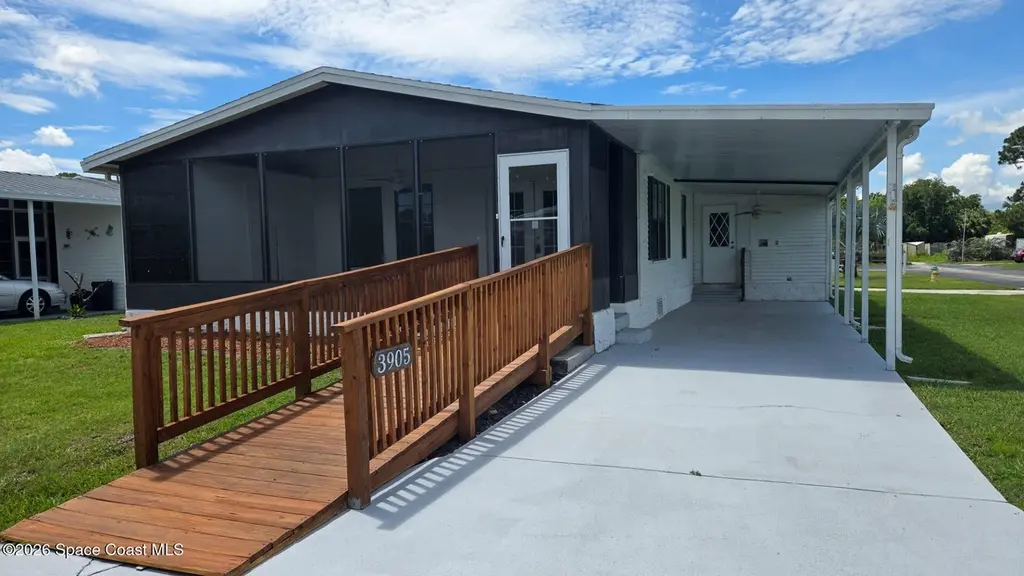
3905 Sugar Berry Pl · Cocoa, FL
Flood risk 1/10 · Minimal
- FEMA flood zone
- X (unshaded)
- Chance of flooding over 30 yrs
- 0.0%
- Est. flood insurance / yr
- $507 – $1,088
Fire risk 7/10 · Major
- Est. fire insurance / yr
- $947 – $1,759
Heat risk 9/10 · Severe
- Hot days now (above 106°F)
- 7 days/yr
- Hot days in 30 yrs
- 21 days/yr
Wind risk 10/10 · Severe
- Chance of severe wind over 30 yrs
- 99.0%
Air-quality risk 1/10 · Minimal
- Unhealthy air days now
- 0 days/yr
- Unhealthy air days in 30 yrs
- 0 days/yr
Risk factors via First Street. Map © Google.
Why this score? — see what drove the C- grade
The composite is a weighted blend of 9 inputs, each scored 0–100. Each bar is that input's sub-score; the figure is the points it added to the 100-point composite (weight × sub-score).
- Cash flow +19.9/30.0
- ARV discount +7.5/15.0
- DSCR +6.3/10.0
- 1% rule +5.7/10.0
- Schools +4.7/10.0
- Rent growth +3.9/5.0
- Livability +3.6/5.0
- Condition / age +2.5/5.0
- Appreciation +0.0/10.0
$189,000
🖨 Deal sheet 📄 Offer letter ✓ Due diligence
Listing remarks MLS
This is a 3 bedroom 2 bath home in a 55+ community and you own the land. Low COA fees of $115 per month. This is a newly renovated/updated move-in ready home. Upgrades include new roof, air and heating system, and all updated plumbing inside and out. All new kitchen including soft close cabinets, all 4 major appliances, quartz countertops and a built in pantry. All flooring is Vinyl planks. Also, new hot water heater, new vanities in both bathroom, all new outlets and switches throughout. Will work with a selling agent.
Key facts
- Lakefront community
- Club house
- Pool
Tags
Property features AI
Finance
- Other: Unfurnished; Living area approximately 1,697; Lot size approximately 0.53 acres
- HOA & community: Association fee $115 monthly; Association amenities: Clubhouse, Laundry, Maintenance of grounds, Management (part time), RV/Boat storage, Shuffleboard court; Gated community; Senior community; Pets allowed (cats and dogs; number limit applies)
Exterior
- Parking: Carport (2 spaces)
- Security: Gated community
- Utilities: Public sewer; Cable available; Electricity connected; Sewer connected; Water connected
- Home design: Manufactured home; One level (entry level 1); Faces north
- Construction: Frame construction with vinyl siding; Built as a manufactured home
- Exterior features: Front screened porch; Front porch; Security gate; Shingle roof; Cleared lot; Corner lot; Located on a dead-end street; Private road with asphalt surface
Interior
- Kitchen: Dishwasher; Electric range; Microwave; Refrigerator
- Bedrooms: 3 bedrooms (all on the main level)
- Bathrooms: 2 full bathrooms
- Heating & cooling: Central heating (electric); Central air; Wall/window unit(s); Has heating and cooling
- Interior features: Breakfast bar; Built-in features; Ceiling fans; Eat-in kitchen; Open floorplan; Pantry; Primary bathroom with shower (no tub); Vaulted ceilings; Accessible approach with ramp; Central living area; Grip-accessible features
- Laundry & utility: Washer hookup; Electric dryer hookup
Neighborhood map
What this means for you Summary
Snapshot
- This is a 3-bed/2.0-bath manufactured listed at $189k.
Deal economics
- At list price, monthly cash flow is $227 ($3k/yr) — positive.
- The deal already cash-flows at list — no discount required.
- Meets the 1% rule at list price ($2k rent vs $189k).
- Recommended offer: $186k (1.5% below list) — sets the bar for market timing.
Location & tenants
- Location reads 72/100 on livability (#344 in FL) — a middle-class / working-renter tenant base. Strengths: commute A+, cost of living A+, housing A+; Watch: crime F, amenities F, employment D-.
- Brevard (suburban): math 53% / reading 57% proficiency, ranked #19 of 73 in FL (top 26%) — acceptable for families but not a draw, mixed tenant base, ~2y average lease.
- Zoned schools: Saturn Elementary School (math 23% / reading 29%, grade F, #2,015 of 2,144 statewide, top 94%, 643 students, 81% FRL); Ronald Mcnair Magnet Middle School (math 58% / reading 50%, grade B-, #196 of 571 statewide, top 36%, 364 students, 58% FRL); Rockledge Senior High School (math 27% / reading 49%, grade F, #328 of 667 statewide, top 50%, 1,558 students, 50% FRL) — zoned schools average 63% FRL vs 43% district-wide (20 pts higher); higher-poverty schools than district average — tighter screening recommended.
- Zoned-school proficiency averages 39% at this address vs 55% district-wide (-16 pts) — the specific schools serving this property underperform the Brevard average; the district grade overstates school quality for this exact location.
- Market conditions: Rents rising fast (+5.6%/yr); 291 active listings in the ZIP; 3 comparable units currently listed for rent nearby; rentals at typical pace (median 24d on market — plan ~3-4 weeks tenant-placement turnaround); 4,602 units permitted in Brevard County in 2024 (702 in 5+ unit buildings).
- This rent runs 34% of the median local income ($71k/yr) — at the standard rent-burdened threshold; future hikes will face affordability resistance.
Forward outlook
- Local home prices are declining (-3.0%/yr); year-one equity from $1k of loan paydown is wiped out by about $6k of value loss. Plan a longer hold.
- Brevard County population projected at +15% by 2050 — modest demand growth; plan on rents tracking national, not racing it.
Negotiation context
- It's been on market 19 days — a 2% lower offer ($186k) is reasonable based on typical stale-listing flexibility.
- 6 sale attempts since 19y ago with the ask held roughly flat each time — persistent listings suggest the price (not the market) is what's stuck; bring a comps-based counter.
- Current owner paid $70k; list at $189k implies a 170% gain — meaningful room to come down on a strong offer.
Risks & watch-outs
- Climate carrying-cost: severe wind risk, 99% chance of damaging wind over 30y; major wildfire risk; extreme-heat days projected 7→21/yr by 2055 (HVAC capex compounding) — expect insurance premiums to compound above CPI over the hold.
Questions for the listing agent
- What does the HOA fee cover, when was the last increase, and are there any pending special assessments or reserve-fund shortfalls?
- Is there a deadline driving the sale (1031 exchange, divorce, estate, relocation)? That informs how much negotiation room exists.
- Schools are B-rated — typically a magnet for longer-tenancy family renters. What's the average tenant stay here, and is there a school-zone premium baked into asking?
- Crime grade is F in this area — have there been break-ins, vandalism, or insurance claims at this property in the last 3 years? What carrier currently insures it and at what premium?
- This sits on a lake — are riparian / water-frontage rights deeded with the parcel? Any dock permits, shoreline easements, or HOA water-use restrictions?
- What's the documented flood / surge / shoreline-erosion history here (FEMA AND non-FEMA — e.g., storm surge, creek backup, septic-field saturation)?
- Any water-quality or seasonal algae-bloom issues that affect tenant satisfaction or short-term-rental demand?
- What's the average days-on-market for RENTAL listings here right now (not sales)? A rising rental-DOM trend means longer vacancies and softer asking-rent achievability than the comps imply.
- What's the recent tenant-quality profile in this submarket — average credit score on applications, eviction rate, late-payment / NSF rate, and stable-employment percentage? A property-management company in the area should have these aggregated.
- How much new for-sale + rental construction is in the pipeline within 1–3 miles? Heavy new supply typically softens prices + rents 12–24 months out; constrained supply supports both.
Investment metrics
- 1% rule
- 1.07% ✓
- Cap rate
- 7.73%
- Cash-on-cash
- 5.14%
- DSCR
- 1.23
- GRM
- 7.8
CMA / ARV
No comps found within radius.
Projected returns pro-forma
-3.0% appreciation · 5.6% rent growth · sell at horizon
- IRR
- -5.3%
- Equity multiple
- 0.80×
- Total profit
- $-10,690
- Equity at exit
- $28,181
- IRR
- 7.4%
- Equity multiple
- 1.62×
- Total profit
- $33,068
- Equity at exit
- $16,341
Cash invested: $52,920 (down + closing). Projections, not guarantees.
Landlord ↔ Tenant lean methodology
- Overall (STATE)
- 87 Strongly Landlord-Friendly
- State Florida
- 87 Strongly Landlord-Friendly · R+3
- County
- — inherits STATE
- City
- — inherits STATE
ZIP-level market 32926
- Home prices YoY
- -16.9%
- Rents YoY
- 5.6%
- Active inventory
- 291
- Price-to-rent
- 7.8×
Monthly cashflow live
- Estimated rent
- $2,023 medium interval (Pro) →
- Mortgage (P&I)
- −$991
- Tax from tax record
- −$187 /mo · $2,239/yr
- Insurance
- −$79
- HOA
- −$115
- Vacancy / Maint / Mgmt
- −$425
- Net cashflow
- $227
Break-even live
UW: 25.0% down · 7.5% · 30yr · 1.5% tax · 5.0% vac · 8.0% maint · 8.0% mgmt
Financing live
Cash to close
- Down payment
- $47,250
- Closing costs
- $5,670
- Reserves months
- —
- Total cash needed
- —
Loan-product check · same deal, 3 products live
Conventional
25% down · 7.5% · 30yr
- Down + closing
- —
- Monthly P&I
- —
- Monthly cashflow
- —
- DSCR
- —
- Eligible?
- —
Personal DTI + credit; lowest rate.
DSCR
20% down · 8.5% · 30yr
- Down + closing
- —
- Monthly P&I
- —
- Monthly cashflow
- —
- DSCR
- —
- Eligible?
- —
No personal income docs; deal must DSCR.
Hard money
10% down · 12.0% · 12mo
- Down + closing
- —
- Monthly P&I
- —
- Monthly cashflow
- —
- DSCR
- —
- Eligible?
- —
Short-term bridge; refi at stabilization.
Rent comps 3 comps
| Address | Beds | Baths | Sqft | Rent | $/sqft | DOM | Units | Dist |
|---|---|---|---|---|---|---|---|---|
| 527 A Ln Cocoa, FL | 3.0 | 1.0 | 1500 | $1,800 | $1.20 | 23d | 1 | 0.68mi |
| 3782 Catalina Dr Cocoa, FL | 3.0 | 2.0 | 1404 | $2,075 | $1.48 | 23d | 1 | 1.06mi |
| 4164 Fishermans Pl Cocoa, FL | 2.0 | 2.0 | 1200 | $1,625 | $1.35 | 23d | 1 | 1.45mi |
HOA detail
- Monthly dues
- $115 · $1,380/yr
- Likely covers
- water
Listing history 14 events
-
2026-06-18days on market $189,000 Active 19 DOM
-
2026-06-17days on market $189,000 Active 18 DOM
-
2026-06-16days on market $189,000 Active 17 DOM
-
2026-06-15days on market $189,000 Active 16 DOM
-
2026-06-14days on market $189,000 Active 14 DOM
-
2026-06-10days on market $189,000 Active 11 DOM
-
2026-06-08days on market $189,000 Active 9 DOM
-
2026-06-07days on market $189,000 Active 8 DOM
-
2026-06-05days on market $189,000 Active 5 DOM
-
2026-06-03days on market $189,000 Active 4 DOM
-
2026-06-02days on market $189,000 Active 3 DOM
-
2026-06-01days on market $189,000 Active 2 DOM
-
2026-05-31remarks 687-char remark
-
2026-05-31$189,000 Active 1 DOM
ⓘ Source: listings_history table (triggers on properties + properties_extension) + one-shot
backfill from property_details.listing_events for pre-trigger history.
Tax reassessment forecast FL · Resets to sale price
- Current annual tax
- $2,239 · $187/mo
- Projected year-2 tax
- $2,239 · $187/mo
- Expected delta
- $0/yr ($0/mo · 0.0%)
ⓘ Screening estimate from a state-policy table — verify with the county assessor before closing.
Climate risk First Street
- Flood 1/10 Low FEMA zone X (unshaded) · 0% chance over 30 yrs
- Wildfire 7/10 Severe
- Heat 9/10 Extreme 7 d/yr ≥106°F today · 21 d/yr by 30 yrs out
- Wind 10/10 Extreme 99% chance of damaging wind over 30 yrs
- Air quality 1/10 Low 0 unhealthy d/yr today · 0 by 30 yrs out
Nearby sold comps map
Loading sold comps map…
Walkable amenities ~0.75 mi
Loading nearby amenities…
Taxation est. · year 1
- Rental income
- $24,275
- − Mortgage interest
- −$10,587
- − Property taxes
- −$2,239
- − Insurance
- −$945
- − Repairs & maintenance
- −$1,942
- − Management
- −$1,942
- − HOA
- −$1,380
- − Depreciation
- −$5,498
- Taxable loss
- −$258
- Est. tax savings @ 24.0%
- +$62
- After-tax cash flow
- $2,782/yr
For passive investors: Depreciation is non-cash, so a rental often shows a tax loss while cash-flowing — sheltering income. Rental losses are passive: they offset passive income freely, and up to $25,000/yr can offset ordinary (W-2) income if you actively participate and your MAGI is under $100k (phasing out to $0 by $150k); unused losses carry forward. On sale, claimed depreciation is recaptured at up to 25%, and gains may owe capital-gains tax (a 1031 exchange can defer both). Figures are a year-1 estimate at your 24.0% rate — not tax advice; consult a CPA.
Schools (NCES district)
- District
- Brevard
- NCES district ID
- 1200150
- Math proficiency
- 53% ▼ -9.00%
- Reading proficiency
- 57% ▼ -4.00%
- Median HH income
- $49,426
- Composite
- 46.86/100
- National rank
- #2370
- State rank
- #19 of 73 in FL
Livability — Cocoa
- Score
- 72/100
- State rank
- #344
- US rank
- #5979
Category grades
Schools grade is shown separately in the Schools card above.
Census & demographics
- County
- Brevard County · 602,871 people
- City population
- 67,424
- Metro
- Palm Bay-Melbourne-Titusville, FL
- Population (ZIP)
- 23,505
- Household income
- $70,735
- Rent vs Own
- Severe rent burden
- 782.0
Population outlook (Brevard County) Hauer SSP2
- Today (2025)
- 623,254 people
- By 2030
- 648,420 · +4.0%
- By 2040
- 690,009 · +10.7%
- By 2050
- 715,669 · +14.8%
- By 2075
- 775,744 · +24.5%
- By 2100
- 776,687 · +24.6%
Race, ethnicity, and origin ACS 2023
- Neighborhood character
- Predominantly White (72%)
- Race & ethnicity
- White 72% Black 11% Hispanic / Latino 10% Two or more races 9% Asian 2%
- Hispanic origin (detail)
- Mexican 5% Puerto Rican 2%
- Common ancestry
- Romanian 2% Lithuanian 2% Italian 2%
- Foreign-born
- 5% · Canada, Vietnam, Jamaica
- Languages at home
- 91% English-only · Spanish 6% Vietnamese 1% German/W. Germanic 1%
Political lean MEDSL · Brevard
- 2024 margin
- Strong R (+20.8) · D 39.1% · R 59.9% · Other 1.0%
- 2008→2024 swing
- -10.4pp toward R · 2008: -10.4pp · 2024: -20.8pp
- All cycles
- 2024: R+20.8 2020: R+16.4 2016: R+19.8 2012: R+12.7 2008: R+10.4
Not yet ingested
- Civics
- —
Market trends
- HPI YoY
- ▼ -68.32%
- Current HPI
- 335.1251
- Rent YoY
- ▲ 5.60%
- Metro
- Palm Bay-Melbourne-Titusville, FL
- State GDP YoY
- ▲ 3.28%
- F500 in state
- 36
Industry mix (Fortune 500 HQ in FL)
| Industry | F500 HQs | Revenue |
|---|---|---|
| Industrial Technology | 2 | $29B |
|
||
| Insurance | 2 | $17B |
|
||
| Retail | 1 | $60B |
|
||
| Technology Distribution | 1 | $58B |
|
||
| Homebuilding | 1 | $35B |
|
||
| Technology Manufacturing | 1 | $35B |
|
||
Price history
+170.4% since first listed27 events — show timeline
- 2026-05-29 Listed $189,000 SCMLS
- 2026-04-27 Listing Removed — SCMLS
- 2026-01-27 Listed $195,500 SCMLS
- 2025-09-09 Sold (Public Records) $70,000 Public Records
- 2025-09-05 Sold (MLS) $70,000 SCMLS
- 2025-08-23 Contingent — SCMLS
- 2025-08-04 Price Changed $95,000 SCMLS
- 2025-07-28 Price Changed $100,000 SCMLS
- 2025-06-26 Price Changed $105,000 SCMLS
- 2025-06-21 Price Changed $110,000 SCMLS
- 2025-06-12 Price Changed $115,000 SCMLS
- 2025-05-22 Price Changed $133,000 SCMLS
- 2025-04-23 Price Changed $139,000 SCMLS
- 2025-04-11 Listed $149,900 SCMLS
- 2024-05-01 Pending — SCMLS
- 2024-05-01 Sold (Public Records) $143,500 Public Records
- 2024-05-01 Sold (MLS) $143,500 Stellar MLS as Distributed by MLS Grid
- 2024-05-01 Sold (MLS) $143,500 SCMLS
- 2024-03-22 Pending — Stellar MLS as Distributed by MLS Grid
- 2024-03-22 Contingent — SCMLS
- 2024-03-15 Price Changed $143,500 Stellar MLS as Distributed by MLS Grid
- 2024-03-15 Price Changed $143,500 SCMLS
- 2024-02-19 Listed $157,000 SCMLS
- 2024-02-18 Listed $157,000 Stellar MLS as Distributed by MLS Grid
- 2010-11-03 Sold (Public Records) $57,000 Public Records
- 2010-10-28 Sold (MLS) $57,000 SCMLS
- 2007-12-04 Listed $69,900 SCMLS
Property tax history
+11.1%/yrLatest (2025): $2,239 · +173.2% YoY. Source: county tax records.
Cash-flow waterfall
monthlySold comps — $/sqft
last 12 mo · ≤1 miLoading sold comps…