 Duplex
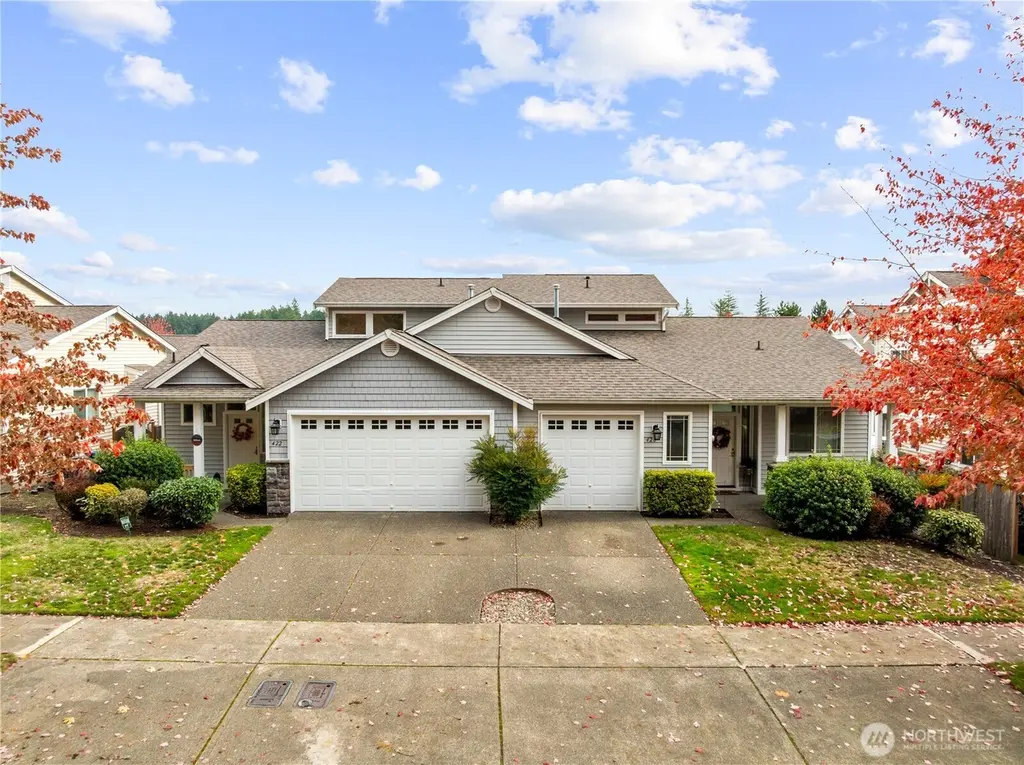
420 Bungalow Dr NW · Olympia, WA
Flood risk 1/10 · Minimal
- FEMA flood zone
- X (unshaded)
- Chance of flooding over 30 yrs
- 0.0%
- Est. flood insurance / yr
- $507 – $1,088
Fire risk 1/10 · Minimal
- Est. fire insurance / yr
- $604 – $1,122
Heat risk 3/10 · Minor
- Hot days now (above 88°F)
- 7 days/yr
- Hot days in 30 yrs
- 14 days/yr
Wind risk 1/10 · Minimal
- Chance of severe wind over 30 yrs
- —
Air-quality risk 6/10 · Moderate
- Unhealthy air days now
- 6 days/yr
- Unhealthy air days in 30 yrs
- 6 days/yr
Risk factors via First Street. Map © Google.
Why this score? — see what drove the D- grade
The composite is a weighted blend of 9 inputs, each scored 0–100. Each bar is that input's sub-score; the figure is the points it added to the 100-point composite (weight × sub-score).
- Appreciation +10.0/10.0
- ARV discount +8.6/15.0
- Schools +6.2/10.0
- Livability +4.2/5.0
- Cash flow +4.1/30.0
- Rent growth +3.3/5.0
- Condition / age +2.5/5.0
- 1% rule +0.8/10.0
- DSCR +0.0/10.0
$710,000
🖨 Deal sheet 📄 Offer letter ✓ Due diligence
Multi-family units
County records classify this as Multi-Family (2-4 Unit). Listing-text estimate: 2 units. confirmed
Listing remarks
Great opportunity to add to your investment portfolio, offering potential for instant cash flow. This 2007 duplex features 2 townhomes, each w/ 2 bedrooms & 2.5 bathrooms. One unit includes a two-car garage, while the other offers a one-car garage w/ additional storage; both units have driveway parking & private backyards. The homes offer thoughtfully designed open concept floor plans perfect for entertaining, w/ soaring 18 ft. living room ceilings, gas fireplaces, & abundant natural light throughout each home. Incredible location making these a commuter's dream, close to schools, parks, groceries, gas stations, countless eateries & entertainment. Perfect first-time r
Key facts
- One car garage
- Gas fireplaces
- Two car garage
Tags
Neighborhood map
What this means for you Summary
Snapshot
- This is a 2 × 2.0-bed/2.5-bath units multifamily listed at $710k.
Deal economics
- At list price, monthly cash flow is $-2k ($-23k/yr) — negative. Per door: $-979/mo.
- To cash-flow at today's rent, offer at most $427k (39.9% below list).
- To meet the 1% rule (rent ≥ 1% of price), the offer needs to be $409k (42.4% below list).
- Recommended offer: $409k (42.4% below list) — sets the bar for 1% rule.
- Cap rate 3.0% vs local median 2.4% in Olympia — meaningfully above typical; check what's discounted (condition, days-on-market, listing class) to confirm the premium yield is real.
Location & tenants
- Location reads 83/100 on livability (#58 in WA, #1,036 nationally) — a professional / high-income tenant draw. Strengths: amenities A+, commute A+, health & safety A+; Watch: crime F, cost of living D-.
- Olympia School District (urban): math 66% / reading 75% proficiency, ranked #17 of 291 in WA (top 6%) — strong family-tenant draw, lease renewals of 3-5y typical.
- Market conditions: Rents rising (+3.2%/yr); 304 active listings in the ZIP; 1 comparable units currently listed for rent nearby; solid renter incomes; 1,222 units permitted in Thurston County in 2024 (508 in 5+ unit buildings).
- At $4,087/mo this rent would consume 53% of the median local household income ($92k/yr) (locally 1811% of renters already pay >50% of income on rent) — very limited rent-growth headroom before tenants either downsize or default.
Forward outlook
- In year one you build about $76k of equity ($5k loan paydown + $71k appreciation (10.0% local appreciation)).
- Thurston County population projected at +27% by 2050 — long-run rental-demand tailwind backs the buy-and-hold thesis.
- By year 2, paydown + projected appreciation supports a ~$122k cash-out refi (75% LTV) — recoverable capital for the next deal without selling this one.
Negotiation context
- It's been on market 223 days — a 12% lower offer ($625k) is reasonable based on typical stale-listing flexibility.
- 2 sale attempts since 14y ago; this cycle's ask has dropped $40k (5%) from the opening price — seller is motivated, your offer sets the floor, not the list.
- Current owner paid $318k; list at $710k implies a 123% gain — meaningful room to come down on a strong offer.
Questions for the listing agent
- What do current leases actually rent for vs. the listed asking? Can we see a recent rent roll and the last 12 months of T-12 income?
- It's been on market 223 days. Have you received any prior offers? Is the seller open to a 42% concession, seller financing, or rate buy-down credit?
- Can we see the unit-by-unit rent roll, current vacancy, and any below-market leases? What's the average tenancy length?
- What capital expenditures (roof, boiler, parking lot, exteriors) have been made in the last 5 years, and what's planned in the next 2?
- What does the HOA fee cover, when was the last increase, and are there any pending special assessments or reserve-fund shortfalls?
- Why hasn't it sold? Are there any deal-killer items the seller is aware of (foundation, flood, title, zoning, code violations)?
- Is there a deadline driving the sale (1031 exchange, divorce, estate, relocation)? That informs how much negotiation room exists.
- Schools are A-rated — typically a magnet for longer-tenancy family renters. What's the average tenant stay here, and is there a school-zone premium baked into asking?
- Crime grade is F in this area — have there been break-ins, vandalism, or insurance claims at this property in the last 3 years? What carrier currently insures it and at what premium?
- The area grade is low — what's the realistic commute time and amenity access for the typical tenant pool here? Any planned neighborhood developments (good or bad) we should know about?
- What's the average days-on-market for RENTAL listings here right now (not sales)? A rising rental-DOM trend means longer vacancies and softer asking-rent achievability than the comps imply.
- What's the recent tenant-quality profile in this submarket — average credit score on applications, eviction rate, late-payment / NSF rate, and stable-employment percentage? A property-management company in the area should have these aggregated.
- How much new apartment / multifamily construction is in the pipeline within 1–3 miles? Heavy new supply (>2% of stock underway) typically softens rents 12–24 months out; light construction supports rent growth.
Investment metrics
- 1% rule
- 0.58% ✗
- Cap rate
- 2.98%
- Cash-on-cash
- -11.82%
- DSCR
- 0.47
- GRM
- 14.5
CMA / ARV
- ARV (median comp)
- $728,596
- List price
- $710,000
- Delta
- -2.55%
- Verdict
- FAIR
- Comps
- 5 within 1.0 mi
Show comp detail 2 sales within ~0.75 mi
| Address | Dist | Beds/Ba | Sqft | Sold | Price | $/sf | Match |
|---|---|---|---|---|---|---|---|
| 424 426 Bungalow Dr NW | 0.02mi | 4/5.0 | 2,632 (0%) | 15mo | $725,000 | $275 | 87 |
| 3801 3803 4th Ave NW | 0.06mi | 4/5.0 | 2,754 (+5%) | 15mo | $725,000 | $263 | 77 |
Match score weights: distance 35% · size 25% · config 20% · recency 20%. Top-matched comps best support the ARV.
Projected returns pro-forma
10.0% appreciation · 3.16% rent growth · sell at horizon
- IRR
- 16.1%
- Equity multiple
- 2.32×
- Total profit
- $262,877
- Equity at exit
- $639,624
- IRR
- 15.5%
- Equity multiple
- 5.40×
- Total profit
- $874,003
- Equity at exit
- $1,379,374
Cash invested: $198,800 (down + closing). Projections, not guarantees.
Landlord ↔ Tenant lean methodology
- Overall (STATE)
- 28 Tenant-Leaning
- State Washington
- 28 Tenant-Leaning · D+8
- County
- — inherits STATE
- City
- — inherits STATE
ZIP-level market 98502
- Home prices YoY
- 1.8%
- Rents YoY
- 3.2%
- Active inventory
- 304
- Price-to-rent
- 29.0×
Monthly cashflow live
- Estimated rent
- $4,087 high interval (Pro) →
- Mortgage (P&I)
- −$3,723
- Tax est. 1.5%
- −$888 /mo · $10,650/yr
- Insurance
- −$296
- HOA
- −$280
- Vacancy / Maint / Mgmt
- −$858
- Net cashflow
- $-1,958
Break-even live
2-unit breakdown (identical units grouped — click to expand)
| Units | Beds | Baths | Est. rent |
|---|---|---|---|
| 2× units | 2.0 | 2.5 | $4,088 |
| #1 | 2.0 | 2.5 | $2,044 |
| #2 | 2.0 | 2.5 | $2,044 |
| Total (2 units) | $4,087 | ||
UW: 25.0% down · 7.5% · 30yr · 1.5% tax · 5.0% vac · 8.0% maint · 8.0% mgmt
Financing live
Cash to close
- Down payment
- $177,500
- Closing costs
- $21,300
- Reserves months
- —
- Total cash needed
- —
Loan-product check · same deal, 3 products live
Conventional
25% down · 7.5% · 30yr
- Down + closing
- —
- Monthly P&I
- —
- Monthly cashflow
- —
- DSCR
- —
- Eligible?
- —
Personal DTI + credit; lowest rate.
DSCR
20% down · 8.5% · 30yr
- Down + closing
- —
- Monthly P&I
- —
- Monthly cashflow
- —
- DSCR
- —
- Eligible?
- —
No personal income docs; deal must DSCR.
Hard money
10% down · 12.0% · 12mo
- Down + closing
- —
- Monthly P&I
- —
- Monthly cashflow
- —
- DSCR
- —
- Eligible?
- —
Short-term bridge; refi at stabilization.
Rent comps 1 comps
| Address | Beds | Baths | Sqft | Rent | $/sqft | DOM | Units | Dist |
|---|---|---|---|---|---|---|---|---|
| 4407 Goldcrest Dr NW Olympia, WA | 4.0 | 2.5 | 2615 | $2,950 | $1.13 | 44d | 1 | 0.68mi |
HOA detail
- Monthly dues
- $280 · $3,360/yr
- Likely covers
- gas
Listing history 21 events
-
2026-06-18days on market $710,000 Active 223 DOM
-
2026-06-17days on market $710,000 Active 222 DOM
-
2026-06-16days on market $710,000 Active 221 DOM
-
2026-06-15days on market $710,000 Active 220 DOM
-
2026-06-14days on market $710,000 Active 218 DOM
-
2026-06-13days on market $710,000 Active 217 DOM
-
2026-06-10days on market $710,000 Active 215 DOM
-
2026-06-09days on market $710,000 Active 214 DOM
-
2026-06-08days on market $710,000 Active 213 DOM
-
2026-06-07days on market $710,000 Active 212 DOM
-
2026-06-05days on market $710,000 Active 209 DOM
-
2026-06-02days on market $710,000 Active 207 DOM
-
2026-06-01days on market $710,000 Active 206 DOM
-
2026-05-31days on market $710,000 Active 205 DOM
-
2026-05-30days on market $710,000 Active 204 DOM
-
2026-04-29price $710,000
-
2026-01-14price $724,900
-
2025-11-07$749,900 Active
-
2012-07-02soldstatus $318,000 Sold
-
2012-06-11status Pending
-
2012-03-02$384,000 Active
ⓘ Source: listings_history table (triggers on properties + properties_extension) + one-shot
backfill from property_details.listing_events for pre-trigger history.
Climate risk First Street
- Flood 1/10 Low FEMA zone X (unshaded) · 0% chance over 30 yrs
- Wildfire 1/10 Low
- Heat 3/10 Moderate 7 d/yr ≥88°F today · 14 d/yr by 30 yrs out
- Wind 1/10 Low
- Air quality 6/10 Major 6 unhealthy d/yr today · 6 by 30 yrs out
Nearby sold comps map
Loading sold comps map…
Walkable amenities ~0.75 mi
Loading nearby amenities…
Taxation est. · year 1
- Rental income
- $49,044
- − Mortgage interest
- −$39,771
- − Property taxes
- −$10,650
- − Insurance
- −$3,550
- − Repairs & maintenance
- −$3,924
- − Management
- −$3,924
- − HOA
- −$3,360
- − Depreciation
- −$20,655
- Taxable loss
- −$36,789
- Est. tax savings @ 24.0%
- +$8,829
- After-tax cash flow
- $-14,666/yr
For passive investors: Depreciation is non-cash, so a rental often shows a tax loss while cash-flowing — sheltering income. Rental losses are passive: they offset passive income freely, and up to $25,000/yr can offset ordinary (W-2) income if you actively participate and your MAGI is under $100k (phasing out to $0 by $150k); unused losses carry forward. On sale, claimed depreciation is recaptured at up to 25%, and gains may owe capital-gains tax (a 1031 exchange can defer both). Figures are a year-1 estimate at your 24.0% rate — not tax advice; consult a CPA.
Schools (NCES district)
- District
- Olympia School District
- NCES district ID
- 5306180
- Math proficiency
- 66% ▼ -2.00%
- Reading proficiency
- 75% ▼ -2.00%
- Median HH income
- $63,852
- Composite
- 62.27/100
- National rank
- #1438
- State rank
- #17 of 291 in WA
Livability — Olympia
- Score
- 83/100
- State rank
- #58
- US rank
- #1036
Category grades
Schools grade is shown separately in the Schools card above.
Census & demographics
- Census place
- Olympia, WA
- County
- Thurston County · 269,345 people
- City population
- 98,428
- Metro
- Olympia-Lacey-Tumwater, WA
- Population (ZIP)
- 35,398
- Household income
- $92,207
- Rent vs Own
- Severe rent burden
- 1811.0
Population outlook (Thurston County) Hauer SSP2
- Today (2025)
- 308,239 people
- By 2030
- 326,483 · +5.9%
- By 2040
- 359,890 · +16.8%
- By 2050
- 391,800 · +27.1%
- By 2075
- 468,024 · +51.8%
- By 2100
- 519,890 · +68.7%
Race, ethnicity, and origin ACS 2023
- Neighborhood character
- Predominantly White (71%)
- Race & ethnicity
- White 71% Two or more races 13% Hispanic / Latino 11% Asian 6% Black 3% Native American 1%
- Hispanic origin (detail)
- Mexican 3% Puerto Rican 4%
- Common ancestry
- Italian 5% Portuguese 4% Iranian 3%
- Foreign-born
- 8% · Vietnam, Canada, China
- Languages at home
- 90% English-only · Spanish 3% Vietnamese 2% Other Asian/Pacific 1%
Political lean MEDSL · Thurston
- 2024 margin
- Strong D (+20.4) · D 58.5% · R 38.1% · Other 3.5%
- 2008→2024 swing
- -1.3pp toward R · 2008: 21.7pp · 2024: 20.4pp
- All cycles
- 2024: D+20.4 2020: D+18.6 2016: D+15.4 2012: D+19.0 2008: D+21.7
Not yet ingested
- Civics
- —
Market trends
- HPI YoY
- ▲ 18.49%
- Current HPI
- 1056.49
- Rent YoY
- ▲ 3.16%
- Metro
- Olympia-Lacey-Tumwater, WA
- State GDP YoY
- ▲ 4.65%
- F500 in state
- 22
Industry mix (Fortune 500 HQ in WA)
| Industry | F500 HQs | Revenue |
|---|---|---|
| Retail | 2 | $269B |
|
||
| Technology / Retail | 1 | $638B |
|
||
| Technology | 1 | $245B |
|
||
| Telecommunications | 1 | $38B |
|
||
| Food / Beverage | 1 | $36B |
|
||
| Automotive / Trucks | 1 | $34B |
|
||
Price history
+84.9% since first listed6 events — show timeline
- 2026-04-29 Price Changed $710,000 NWMLS as Distributed by MLS Grid
- 2026-01-14 Price Changed $724,900 NWMLS as Distributed by MLS Grid
- 2025-11-07 Listed $749,900 NWMLS as Distributed by MLS Grid
- 2012-07-02 Sold (MLS) $318,000 NWMLS as Distributed by MLS Grid
- 2012-06-11 Pending — NWMLS as Distributed by MLS Grid
- 2012-03-02 Listed $384,000 NWMLS as Distributed by MLS Grid
Cash-flow waterfall
monthlySold comps — $/sqft
last 12 mo · ≤1 miLoading sold comps…