26891 Railroad St · Cole, OK
Flood risk 1/10 · Minimal
- FEMA flood zone
- X (unshaded)
- Chance of flooding over 30 yrs
- 0.0%
- Est. flood insurance / yr
- $507 – $1,088
Fire risk 3/10 · Minor
- Est. fire insurance / yr
- $2,463 – $4,575
Heat risk 6/10 · Moderate
- Hot days now (above 108°F)
- 7 days/yr
- Hot days in 30 yrs
- 19 days/yr
Wind risk 3/10 · Minor
- Chance of severe wind over 30 yrs
- 5.0%
Air-quality risk 2/10 · Minimal
- Unhealthy air days now
- 1 days/yr
- Unhealthy air days in 30 yrs
- 1 days/yr
Risk factors via First Street. Map © Google.
Why this score? — see what drove the B grade
The composite is a weighted blend of 9 inputs, each scored 0–100. Each bar is that input's sub-score; the figure is the points it added to the 100-point composite (weight × sub-score).
- Cash flow +30.0/30.0
- 1% rule +10.0/10.0
- DSCR +10.0/10.0
- ARV discount +7.5/15.0
- Appreciation +5.7/10.0
- Schools +3.4/10.0
- Livability +2.9/5.0
- Rent growth +2.5/5.0
- Condition / age +2.5/5.0
$77,900
🖨 Deal sheet 📄 Offer letter ✓ Due diligence
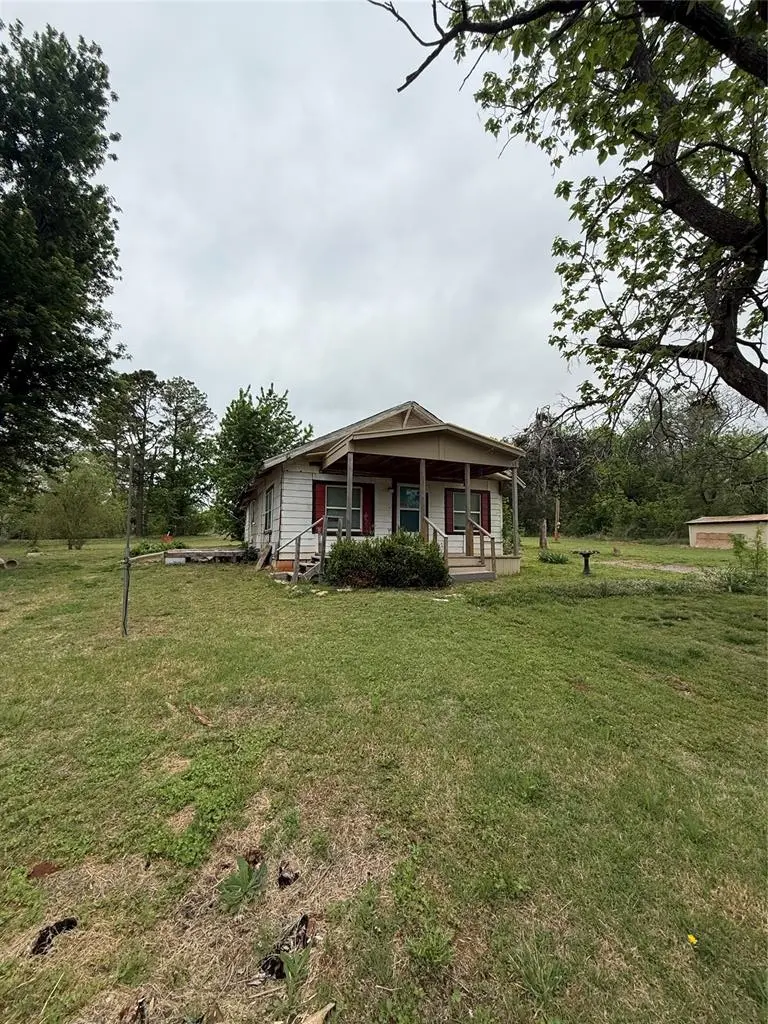
Listing remarks
Seller says, "Let's get it sold!" Established home in one of the best school districts in the state! This 2 bed 1 bath home is priced to sell! The home will be sold as-is with no repairs to be made but with a little work it could be perfect for an investment property or owner-occupant! The home did sustain some damage in a previous tornado but some repairs have been made. It is located on 9 lots and is next to the town park. Don't wait, schedule your private showing today!
Key facts
- 0.72 acre lot
- Built 1955
- Listed 71 days
Property features AI
Finance
- Other: Vacant and available; Living area listed as 1,000 (source: plans)
- Financial info: Sold as-is
- HOA & community: No mandatory association dues
Exterior
- Parking: Gravel parking
- Home design: Single-family residence; One level; Faces east; Residential property
- Construction: Frame construction; Composition roof; Conventional foundation; Built (existing)
- Exterior features: Covered porch; Outbuildings; Interior lot
Interior
- Kitchen: Gas range; Free-standing oven (gas)
- Bedrooms: 2 bedrooms
- Bathrooms: 1 full bathroom
- Heating & cooling: Other heating; Other cooling
- Interior features: In-law plan
Neighborhood map
What this means for you Summary
Snapshot
- This is a 2-bed/1.0-bath single-family listed at $78k.
Deal economics
- At list price, monthly cash flow is $525 ($6k/yr) — positive.
- The deal already cash-flows at list — no discount required.
- Meets the 1% rule at list price ($1k rent vs $78k).
- Recommended offer: $73k (6.0% below list) — sets the bar for market timing.
- Cap rate 14.4% vs local median 2.8% in Cole — top-decile yield for the area; either an underpriced asset or a hidden risk that comps aren't pricing in. Stress-test before assuming the spread holds.
Location & tenants
- Location reads 58/100 on livability (#439 in OK) — a working-class tenant base; expect higher turnover. Strengths: cost of living A+, housing A+, employment B+; Watch: crime C-, amenities F, commute F.
- Washington (rural): math 38% / reading 37% proficiency, ranked #20 of 270 in OK (top 7%) — families likely to look elsewhere, expect single-tenant / working-renter base with shorter leases.
- Zoned schools: Washington Es (math 43% / reading 43%, grade F, #80 of 845 statewide, top 10%, 565 students, 0% FRL); Washington Hs (math 32% / reading 37%, grade F, #48 of 447 statewide, top 14%, 353 students, 0% FRL) — zoned schools average 0% FRL vs 23% district-wide (23 pts lower); this property's tenant base skews higher-income than the district average.
- Market conditions: 507 active listings in the ZIP; solid renter incomes; 334 units permitted in McClain County in 2024 (0 in 5+ unit buildings).
- This rent is only 17% of the median local income ($90k/yr) — well below the 30% rent-burden line; pricing power to push rent on renewal without tenant pushback.
Forward outlook
- In year one you build about $2k of equity ($539 loan paydown + $1k appreciation (1.4% local appreciation)).
- McClain County population projected at +44% by 2050 — long-run rental-demand tailwind backs the buy-and-hold thesis.
- At projected returns (1.4% appreciation + 3.0% rent growth), your $22k cash investment doubles in ~3 years — after that, you're playing with house money.
Negotiation context
- It's been on market 71 days — a 6% lower offer ($73k) is reasonable based on typical stale-listing flexibility.
Risks & watch-outs
- Watch-outs: built in 1955 — expect roof / HVAC / electrical / plumbing capex.
- Climate carrying-cost: extreme-heat days projected 7→19/yr by 2055 (HVAC capex compounding) — expect insurance premiums to compound above CPI over the hold.
Questions for the listing agent
- It's been on market 71 days. Have you received any prior offers? Is the seller open to a 6% concession, seller financing, or rate buy-down credit?
- Built in 1955 — when were the roof, HVAC, electrical panel, plumbing, and water heater last replaced?
- Why hasn't it sold? Are there any deal-killer items the seller is aware of (foundation, flood, title, zoning, code violations)?
- Is there a deadline driving the sale (1031 exchange, divorce, estate, relocation)? That informs how much negotiation room exists.
- Schools are F-rated, which usually means shorter tenancies and higher turnover. Who's the typical renter profile here, and what's been the actual vacancy rate?
- What's the average days-on-market for RENTAL listings here right now (not sales)? A rising rental-DOM trend means longer vacancies and softer asking-rent achievability than the comps imply.
- What's the recent tenant-quality profile in this submarket — average credit score on applications, eviction rate, late-payment / NSF rate, and stable-employment percentage? A property-management company in the area should have these aggregated.
- How much new for-sale + rental construction is in the pipeline within 1–3 miles? Heavy new supply typically softens prices + rents 12–24 months out; constrained supply supports both.
Investment metrics
- 1% rule
- 1.62% ✓
- Cap rate
- 14.38%
- Cash-on-cash
- 28.89%
- DSCR
- 2.29
- GRM
- 5.1
CMA / ARV
No comps found within radius.
Projected returns pro-forma
1.45% appreciation · 3.0% rent growth · sell at horizon
- IRR
- 32.0%
- Equity multiple
- 2.68×
- Total profit
- $36,590
- Equity at exit
- $28,416
- IRR
- 33.9%
- Equity multiple
- 5.20×
- Total profit
- $91,613
- Equity at exit
- $39,213
Cash invested: $21,812 (down + closing). Projections, not guarantees.
Landlord ↔ Tenant lean methodology
- Overall (STATE)
- 83 Strongly Landlord-Friendly
- State Oklahoma
- 83 Strongly Landlord-Friendly · R+20
- County
- — inherits STATE
- City
- — inherits STATE
ZIP-level market 73010
- Home prices YoY
- 0.5%
- Active inventory
- 507
- Price-to-rent
- 5.1×
Monthly cashflow live
- Estimated rent
- $1,261 medium interval (Pro) →
- Mortgage (P&I)
- −$409
- Tax from tax record
- −$30 /mo · $366/yr
- Insurance
- −$32
- HOA
- −$0
- Vacancy / Maint / Mgmt
- −$265
- Net cashflow
- $525
Break-even live
UW: 25.0% down · 7.5% · 30yr · 1.5% tax · 5.0% vac · 8.0% maint · 8.0% mgmt
Financing live
Cash to close
- Down payment
- $19,475
- Closing costs
- $2,337
- Reserves months
- —
- Total cash needed
- —
Loan-product check · same deal, 3 products live
Conventional
25% down · 7.5% · 30yr
- Down + closing
- —
- Monthly P&I
- —
- Monthly cashflow
- —
- DSCR
- —
- Eligible?
- —
Personal DTI + credit; lowest rate.
DSCR
20% down · 8.5% · 30yr
- Down + closing
- —
- Monthly P&I
- —
- Monthly cashflow
- —
- DSCR
- —
- Eligible?
- —
No personal income docs; deal must DSCR.
Hard money
10% down · 12.0% · 12mo
- Down + closing
- —
- Monthly P&I
- —
- Monthly cashflow
- —
- DSCR
- —
- Eligible?
- —
Short-term bridge; refi at stabilization.
Listing history 17 events
-
2026-06-18days on market $77,900 Active 71 DOM
-
2026-06-17days on market $77,900 Active 70 DOM
-
2026-06-16days on market $77,900 Active 69 DOM
-
2026-06-15days on market $77,900 Active 68 DOM
-
2026-06-13pricedays on market $77,900 Active 66 DOM
-
2026-06-09days on market $81,900 Active 62 DOM
-
2026-06-08days on market $81,900 Active 61 DOM
-
2026-06-07pricedays on market $81,900 Active 60 DOM
-
2026-06-03days on market $85,900 Active 56 DOM
-
2026-06-02days on market $85,900 Active 55 DOM
-
2026-06-01days on market $85,900 Active 54 DOM
-
2026-05-31days on market $85,900 Active 53 DOM
-
2026-05-22price $85,900
-
2026-05-15price $89,900
-
2026-05-09price $93,900
-
2026-04-19price $94,900
-
2026-04-08$100,000 Active
ⓘ Source: listings_history table (triggers on properties + properties_extension) + one-shot
backfill from property_details.listing_events for pre-trigger history.
Tax reassessment forecast OK · Resets to sale price
- Current annual tax
- $366 · $30/mo
- Projected year-2 tax
- $701 · $58/mo
- Expected delta
- +$335/yr (+$28/mo · 91.6%)
ⓘ Screening estimate from a state-policy table — verify with the county assessor before closing.
Climate risk First Street
- Flood 1/10 Low FEMA zone X (unshaded) · 0% chance over 30 yrs
- Wildfire 3/10 Moderate
- Heat 6/10 Major 7 d/yr ≥108°F today · 19 d/yr by 30 yrs out
- Wind 3/10 Moderate 5% chance of damaging wind over 30 yrs
- Air quality 2/10 Low 1 unhealthy d/yr today · 1 by 30 yrs out
Nearby sold comps map
Loading sold comps map…
Walkable amenities ~0.75 mi
Loading nearby amenities…
Taxation est. · year 1
- Rental income
- $15,138
- − Mortgage interest
- −$4,364
- − Property taxes
- −$366
- − Insurance
- −$390
- − Repairs & maintenance
- −$1,211
- − Management
- −$1,211
- − Depreciation
- −$2,266
- Taxable income
- $5,330
- Est. tax owed @ 24.0%
- −$1,279
- After-tax cash flow
- $5,022/yr
For passive investors: Depreciation is non-cash, so a rental often shows a tax loss while cash-flowing — sheltering income. Rental losses are passive: they offset passive income freely, and up to $25,000/yr can offset ordinary (W-2) income if you actively participate and your MAGI is under $100k (phasing out to $0 by $150k); unused losses carry forward. On sale, claimed depreciation is recaptured at up to 25%, and gains may owe capital-gains tax (a 1031 exchange can defer both). Figures are a year-1 estimate at your 24.0% rate — not tax advice; consult a CPA.
Schools (NCES district)
- District
- Washington
- NCES district ID
- 4031710
- Math proficiency
- 38% ▼ -2.00%
- Reading proficiency
- 37% ▼ -7.00%
- Median HH income
- $63,564
- Composite
- 33.73/100
- National rank
- #5375
- State rank
- #20 of 270 in OK
Livability — Cole
- Score
- 58/100
- State rank
- #439
- US rank
- #21241
Category grades
Schools grade is shown separately in the Schools card above.
Census & demographics
- Census place
- Cole, OK
- County
- McClain County · 33,206 people
- Metro
- Oklahoma City, OK
- Population (ZIP)
- 21,521
- Household income
- $90,110
- Rent vs Own
- Severe rent burden
- 239.0
Population outlook (McClain County) Hauer SSP2
- Today (2025)
- 46,053 people
- By 2030
- 50,081 · +8.7%
- By 2040
- 58,231 · +26.4%
- By 2050
- 66,276 · +43.9%
- By 2075
- 86,558 · +88.0%
- By 2100
- 100,421 · +118.1%
Race, ethnicity, and origin ACS 2023
- Neighborhood character
- Predominantly White (81%)
- Race & ethnicity
- White 81% Two or more races 10% Hispanic / Latino 6% Native American 4%
- Hispanic origin (detail)
- Mexican 5%
- Common ancestry
- Italian 2% Lithuanian 2% Slovak 2%
- Foreign-born
- 1% · Canada
- Languages at home
- 97% English-only · Spanish 3%
Political lean MEDSL · McClain
- 2024 margin
- Solid R (+60.6) · D 18.8% · R 79.5% · Other 1.7%
- 2008→2024 swing
- -8.8pp toward R · 2008: -51.8pp · 2024: -60.6pp
- All cycles
- 2024: R+60.6 2020: R+60.9 2016: R+60.9 2012: R+55.4 2008: R+51.8
Not yet ingested
- Civics
- —
Market trends
- HPI YoY
- ▲ 1.45%
- Current HPI
- 285.8653
- Rent YoY
- —
- Metro
- Oklahoma City, OK
- State GDP YoY
- ▲ 1.55%
- F500 in state
- 6
Industry mix (Fortune 500 HQ in OK)
| Industry | F500 HQs | Revenue |
|---|---|---|
| Energy | 3 | $48B |
|
||
Price history
-14.1% since first listed5 events — show timeline
- 2026-05-22 Price Changed $85,900 MLSOK
- 2026-05-15 Price Changed $89,900 MLSOK
- 2026-05-09 Price Changed $93,900 MLSOK
- 2026-04-19 Price Changed $94,900 MLSOK
- 2026-04-08 Listed $100,000 MLSOK
Property tax history
+6.6%/yrLatest (2025): $366 · +4.0% YoY. Source: county tax records.
Cash-flow waterfall
monthlySold comps — $/sqft
last 12 mo · ≤1 miLoading sold comps…