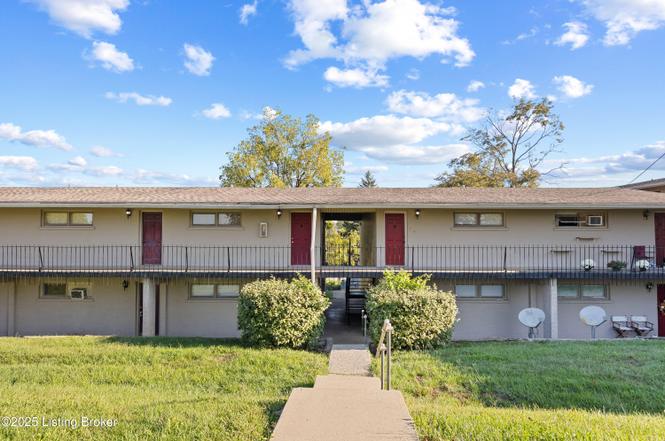
200 Thistlewood Ave #602 · Frankfort, KY
Flood risk No data
- FEMA flood zone
- —
- Chance of flooding over 30 yrs
- —
- Est. flood insurance / yr
- —
Fire risk No data
- Est. fire insurance / yr
- —
Heat risk No data
- Hot days now (above threshold)
- —
- Hot days in 30 yrs
- —
Wind risk No data
- Chance of severe wind over 30 yrs
- —
Air-quality risk No data
- Unhealthy air days now
- —
- Unhealthy air days in 30 yrs
- —
Risk factors via First Street. Map © Google.
Why this score? — see what drove the D grade
The composite is a weighted blend of 9 inputs, each scored 0–100. Each bar is that input's sub-score; the figure is the points it added to the 100-point composite (weight × sub-score).
- Cash flow +12.1/30.0
- ARV discount +7.5/15.0
- Rent growth +4.1/5.0
- 1% rule +4.0/10.0
- Livability +3.7/5.0
- DSCR +3.6/10.0
- Schools +2.7/10.0
- Condition / age +2.5/5.0
- Appreciation +0.0/10.0
$90,000
🖨 Deal sheet 📄 Offer letter ✓ Due diligence
Listing remarks
Whether you are wanting low maintenance, a starter home, gearing into rental property or adding to your portfolio, this may be the on for you. With an open concept and great use of closet placements, this 1 bed 1 bath condo feels a lot bigger. Pool and laundry on site. HOA fees covers water, mowing and snow removal etc.
Key facts
- $130 HOA
- Community pool
- Listed 100 days
Property features AI
Finance
- Other: Building has 1 floor and contains 1 condo unit; Living area reported as 501
- HOA & community: Association fee required; Monthly maintenance fee charged ($130 reported)
Exterior
- Parking: No assigned parking
- Utilities: Electricity connected
- Home design: Condominium; Single-story building; Open plan architectural style; Unit located at 602
- Construction: Reported year built not provided; Other roof material
- Exterior features: Condominium unit (unit 602); Pets allowed with restrictions; Pool in association
Interior
- Kitchen: Kitchen on first floor
- Bedrooms: 1 bedroom (first floor)
- Bathrooms: 1 full bathroom
- Heating & cooling: Electric heating; Cooling available
- Interior features: Open plan layout; 4 total rooms; No basement; No fireplaces; 1 closet
- Laundry & utility: No first-floor laundry
Neighborhood map
What this means for you Summary
Snapshot
- This is a 1-bed/1.0-bath other listed at $90k.
Deal economics
- At list price, monthly cash flow is $-19 ($-234/yr) — negative.
- To cash-flow at today's rent, offer at most $87k (3.8% below list).
- To meet the 1% rule (rent ≥ 1% of price), the offer needs to be $81k (10.0% below list).
- Recommended offer: $81k (10.0% below list) — sets the bar for 1% rule.
- Cap rate 6.0% vs local median 3.3% in Frankfort — top-decile yield for the area; either an underpriced asset or a hidden risk that comps aren't pricing in. Stress-test before assuming the spread holds.
Location & tenants
- Location reads 74/100 on livability (#111 in KY, #4,772 nationally) — a middle-class / working-renter tenant base. Strengths: cost of living A+, housing A+, crime B; Watch: employment C-, schools D, amenities F.
- Franklin County (town): math 25% / reading 37% proficiency, ranked #89 of 165 in KY (top 54%) — families likely to look elsewhere, expect single-tenant / working-renter base with shorter leases.
- Market conditions: Rents rising fast (+6.5%/yr); 303 active listings in the ZIP; 2 comparable units currently listed for rent nearby; 123 units permitted in Franklin County in 2024 (0 in 5+ unit buildings).
- This rent is only 15% of the median local income ($66k/yr) — well below the 30% rent-burden line; pricing power to push rent on renewal without tenant pushback.
Forward outlook
- Local home prices are declining (-3.0%/yr); year-one equity from $622 of loan paydown is wiped out by about $3k of value loss. Plan a longer hold.
- Franklin County population projected at +7% by 2050 — modest demand growth; plan on rents tracking national, not racing it.
Negotiation context
- It's been on market 101 days — a 9% lower offer ($82k) is reasonable based on typical stale-listing flexibility.
- 2 sale attempts with the ask held roughly flat each time — persistent listings suggest the price (not the market) is what's stuck; bring a comps-based counter.
- Current owner paid $34k; list at $90k implies a 165% gain — meaningful room to come down on a strong offer.
Questions for the listing agent
- What do current leases actually rent for vs. the listed asking? Can we see a recent rent roll and the last 12 months of T-12 income?
- It's been on market 101 days. Have you received any prior offers? Is the seller open to a 10% concession, seller financing, or rate buy-down credit?
- What does the HOA fee cover, when was the last increase, and are there any pending special assessments or reserve-fund shortfalls?
- Why hasn't it sold? Are there any deal-killer items the seller is aware of (foundation, flood, title, zoning, code violations)?
- Is there a deadline driving the sale (1031 exchange, divorce, estate, relocation)? That informs how much negotiation room exists.
- Schools are D-rated, which usually means shorter tenancies and higher turnover. Who's the typical renter profile here, and what's been the actual vacancy rate?
- The area grade is low — what's the realistic commute time and amenity access for the typical tenant pool here? Any planned neighborhood developments (good or bad) we should know about?
- What's the average days-on-market for RENTAL listings here right now (not sales)? A rising rental-DOM trend means longer vacancies and softer asking-rent achievability than the comps imply.
- What's the recent tenant-quality profile in this submarket — average credit score on applications, eviction rate, late-payment / NSF rate, and stable-employment percentage? A property-management company in the area should have these aggregated.
- How much new for-sale + rental construction is in the pipeline within 1–3 miles? Heavy new supply typically softens prices + rents 12–24 months out; constrained supply supports both.
Investment metrics
- 1% rule
- 0.90% ✗
- Cap rate
- 6.03%
- Cash-on-cash
- -0.93%
- DSCR
- 0.96
- GRM
- 9.3
CMA / ARV
No comps found within radius.
Projected returns pro-forma
-3.0% appreciation · 6.55% rent growth · sell at horizon
- IRR
- -13.7%
- Equity multiple
- 0.49×
- Total profit
- $-12,792
- Equity at exit
- $13,419
- IRR
- 0.3%
- Equity multiple
- 1.03×
- Total profit
- $637
- Equity at exit
- $7,782
Cash invested: $25,200 (down + closing). Projections, not guarantees.
Landlord ↔ Tenant lean methodology
- Overall (STATE)
- 83 Strongly Landlord-Friendly
- State Kentucky
- 83 Strongly Landlord-Friendly · R+16
- County
- — inherits STATE
- City
- — inherits STATE
ZIP-level market 40601
- Home prices YoY
- -26.1%
- Rents YoY
- 6.5%
- Active inventory
- 303
- Price-to-rent
- 9.3×
Monthly cashflow live
- Estimated rent
- $810 medium interval (Pro) →
- Mortgage (P&I)
- −$472
- Tax from tax record
- −$20 /mo · $240/yr
- Insurance
- −$38
- HOA
- −$130
- Vacancy / Maint / Mgmt
- −$170
- Net cashflow
- $-19
Break-even live
UW: 25.0% down · 7.5% · 30yr · 1.5% tax · 5.0% vac · 8.0% maint · 8.0% mgmt
Financing live
Cash to close
- Down payment
- $22,500
- Closing costs
- $2,700
- Reserves months
- —
- Total cash needed
- —
Loan-product check · same deal, 3 products live
Conventional
25% down · 7.5% · 30yr
- Down + closing
- —
- Monthly P&I
- —
- Monthly cashflow
- —
- DSCR
- —
- Eligible?
- —
Personal DTI + credit; lowest rate.
DSCR
20% down · 8.5% · 30yr
- Down + closing
- —
- Monthly P&I
- —
- Monthly cashflow
- —
- DSCR
- —
- Eligible?
- —
No personal income docs; deal must DSCR.
Hard money
10% down · 12.0% · 12mo
- Down + closing
- —
- Monthly P&I
- —
- Monthly cashflow
- —
- DSCR
- —
- Eligible?
- —
Short-term bridge; refi at stabilization.
Rent comps 2 comps
| Address | Beds | Baths | Sqft | Rent | $/sqft | DOM | Units | Dist |
|---|---|---|---|---|---|---|---|---|
| 855 Louisville Rd Frankfort, KY | — | 1.0 | 380 | $695 | $1.83 | 12d | 1 | 0.10mi |
| 401 Murray St Frankfort, KY | 1.0 | 1.0 | 600 | $725 | $1.21 | 23d | 1 | 1.04mi |
HOA detail
- Monthly dues
- $130 · $1,560/yr
- Likely covers
- watersnow removalpool
Listing history 25 events
-
2026-06-19days on market $90,000 Active 101 DOM
-
2026-06-18days on market $90,000 Active 100 DOM
-
2026-06-17days on market $90,000 Active 99 DOM
-
2026-06-16days on market $90,000 Active 98 DOM
-
2026-06-15days on market $90,000 Active 97 DOM
-
2026-06-14days on market $90,000 Active 95 DOM
-
2026-06-12days on market $90,000 Active 94 DOM
-
2026-06-09days on market $90,000 Active 91 DOM
-
2026-06-08days on market $90,000 Active 90 DOM
-
2026-06-07days on market $90,000 Active 89 DOM
-
2026-06-05days on market $90,000 Active 86 DOM
-
2026-06-03days on market $90,000 Active 85 DOM
-
2026-06-02days on market $90,000 Active 84 DOM
-
2026-06-01days on market $90,000 Active 83 DOM
-
2026-05-31days on market $90,000 Active 82 DOM
-
2026-05-30days on market $90,000 Active 81 DOM
-
2026-04-29price $90,000
-
2026-03-10$93,000 Active
-
2026-03-03historical
-
2025-11-07price $95,000
-
2025-10-03$100,000 Active
-
2007-11-29soldstatus $34,000
-
2002-10-22soldstatus $23,000
-
1989-07-28soldstatus $18,500
-
1980-10-01soldstatus $22,950
ⓘ Source: listings_history table (triggers on properties + properties_extension) + one-shot
backfill from property_details.listing_events for pre-trigger history.
Tax reassessment forecast KY · Resets to sale price
- Current annual tax
- $240 · $20/mo
- Projected year-2 tax
- $774 · $64/mo
- Expected delta
- +$534/yr (+$45/mo · 223.0%)
ⓘ Screening estimate from a state-policy table — verify with the county assessor before closing.
Nearby sold comps map
Loading sold comps map…
Walkable amenities ~0.75 mi
Loading nearby amenities…
Taxation est. · year 1
- Rental income
- $9,721
- − Mortgage interest
- −$5,041
- − Property taxes
- −$240
- − Insurance
- −$450
- − Repairs & maintenance
- −$778
- − Management
- −$778
- − HOA
- −$1,560
- − Depreciation
- −$2,618
- Taxable loss
- −$1,743
- Est. tax savings @ 24.0%
- +$418
- After-tax cash flow
- $185/yr
For passive investors: Depreciation is non-cash, so a rental often shows a tax loss while cash-flowing — sheltering income. Rental losses are passive: they offset passive income freely, and up to $25,000/yr can offset ordinary (W-2) income if you actively participate and your MAGI is under $100k (phasing out to $0 by $150k); unused losses carry forward. On sale, claimed depreciation is recaptured at up to 25%, and gains may owe capital-gains tax (a 1031 exchange can defer both). Figures are a year-1 estimate at your 24.0% rate — not tax advice; consult a CPA.
Schools (NCES district)
- District
- Franklin County
- NCES district ID
- 2102010
- Math proficiency
- 25% ▼ -15.00%
- Reading proficiency
- 37% ▼ -14.00%
- Median HH income
- $50,879
- Composite
- 27.07/100
- National rank
- #7049
- State rank
- #89 of 165 in KY
Livability — Frankfort
- Score
- 74/100
- State rank
- #111
- US rank
- #4772
Category grades
Schools grade is shown separately in the Schools card above.
Census & demographics
- Census place
- Frankfort, KY
- County
- Franklin County · 51,893 people
- City population
- 51,893
- Metro
- Frankfort, KY
- Population (ZIP)
- 51,893
- Household income
- $65,732
- Rent vs Own
- Severe rent burden
- 1621.0
Population outlook (Franklin County) Hauer SSP2
- Today (2025)
- 52,996 people
- By 2030
- 54,049 · +2.0%
- By 2040
- 55,561 · +4.8%
- By 2050
- 56,677 · +6.9%
- By 2075
- 59,458 · +12.2%
- By 2100
- 58,885 · +11.1%
Race, ethnicity, and origin ACS 2023
- Neighborhood character
- Predominantly White (81%)
- Race & ethnicity
- White 81% Black 9% Two or more races 5% Hispanic / Latino 4% Asian 2%
- Common ancestry
- Italian 3% Slovak 2% Lithuanian 1%
- Foreign-born
- 4% · Canada
- Languages at home
- 94% English-only · Spanish 3% Other Asian/Pacific 1% Tagalog/Filipino 1%
Political lean MEDSL · Franklin
- 2024 margin
- Toss-up / Even · D 46.6% · R 51.4% · Other 2.0%
- 2008→2024 swing
- -4.2pp toward R · 2008: -0.6pp · 2024: -4.8pp
- All cycles
- 2024: R+4.8 2020: R+0.9 2016: R+4.6 2012: D+0.8 2008: R+0.6
Not yet ingested
- Civics
- —
Market trends
- HPI YoY
- ▼ -87.43%
- Current HPI
- 248.0324
- Rent YoY
- ▲ 6.55%
- Metro
- Frankfort, KY
- State GDP YoY
- ▲ 1.81%
- F500 in state
- 4
Industry mix (Fortune 500 HQ in KY)
| Industry | F500 HQs | Revenue |
|---|---|---|
| Healthcare | 1 | $118B |
|
||
| Food / Beverage | 1 | $7B |
|
||
Price history
+292.2% since first listed9 events — show timeline
- 2026-04-29 Price Changed $90,000 Metro Search MLS
- 2026-03-10 Listed $93,000 Metro Search MLS
- 2026-03-03 Listing Removed — Metro Search MLS
- 2025-11-07 Price Changed $95,000 Metro Search MLS
- 2025-10-03 Listed $100,000 Metro Search MLS
- 2007-11-29 Sold (Public Records) $34,000 Public Records
- 2002-10-22 Sold (Public Records) $23,000 Public Records
- 1989-07-28 Sold (Public Records) $18,500 Public Records
- 1980-10-01 Sold (Public Records) $22,950 Public Records
Property tax history
+6.3%/yrLatest (2025): $240 · +1.3% YoY. Source: county tax records.
Cash-flow waterfall
monthlySold comps — $/sqft
last 12 mo · ≤1 miLoading sold comps…