216 Oceans Blvd #216 · Berkshire Lakes, FL
Flood risk 5/10 · Moderate
- FEMA flood zone
- X (shaded)
- Chance of flooding over 30 yrs
- 0.48%
- Est. flood insurance / yr
- $507 – $1,088
Fire risk 1/10 · Minimal
- Est. fire insurance / yr
- $947 – $1,759
Heat risk 10/10 · Severe
- Hot days now (above 107°F)
- 7 days/yr
- Hot days in 30 yrs
- 27 days/yr
Wind risk 10/10 · Severe
- Chance of severe wind over 30 yrs
- 99.0%
Air-quality risk 2/10 · Minimal
- Unhealthy air days now
- 2 days/yr
- Unhealthy air days in 30 yrs
- 2 days/yr
Risk factors via First Street. Map © Google.
Why this score? — see what drove the B- grade
The composite is a weighted blend of 9 inputs, each scored 0–100. Each bar is that input's sub-score; the figure is the points it added to the 100-point composite (weight × sub-score).
- Cash flow +27.5/30.0
- DSCR +9.7/10.0
- 1% rule +8.7/10.0
- ARV discount +7.5/15.0
- Schools +5.0/10.0
- Condition / age +3.8/5.0
- Livability +2.5/5.0
- Rent growth +2.2/5.0
- Appreciation +0.0/10.0
$168,000
🖨 Deal sheet 📄 Offer letter ✓ Due diligence
Listing remarks
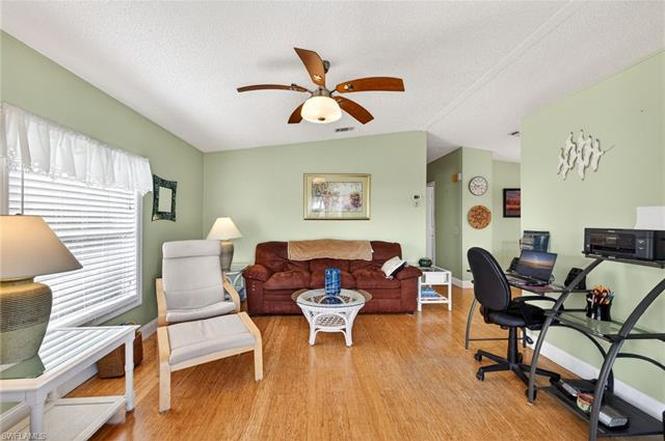
Welcome to easy Florida living in Windjammer Village of Naples, a popular 55+ community known for its friendly atmosphere and active lifestyle. This well-maintained two-bedroom, two-bath home offers a comfortable and thoughtfully updated retreat that’s perfect for seasonal or year-round living. Over the years, the owners have made numerous improvements, including updated siding, windows, flooring, and bathrooms, creating a move-in-ready space that feels fresh and inviting. Just under 800 square feet, the home is efficiently designed to maximize comfort and functionality, making it both cozy and practical. Whether you’re searching for a winter escape from colder northern climates
Key facts
- Updated siding
- Updated windows
- Updated bathrooms
Tags
Property features AI
Finance
- Other: Part of a complex with 212 units; single unit building and single-floor unit
- HOA & community: Monthly condo fee of $162; Total annual recurring fees $1,944; Total one-time fees $100; Professional management; Maintenance includes fidelity bond, lawn/land maintenance, recreation facilities, reserves, and street maintenance; Community amenities: community pool, spa/hot tub, tennis court, pickleball, bocce court, shuffleboard, fishing pier, sidewalks, streetlights
Exterior
- Parking: Attached carport with 2 spaces; Private road access
- Security: Gated community
- Utilities: Central water; Central sewer; Electric service (central)
- Home design: Residential manufactured home; 1 story / ranch; Rear exposure: west; Located in Windjammer Village of Naples (mobile/manufactured community)
- Construction: Manufactured construction; Vinyl siding exterior; Roof over; Built in 1989
- Exterior features: Fenced lot; Landscaped area views; Partial building views; Central irrigation
Interior
- Kitchen: Dishwasher; Microwave; Self-cleaning oven; Refrigerator/Freezer
- Bedrooms: 2 bedrooms; Master bedroom on ground level
- Flooring: Vinyl; Wood
- Bathrooms: 2 full bathrooms; Master bath with combo tub and shower
- Heating & cooling: Central electric heat; Central electric air conditioning; Ceiling fans
- Interior features: Built-in cabinets; Window coverings; Dining area open to family/great room; Screened lanai/porch; Furnished; 4 ceiling fans
- Laundry & utility: Washer; Dryer; Laundry located in garage
Neighborhood map
What this means for you Summary
Snapshot
- This is a 2-bed/2.0-bath manufactured listed at $168k. Condition is rated good.
Deal economics
- At list price, monthly cash flow is $499 ($6k/yr) — positive.
- The deal already cash-flows at list — no discount required.
- Meets the 1% rule at list price ($2k rent vs $168k).
- Recommended offer: $158k (6.0% below list) — sets the bar for market timing.
Location & tenants
- Location reads: area grade B — affects rentability + tenant quality, not the cash-flow math above.
- Collier (suburban): math 60% / reading 56% proficiency, ranked #16 of 73 in FL (top 22%) — acceptable for families but not a draw, mixed tenant base, ~2y average lease.
- Market conditions: Rents soft (-1.1%/yr); 436 active listings in the ZIP; 30 comparable units currently listed for rent nearby; rentals at typical pace (median 24d on market — plan ~3-4 weeks tenant-placement turnaround); 3,520 units permitted in Collier County in 2024 (959 in 5+ unit buildings).
- This rent runs 39% of the median local income ($72k/yr) — at the standard rent-burdened threshold; future hikes will face affordability resistance.
Forward outlook
- Local home prices are declining (-3.0%/yr); year-one equity from $1k of loan paydown is wiped out by about $5k of value loss. Plan a longer hold.
- Collier County population projected at +30% by 2050 — long-run rental-demand tailwind backs the buy-and-hold thesis.
Negotiation context
- It's been on market 87 days — a 6% lower offer ($158k) is reasonable based on typical stale-listing flexibility.
Risks & watch-outs
- Climate carrying-cost: moderate flood risk; severe wind risk, 99% chance of damaging wind over 30y; extreme-heat days projected 7→27/yr by 2055 (HVAC capex compounding) — expect insurance premiums to compound above CPI over the hold.
Questions for the listing agent
- It's been on market 87 days. Have you received any prior offers? Is the seller open to a 6% concession, seller financing, or rate buy-down credit?
- What does the HOA fee cover, when was the last increase, and are there any pending special assessments or reserve-fund shortfalls?
- Why hasn't it sold? Are there any deal-killer items the seller is aware of (foundation, flood, title, zoning, code violations)?
- Is there a deadline driving the sale (1031 exchange, divorce, estate, relocation)? That informs how much negotiation room exists.
- What's the average days-on-market for RENTAL listings here right now (not sales)? A rising rental-DOM trend means longer vacancies and softer asking-rent achievability than the comps imply.
- What's the recent tenant-quality profile in this submarket — average credit score on applications, eviction rate, late-payment / NSF rate, and stable-employment percentage? A property-management company in the area should have these aggregated.
- How much new for-sale + rental construction is in the pipeline within 1–3 miles? Heavy new supply typically softens prices + rents 12–24 months out; constrained supply supports both.
Investment metrics
- 1% rule
- 1.37% ✓
- Cap rate
- 9.86%
- Cash-on-cash
- 12.72%
- DSCR
- 1.57
- GRM
- 6.1
CMA / ARV
No comps found within radius.
Projected returns pro-forma
-3.0% appreciation · 0.0% rent growth · sell at horizon
- IRR
- -1.2%
- Equity multiple
- 0.96×
- Total profit
- $-2,084
- Equity at exit
- $25,049
- IRR
- 4.6%
- Equity multiple
- 1.29×
- Total profit
- $13,513
- Equity at exit
- $14,526
Cash invested: $47,040 (down + closing). Projections, not guarantees.
Landlord ↔ Tenant lean methodology
- Overall (STATE)
- 87 Strongly Landlord-Friendly
- State Florida
- 87 Strongly Landlord-Friendly · R+3
- County
- — inherits STATE
- City
- — inherits STATE
ZIP-level market 34104
- Rents YoY
- -1.1%
- Active inventory
- 436
- Price-to-rent
- 6.1×
Monthly cashflow live
- Estimated rent
- $2,306 high interval (Pro) →
- Mortgage (P&I)
- −$881
- Tax est. 1.5%
- −$210 /mo · $2,520/yr
- Insurance
- −$70
- HOA
- −$162
- Vacancy / Maint / Mgmt
- −$484
- Net cashflow
- $499
Break-even live
UW: 25.0% down · 7.5% · 30yr · 1.5% tax · 5.0% vac · 8.0% maint · 8.0% mgmt
Financing live
Cash to close
- Down payment
- $42,000
- Closing costs
- $5,040
- Reserves months
- —
- Total cash needed
- —
Loan-product check · same deal, 3 products live
Conventional
25% down · 7.5% · 30yr
- Down + closing
- —
- Monthly P&I
- —
- Monthly cashflow
- —
- DSCR
- —
- Eligible?
- —
Personal DTI + credit; lowest rate.
DSCR
20% down · 8.5% · 30yr
- Down + closing
- —
- Monthly P&I
- —
- Monthly cashflow
- —
- DSCR
- —
- Eligible?
- —
No personal income docs; deal must DSCR.
Hard money
10% down · 12.0% · 12mo
- Down + closing
- —
- Monthly P&I
- —
- Monthly cashflow
- —
- DSCR
- —
- Eligible?
- —
Short-term bridge; refi at stabilization.
Rent comps 30 comps
| Address | Beds | Baths | Sqft | Rent | $/sqft | DOM | Units | Dist |
|---|---|---|---|---|---|---|---|---|
| 7065 Dennis Cir #302 Naples, FL | 2.0 | 2.0 | 1097 | $4,000 | $3.65 | 21d | 1 | 0.80mi |
| 1051 Eastham Way Unit B104 Naples, FL | 2.0 | 2.0 | 1091 | $4,300 | $3.94 | 14d | 1 | 0.84mi |
| 1075 Foxfire Ln Naples, FL | 2.0 | 2.0 | 1092 | $3,300 | $3.02 | 23d | 3 | 0.96mi |
| 529 Mardel Dr #311 Naples, FL | 2.0 | 2.0 | 1093 | $3,500 | $3.20 | 23d | 1 | 0.98mi |
| 1787 Reuven Cir Unit 1001 Naples, FL | 2.0 | 2.0 | 1112 | $1,300 | $1.17 | 14d | 1 | 1.10mi |
| 7320 Glenmoor Ln Unit 2206 Naples, FL | 2.0 | 2.0 | 1053 | $6,000 | $5.70 | 14d | 1 | 1.11mi |
| 2972 Kings Lake Blvd #2972 Naples, FL | 2.0 | 2.0 | 1100 | $3,000 | $2.73 | 23d | 1 | 1.22mi |
| 7380 Saint Ives Way Naples, FL | 2.0 | 2.0 | 1026 | $4,400 | $4.29 | 23d | 2 | 1.23mi |
| 1701 Courtyard Way Naples, FL | 2.0 | 2.0 | 1072 | $1,990 | $1.86 | 23d | 1 | 1.27mi |
| 7360 Saint Ives Way #2205 Naples, FL | 2.0 | 2.0 | 1053 | $1,925 | $1.83 | 23d | 1 | 1.28mi |
| 1933 Courtyard Way Unit D-103 Naples, FL | 2.0 | 2.0 | 947 | $1,850 | $1.95 | 14d | 1 | 1.29mi |
| 116 Santa Clara Dr #12 Naples, FL | 1.0 | 1.0 | 745 | $1,600 | $2.15 | 14d | 1 | 1.30mi |
| 150 Santa Clara Dr #15 Naples, FL | 1.0 | 1.0 | 700 | $1,590 | $2.27 | 23d | 1 | 1.31mi |
| 150 Santa Clara Dr Naples, FL | 1.0 | 1.0 | 637 | $1,375 | $2.16 | 14d | 1 | 1.31mi |
| 1895 Courtyard Way #103 Naples, FL | 3.0 | 2.0 | 1046 | $2,200 | $2.10 | 21d | 1 | 1.32mi |
| 108 Santa Clara Dr #4 Naples, FL | 2.0 | 2.0 | 974 | $1,950 | $2.00 | 14d | 1 | 1.35mi |
| 161 Santa Clara Dr #14 Naples, FL | 2.0 | 2.0 | 1043 | $2,000 | $1.92 | 21d | 1 | 1.35mi |
| 185 Santa Clara Dr #13 Naples, FL | 1.0 | 1.0 | 634 | $1,600 | $2.52 | 14d | 1 | 1.35mi |
| 1865 Florida Club Dr Naples, FL | 2.0–3.0 | 1.0–2.0 | 1214 | $1,750 | $1.44 | 23d | 2 | 1.35mi |
| 153 Santa Clara Dr #12 Naples, FL | 1.0 | 1.0 | 634 | $1,450 | $2.29 | 23d | 1 | 1.35mi |
| 190 Santa Clara Dr Unit 190-4 Naples, FL | 2.0 | 2.0 | 1004 | $1,800 | $1.79 | 23d | 1 | 1.36mi |
| 194 Santa Clara Dr Unit 194-3 Naples, FL | 1.0 | 1.0 | 833 | $1,600 | $1.92 | 23d | 1 | 1.38mi |
| 1875 Florida Club Dr Naples, FL | 2.0 | 1.0 | 1016 | $1,722 | $1.69 | 23d | 2 | 1.40mi |
| 4640 Santa Barbara Blvd Naples, FL | 2.0–3.0 | 2.0 | 1164 | $1,932 | $1.66 | 23d | 2 | 1.43mi |
| 7725 Tara Cir Naples, FL | 1.0–3.0 | 1.0–2.0 | 929 | $1,512 | $1.63 | 14d | 1 | 1.45mi |
| 2644 Kings Lake Blvd Unit 6-103 Naples, FL | 2.0 | 2.0 | 911 | $1,875 | $2.06 | 23d | 1 | 1.47mi |
| 2648 Kings Lake Blvd Unit 6-201 Naples, FL | 3.0 | 2.0 | 1060 | $2,200 | $2.08 | 21d | 1 | 1.48mi |
| 153 Bristol Ln Unit A Naples, FL | 2.0 | 2.0 | 1009 | $2,250 | $2.23 | 14d | 1 | 1.49mi |
| 153 Bristol Ln Unit F102 Naples, FL | 2.0 | 2.0 | 1009 | $4,900 | $4.86 | 23d | 1 | 1.49mi |
| 2712 Kings Lake Blvd #201 Naples, FL | 1.0 | 1.0 | 1076 | $2,850 | $2.65 | 23d | 1 | 1.49mi |
HOA detail
- Monthly dues
- $162 · $1,944/yr
Listing history 2 events
-
2026-06-01remarks 687-char remark
-
2026-06-01$168,000 Pending 87 DOM
ⓘ Source: listings_history table (triggers on properties + properties_extension) + one-shot
backfill from property_details.listing_events for pre-trigger history.
Climate risk First Street
- Flood 5/10 Major FEMA zone X (shaded) · 48% chance over 30 yrs
- Wildfire 1/10 Low
- Heat 10/10 Extreme 7 d/yr ≥107°F today · 27 d/yr by 30 yrs out
- Wind 10/10 Extreme 99% chance of damaging wind over 30 yrs
- Air quality 2/10 Low 2 unhealthy d/yr today · 2 by 30 yrs out
Nearby sold comps map
Loading sold comps map…
Walkable amenities ~0.75 mi
Loading nearby amenities…
Taxation est. · year 1
- Rental income
- $27,672
- − Mortgage interest
- −$9,411
- − Property taxes
- −$2,520
- − Insurance
- −$840
- − Repairs & maintenance
- −$2,214
- − Management
- −$2,214
- − HOA
- −$1,944
- − Depreciation
- −$4,887
- Taxable income
- $3,642
- Est. tax owed @ 24.0%
- −$874
- After-tax cash flow
- $5,110/yr
For passive investors: Depreciation is non-cash, so a rental often shows a tax loss while cash-flowing — sheltering income. Rental losses are passive: they offset passive income freely, and up to $25,000/yr can offset ordinary (W-2) income if you actively participate and your MAGI is under $100k (phasing out to $0 by $150k); unused losses carry forward. On sale, claimed depreciation is recaptured at up to 25%, and gains may owe capital-gains tax (a 1031 exchange can defer both). Figures are a year-1 estimate at your 24.0% rate — not tax advice; consult a CPA.
Condition & rehab AI · 13 photos
This well-maintained two-bedroom home in a 55+ community offers a comfortable and updated retreat, ready for immediate occupancy.
Value-add opportunities
- Both Painting exterior siding — Enhances curb appeal and value
- Both Updating flooring in bathrooms — Improves aesthetics and functionality
- Both Upgrading kitchen appliances — Modernizes the space and adds value
Renovation cost estimate screening
Value-add ROI direction
- Both Painting exterior siding — Enhances curb appeal and value ↑
- Both Updating flooring in bathrooms — Improves aesthetics and functionality ↑
- Both Upgrading kitchen appliances — Modernizes the space and adds value ↑
ⓘ Cost ranges are severity-bucket heuristics (US national rule-of-thumb). Get contractor quotes + a written scope before underwriting a rehab budget.
Schools (NCES district)
- District
- Collier
- NCES district ID
- 1200330
- Math proficiency
- 60% ▼ -4.00%
- Reading proficiency
- 56% ▼ -2.00%
- Median HH income
- $58,275
- Composite
- 50.23/100
- National rank
- #1892
- State rank
- #16 of 73 in FL
Livability — Berkshire Lakes
No livability data for this city. (Only ~50 U.S. cities are tracked.)
Census & demographics
- County
- Collier County · 396,295 people
- Metro
- Naples-Marco Island, FL
- Population (ZIP)
- 26,408
- Household income
- $71,686
- Rent vs Own
- Severe rent burden
- 1423.0
Population outlook (Collier County) Hauer SSP2
- Today (2025)
- 420,858 people
- By 2030
- 450,054 · +6.9%
- By 2040
- 502,232 · +19.3%
- By 2050
- 544,932 · +29.5%
- By 2075
- 627,203 · +49.0%
- By 2100
- 659,015 · +56.6%
Race, ethnicity, and origin ACS 2023
- Neighborhood character
- Majority White (62%)
- Race & ethnicity
- White 62% Hispanic / Latino 30% Two or more races 19% Black 4% Asian 2%
- Hispanic origin (detail)
- Mexican 7% Puerto Rican 3% Cuban 6% Dominican 1%
- Common ancestry
- Lithuanian 6% Romanian 3% Hispanic 2%
- Foreign-born
- 30% · Canada, Jamaica, Dominican Republic
- Languages at home
- 66% English-only · Spanish 24% French/Haitian/Cajun 5% Russian/Polish/Slavic 1%
Political lean MEDSL · Collier
- 2024 margin
- Solid R (+33.1) · D 33.1% · R 66.2%
- 2008→2024 swing
- -10.6pp toward R · 2008: -22.5pp · 2024: -33.1pp
- All cycles
- 2024: R+33.1 2020: R+24.7 2016: R+26.0 2012: R+30.1 2008: R+22.5
Not yet ingested
- Civics
- —
Market trends
- HPI YoY
- ▼ -252.48%
- Current HPI
- 259.3498
- Rent YoY
- ▼ -1.10%
- Metro
- Naples-Marco Island, FL
- State GDP YoY
- ▲ 3.28%
- F500 in state
- 36
Industry mix (Fortune 500 HQ in FL)
| Industry | F500 HQs | Revenue |
|---|---|---|
| Industrial Technology | 2 | $29B |
|
||
| Insurance | 2 | $17B |
|
||
| Retail | 1 | $60B |
|
||
| Technology Distribution | 1 | $58B |
|
||
| Homebuilding | 1 | $35B |
|
||
| Technology Manufacturing | 1 | $35B |
|
||
Price history
3 events — show timeline
- 2026-05-31 Pending — NAPLESMLS
- 2026-05-14 Pending — NAPLESMLS
- 2026-02-16 Listed $168,000 NAPLESMLS
Cash-flow waterfall
monthlySold comps — $/sqft
last 12 mo · ≤1 miLoading sold comps…