 🔨 Auction
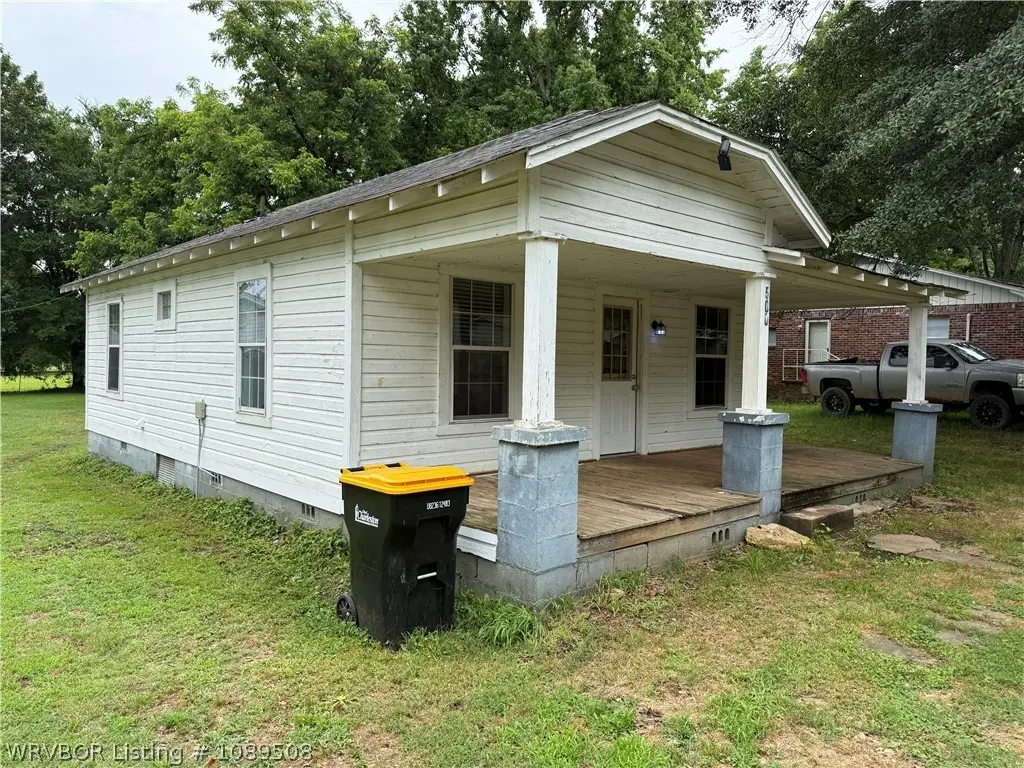
500 & 506 Prairie St · Charleston, AR
Flood risk 1/10 · Minimal
- FEMA flood zone
- X (unshaded)
- Chance of flooding over 30 yrs
- 0.0%
- Est. flood insurance / yr
- $507 – $1,088
Fire risk 4/10 · Minor
- Est. fire insurance / yr
- $1,499 – $2,785
Heat risk 6/10 · Moderate
- Hot days now (above 112°F)
- 7 days/yr
- Hot days in 30 yrs
- 20 days/yr
Wind risk 2/10 · Minimal
- Chance of severe wind over 30 yrs
- 2.0%
Air-quality risk 2/10 · Minimal
- Unhealthy air days now
- 0 days/yr
- Unhealthy air days in 30 yrs
- 1 days/yr
Risk factors via First Street. Map © Google.
Why this score? — see what drove the D grade
The composite is a weighted blend of 9 inputs, each scored 0–100. Each bar is that input's sub-score; the figure is the points it added to the 100-point composite (weight × sub-score).
- Appreciation +10.0/10.0
- ARV discount +7.5/15.0
- Cash flow +7.2/30.0
- Schools +3.8/10.0
- Livability +3.5/5.0
- Rent growth +2.5/5.0
- Condition / age +2.5/5.0
- 1% rule +2.0/10.0
- DSCR +1.4/10.0
$1
🖨 Deal sheet 📄 Offer letter ✓ Due diligence
Listing remarks
Auction 7/2/2026 @ 10 am. Looking for a great rental property? This unique auction features two separate homes on a spacious 0.34-acre lot, offering a double opportunity for steady rental income. The first home is a cozy 785-square-foot, 1-bedroom, 1-bathroom house with classic wood siding. The second home is a low-maintenance 530-square-foot, 1-bedroom, 1-bathroom house built with solid concrete blocks. Whether you want to rent out both for two streams of income or live in one and rent the other, this property is a solid money-maker.
Key facts
- Low-maintenance
- Two separate homes
- Spacious lot
Tags
Property features AI
Exterior
- Parking: Gravel parking
- Utilities: Public water; Electricity available; Natural gas available
- Home design: Single-family house; One story
- Construction: Built with block, frame, and concrete materials; Slab foundation; Asphalt shingle roof
- Exterior features: Cleared lot; Paved road access; Publicly maintained road
Interior
- Kitchen: Oven
- Flooring: Carpet
- Bathrooms: 2 full bathrooms
- Heating & cooling: Natural gas heating; Window air conditioning units
- Interior features: Electric water heater; Oven
- Laundry & utility: Electric dryer hookup
Neighborhood map
What this means for you Summary
Snapshot
- This is a 2-bed/2.0-bath single-family listed at $1.
Deal economics
- At list price, monthly cash flow is $-237 ($-3k/yr) — negative.
- The deal already cash-flows at list — no discount required.
- Meets the 1% rule at list price ($1k rent vs $1).
Location & tenants
- Location reads 69/100 on livability (#70 in AR) — a middle-class / working-renter tenant base. Strengths: cost of living A+, housing A+, health & safety A+; Watch: crime D, amenities F, commute F.
- Charleston School District (rural): math 46% / reading 43% proficiency, ranked #39 of 238 in AR (top 16%) — families likely to look elsewhere, expect single-tenant / working-renter base with shorter leases.
- Zoned schools: Charleston Elementary School (math 56% / reading 41%, grade D, #109 of 454 statewide, top 25%, 454 students, 47% FRL); Charleston High School (math 38% / reading 46%, grade F, #38 of 292 statewide, top 14%, 435 students, 44% FRL).
- Market conditions: 51 active listings in the ZIP; 1 comparable units currently listed for rent nearby; 23 units permitted in Franklin County in 2024 (0 in 5+ unit buildings).
Forward outlook
- In year one you build about $18k of equity ($1k loan paydown + $17k appreciation (10.0% local appreciation)).
- Franklin County population projected at -16% by 2050 — secular population decline; favor cash flow + early exit over multi-decade hold.
- By year 3, paydown + projected appreciation supports a ~$46k cash-out refi (75% LTV) — recoverable capital for the next deal without selling this one.
Negotiation context
- It's been on market 16 days — a 2% lower offer ($0) is reasonable based on typical stale-listing flexibility.
Risks & watch-outs
- Watch-outs: property tax is 256425.0% of price.
- Climate carrying-cost: extreme-heat days projected 7→20/yr by 2055 (HVAC capex compounding) — expect insurance premiums to compound above CPI over the hold.
Questions for the listing agent
- What do current leases actually rent for vs. the listed asking? Can we see a recent rent roll and the last 12 months of T-12 income?
- Built in 1961 — when were the roof, HVAC, electrical panel, plumbing, and water heater last replaced?
- Property tax is high relative to price — has the assessment been appealed recently, and will the sale trigger a re-assessment?
- Is there a deadline driving the sale (1031 exchange, divorce, estate, relocation)? That informs how much negotiation room exists.
- Crime grade is D in this area — have there been break-ins, vandalism, or insurance claims at this property in the last 3 years? What carrier currently insures it and at what premium?
- The area grade is low — what's the realistic commute time and amenity access for the typical tenant pool here? Any planned neighborhood developments (good or bad) we should know about?
- What's the average days-on-market for RENTAL listings here right now (not sales)? A rising rental-DOM trend means longer vacancies and softer asking-rent achievability than the comps imply.
- What's the recent tenant-quality profile in this submarket — average credit score on applications, eviction rate, late-payment / NSF rate, and stable-employment percentage? A property-management company in the area should have these aggregated.
- How much new for-sale + rental construction is in the pipeline within 1–3 miles? Heavy new supply typically softens prices + rents 12–24 months out; constrained supply supports both.
Investment metrics
- 1% rule
- 0.70% ✗
- Cap rate
- 4.63%
- Cash-on-cash
- -5.95%
- DSCR
- 0.74
- GRM
- 11.9
CMA / ARV
- ARV (on-the-fly)
- $170,950
- Comps found
- 12
Show comp detail 12 sales within ~0.75 mi
| Address | Dist | Beds/Ba | Sqft | Sold | Price | $/sf | Match |
|---|---|---|---|---|---|---|---|
| 322 N Seventh St | 0.27mi | 3/2.0 (+1) | 1,344 (+2%) | 1mo | $185,000 | $138 | 78 |
| 216 Greenwood St | 0.31mi | 2/1.0 | 1,232 (-6%) | 17mo | $19,900 | $16 | 57 |
| 12822 Highway 217 | 0.37mi | 3/2.0 (+1) | 1,248 (-5%) | 17mo | $165,000 | $132 | 56 |
| 152 Maplewood Loop | 0.53mi | 3/2.5 (+1) | 1,400 (+6%) | 9mo | $229,900 | $164 | 50 |
| 18 Fifth St | 0.49mi | 3/1.0 (+1) | 1,221 (-7%) | 10mo | $137,000 | $112 | 48 |
| 184 Maplewood Loop | 0.55mi | 3/2.5 (+1) | 1,279 (-3%) | 20mo | $219,000 | $171 | 47 |
| 303 Seventh St | 0.31mi | 3/2.0 (+1) | 1,182 (-10%) | 21mo | $72,000 | $61 | 46 |
| 172 Maplewood Loop | 0.54mi | 3/2.5 (+1) | 1,400 (+6%) | 19mo | $229,900 | $164 | 41 |
| 200 Jefferson Dr | 0.69mi | 3/2.0 (+1) | 1,500 (+14%) | 6mo | $195,000 | $130 | 34 |
| 606 Highland Dr | 0.74mi | 3/2.0 (+1) | 1,455 (+11%) | 11mo | $165,000 | $113 | 33 |
| 720 Darrin Dr | 0.70mi | 3/1.0 (+1) | 1,258 (-4%) | 23mo | $160,000 | $127 | 32 |
| 616 Darrin Dr | 0.69mi | 3/2.0 (+1) | 1,452 (+10%) | 19mo | $167,700 | $115 | 30 |
Match score weights: distance 35% · size 25% · config 20% · recency 20%. Top-matched comps best support the ARV.
Projected returns pro-forma
10.0% appreciation · 3.0% rent growth · sell at horizon
- IRR
- 20.1%
- Equity multiple
- 2.63×
- Total profit
- $78,005
- Equity at exit
- $154,005
- IRR
- 18.4%
- Equity multiple
- 6.05×
- Total profit
- $241,636
- Equity at exit
- $332,118
Cash invested: $47,866 (down + closing). Projections, not guarantees.
Landlord ↔ Tenant lean methodology
- Overall (STATE)
- 92 Strongly Landlord-Friendly
- State Arkansas
- 92 Strongly Landlord-Friendly · R+14
- County
- — inherits STATE
- City
- — inherits STATE
ZIP-level market 72933
- Home prices YoY
- 5.8%
- Active inventory
- 51
Monthly cashflow live
- Estimated rent
- $1,195 medium interval (Pro) →
- Mortgage (P&I)
- −$896
- Tax est. 1.5%
- −$214 /mo · $2,564/yr
- Insurance
- −$71
- HOA
- −$0
- Vacancy / Maint / Mgmt
- −$251
- Net cashflow
- $-237
Break-even live
UW: 25.0% down · 7.5% · 30yr · 1.5% tax · 5.0% vac · 8.0% maint · 8.0% mgmt
Financing live
Cash to close
- Down payment
- $42,738
- Closing costs
- $5,128
- Reserves months
- —
- Total cash needed
- —
Loan-product check · same deal, 3 products live
Conventional
25% down · 7.5% · 30yr
- Down + closing
- —
- Monthly P&I
- —
- Monthly cashflow
- —
- DSCR
- —
- Eligible?
- —
Personal DTI + credit; lowest rate.
DSCR
20% down · 8.5% · 30yr
- Down + closing
- —
- Monthly P&I
- —
- Monthly cashflow
- —
- DSCR
- —
- Eligible?
- —
No personal income docs; deal must DSCR.
Hard money
10% down · 12.0% · 12mo
- Down + closing
- —
- Monthly P&I
- —
- Monthly cashflow
- —
- DSCR
- —
- Eligible?
- —
Short-term bridge; refi at stabilization.
Rent comps 1 comps
| Address | Beds | Baths | Sqft | Rent | $/sqft | DOM | Units | Dist |
|---|---|---|---|---|---|---|---|---|
| 96 N School St Unit 15 Charleston, AR | 2.0 | 1.5 | 952 | $1,195 | $1.26 | 13d | 1 | 0.55mi |
Listing history 13 events
-
2026-06-19days on market $1 Active 16 DOM
-
2026-06-18days on market $1 Active 15 DOM
-
2026-06-17days on market $1 Active 14 DOM
-
2026-06-16days on market $1 Active 13 DOM
-
2026-06-15days on market $1 Active 12 DOM
-
2026-06-14days on market $1 Active 10 DOM
-
2026-06-12days on market $1 Active 9 DOM
-
2026-06-09days on market $1 Active 6 DOM
-
2026-06-08days on market $1 Active 5 DOM
-
2026-06-07days on market $1 Active 4 DOM
-
2026-06-07days on market $1 Active 3 DOM
-
2026-06-04remarks 540-char remark
-
2026-06-04$1 Active 1 DOM
ⓘ Source: listings_history table (triggers on properties + properties_extension) + one-shot
backfill from property_details.listing_events for pre-trigger history.
Climate risk First Street
- Flood 1/10 Low FEMA zone X (unshaded) · 0% chance over 30 yrs
- Wildfire 4/10 Moderate
- Heat 6/10 Major 7 d/yr ≥112°F today · 20 d/yr by 30 yrs out
- Wind 2/10 Low 2% chance of damaging wind over 30 yrs
- Air quality 2/10 Low 0 unhealthy d/yr today · 1 by 30 yrs out
Nearby sold comps map
Loading sold comps map…
Walkable amenities ~0.75 mi
Loading nearby amenities…
Taxation est. · year 1
- Rental income
- $14,340
- − Mortgage interest
- −$9,576
- − Property taxes
- −$2,564
- − Insurance
- −$855
- − Repairs & maintenance
- −$1,147
- − Management
- −$1,147
- − Depreciation
- −$4,973
- Taxable loss
- −$5,922
- Est. tax savings @ 24.0%
- +$1,421
- After-tax cash flow
- $-1,427/yr
For passive investors: Depreciation is non-cash, so a rental often shows a tax loss while cash-flowing — sheltering income. Rental losses are passive: they offset passive income freely, and up to $25,000/yr can offset ordinary (W-2) income if you actively participate and your MAGI is under $100k (phasing out to $0 by $150k); unused losses carry forward. On sale, claimed depreciation is recaptured at up to 25%, and gains may owe capital-gains tax (a 1031 exchange can defer both). Figures are a year-1 estimate at your 24.0% rate — not tax advice; consult a CPA.
Schools (NCES district)
- District
- Charleston School District
- NCES district ID
- 0504200
- Math proficiency
- 46% ▼ -12.00%
- Reading proficiency
- 43% ▼ -9.00%
- Median HH income
- $47,155
- Composite
- 37.97/100
- National rank
- #4296
- State rank
- #39 of 238 in AR
Livability — Charleston
- Score
- 69/100
- State rank
- #70
- US rank
- #8583
Category grades
Schools grade is shown separately in the Schools card above.
Census & demographics
- Census place
- Charleston, AR
- Population (ZIP)
- 5,207
Population outlook (Franklin County) Hauer SSP2
- Today (2025)
- 16,946 people
- By 2030
- 16,403 · -3.2%
- By 2040
- 15,303 · -9.7%
- By 2050
- 14,243 · -16.0%
- By 2075
- 12,136 · -28.4%
- By 2100
- 10,443 · -38.4%
Race, ethnicity, and origin ACS 2023
- Neighborhood character
- Predominantly White (86%)
- Race & ethnicity
- White 86% Two or more races 10% Hispanic / Latino 2%
- Common ancestry
- Slovak 2% Iranian 2% Italian 1%
- Foreign-born
- 1%
Political lean MEDSL · Franklin
- 2024 margin
- Solid R (+62.4) · D 17.7% · R 80.1% · Other 2.2%
- 2008→2024 swing
- -23.1pp toward R · 2008: -39.3pp · 2024: -62.4pp
- All cycles
- 2024: R+62.4 2020: R+61.4 2016: R+54.6 2012: R+44.4 2008: R+39.3
Not yet ingested
- Civics
- —
Market trends
- HPI YoY
- ▲ 15.06%
- Current HPI
- 273.2222
- Rent YoY
- —
- Metro
- —
- State GDP YoY
- ▲ 3.80%
- F500 in state
- 10
Industry mix (Fortune 500 HQ in AR)
| Industry | F500 HQs | Revenue |
|---|---|---|
| Retail | 1 | $681B |
|
||
| Food / Agriculture | 1 | $53B |
|
||
| Retail / Energy | 1 | $22B |
|
||
| Transportation / Logistics | 1 | $12B |
|
||
| Energy | 1 | $4B |
|
||
Cash-flow waterfall
monthlySold comps — $/sqft
last 12 mo · ≤1 miLoading sold comps…