150 Gary St · Bridge City, TX
Flood risk 9/10 · Severe
- FEMA flood zone
- AE
- Chance of flooding over 30 yrs
- 0.99%
- Est. flood insurance / yr
- $1,737 – $8,500
Fire risk 3/10 · Minor
- Est. fire insurance / yr
- $1,222 – $2,270
Heat risk 9/10 · Severe
- Hot days now (above 109°F)
- 7 days/yr
- Hot days in 30 yrs
- 24 days/yr
Wind risk 9/10 · Severe
- Chance of severe wind over 30 yrs
- 99.0%
Air-quality risk 2/10 · Minimal
- Unhealthy air days now
- 1 days/yr
- Unhealthy air days in 30 yrs
- 1 days/yr
Risk factors via First Street. Map © Google.
Why this score? — see what drove the C+ grade
The composite is a weighted blend of 9 inputs, each scored 0–100. Each bar is that input's sub-score; the figure is the points it added to the 100-point composite (weight × sub-score).
- Cash flow +22.8/30.0
- ARV discount +15.0/15.0
- DSCR +7.3/10.0
- 1% rule +6.9/10.0
- Schools +4.0/10.0
- Livability +3.6/5.0
- Rent growth +2.5/5.0
- Condition / age +2.5/5.0
- Appreciation +0.0/10.0
$150,000
🖨 Deal sheet (PDF) 📄 Offer letter ✓ Due diligence
Listing remarks MLS
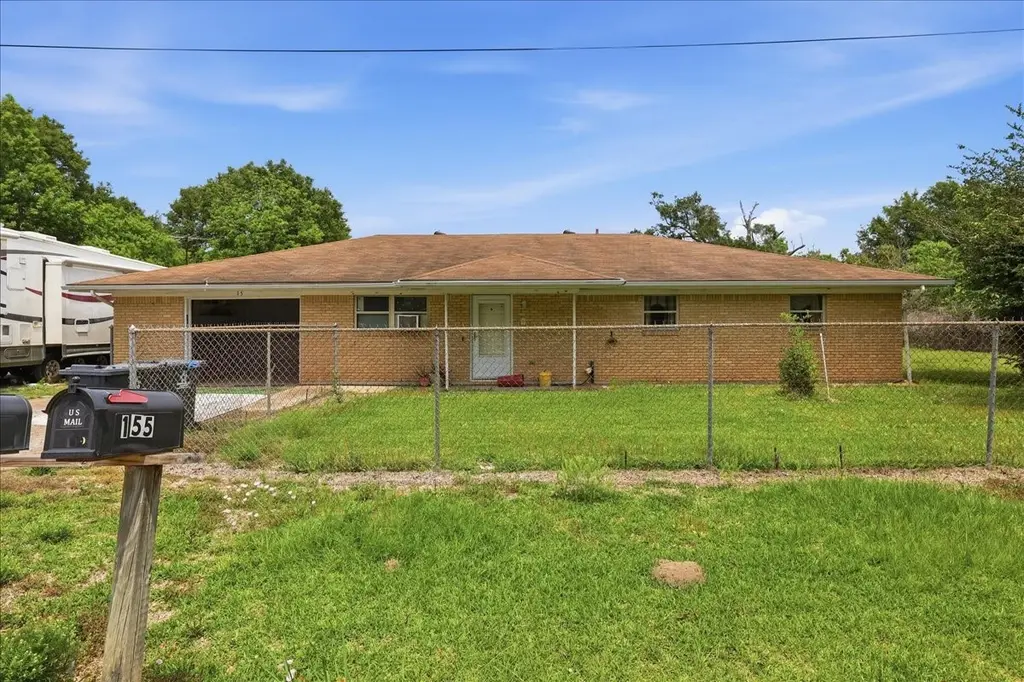
You will never rent again when you purchase this brick home in the Bridge City School District. This 4 bedroom, 1 1/2 bath house has plenty of room for the growing family. Oversized Kitchen /Dining area with plenty of room to gather in and cook that favorite meal. Appliances updated (2009) . Relax and enjoy your family in the nice size living room. Throughout the house is tile and carpet. 1 car garage and a detached garage. Extra covered parking could be used to park an RV. Fenced yard. Shallow well for watering. Close to schools, restaurants and shopping. Make your appointment today and view this "move in ready" "pride of ownership" house. Refrigerator does not stay but is for sale.
Key facts
- Generous lot
- Mature surroundings
- Convenient access
Tags
Property features AI
Finance
- Other: Listing broker: Realty Right
- Financial info:
- HOA & community:
Exterior
- Parking:
- Security:
- Utilities: Public water; Public sewer
- Home design: Residential property; Single-story living (rooms listed on first floor); Built in 1965
- Construction: Wood siding exterior; Composition roof; Slab foundation
- Exterior features: Lot approximately 0.503 acre; Lot size about 21,911 square feet; Other lot features
Interior
- Kitchen:
- Bedrooms: Multiple bedrooms on the first floor
- Flooring:
- Bathrooms: 1 full bathroom; 1 half bathroom (first floor)
- Heating & cooling: Central heating (gas); Central air conditioning (gas)
- Interior features: 6 total rooms
- Laundry & utility:
Neighborhood map
What this means for you Summary
Snapshot
- This is a 4-bed/1.5-bath single-family listed at $150k.
Deal economics
- At list price, monthly cash flow is $-165 ($-2k/yr) — negative.
- To cash-flow at today's rent, offer at most $121k (19.5% below list).
- Meets the 1% rule at list price ($2k rent vs $150k).
- Recommended offer: $121k (19.5% below list) — sets the bar for cash-flow.
- Cap rate 8.4% vs local median 2.2% in Bridge City — top-decile yield for the area; either an underpriced asset or a hidden risk that comps aren't pricing in. Stress-test before assuming the spread holds.
Location & tenants
- Location reads 72/100 on livability (#251 in TX) — a middle-class / working-renter tenant base. Strengths: crime A+, employment A+, cost of living A+; Watch: amenities F, commute F.
- Bridge City ISD (other): math 41% / reading 51% proficiency, ranked #224 of 826 in TX (top 27%) — families likely to look elsewhere, expect single-tenant / working-renter base with shorter leases.
- Zoned schools: Bridge City El (843 students, 50% FRL); Bridge City Middle (math 34% / reading 46%, grade F, #646 of 1,662 statewide, top 40%, 695 students, 40% FRL); Bridge City H S (math 42% / reading 66%, grade C-, #422 of 1,632 statewide, top 26%, 894 students, 34% FRL) — zoned schools at 41% FRL track the district average.
- Market conditions: 125 active listings in the ZIP; 3 comparable units currently listed for rent nearby; rentals at typical pace (median 16d on market — plan ~3-4 weeks tenant-placement turnaround); solid renter incomes; 235 units permitted in Orange County in 2024 (50 in 5+ unit buildings).
Forward outlook
- Local home prices are declining (-3.0%/yr); year-one equity from $1k of loan paydown is wiped out by about $4k of value loss. Plan a longer hold.
- Orange County population projected at +6% by 2050 — modest demand growth; plan on rents tracking national, not racing it.
Negotiation context
- It's been on market 54 days — a 3% lower offer ($146k) is reasonable based on typical stale-listing flexibility.
- 2 sale attempts since 11y ago; this cycle's ask has dropped $25k (14%) from the opening price — seller is motivated, your offer sets the floor, not the list.
Risks & watch-outs
- Watch-outs: flood insurance adds $427/mo.
- Climate carrying-cost: in FEMA flood zone AE (mandatory federal flood insurance); severe wind risk, 99% chance of damaging wind over 30y; extreme-heat days projected 7→24/yr by 2055 (HVAC capex compounding) — expect insurance premiums to compound above CPI over the hold.
Questions for the listing agent
- What do current leases actually rent for vs. the listed asking? Can we see a recent rent roll and the last 12 months of T-12 income?
- It's been on market 54 days. Have you received any prior offers? Is the seller open to a 19% concession, seller financing, or rate buy-down credit?
- Built in 1965 — when were the roof, HVAC, electrical panel, plumbing, and water heater last replaced?
- What's the actual annual flood-insurance premium (NFIP or private), and is the property in a SFHA with mandatory coverage?
- Is there a deadline driving the sale (1031 exchange, divorce, estate, relocation)? That informs how much negotiation room exists.
- What's the average days-on-market for RENTAL listings here right now (not sales)? A rising rental-DOM trend means longer vacancies and softer asking-rent achievability than the comps imply.
- What's the recent tenant-quality profile in this submarket — average credit score on applications, eviction rate, late-payment / NSF rate, and stable-employment percentage? A property-management company in the area should have these aggregated.
- How much new for-sale + rental construction is in the pipeline within 1–3 miles? Heavy new supply typically softens prices + rents 12–24 months out; constrained supply supports both.
Investment metrics
- 1% rule
- 1.19% ✓
- Cap rate
- 8.38%
- Cash-on-cash
- 7.46%
- DSCR
- 1.33
- GRM
- 7.0
CMA / ARV
- ARV (median comp)
- $222,852
- List price
- $150,000
- Delta
- -28.20%
- Verdict
- UNDERPRICED
- Comps
- 14 within 1.0 mi
Show comp detail 2 sales within ~0.75 mi
| Address | Dist | Beds/Ba | Sqft | Sold | Price | $/sf | Match |
|---|---|---|---|---|---|---|---|
| 106 Mockingbird Ln | 0.17mi | 3/2.0 (-1) | 1,965 (+7%) | 1mo | $299,900 | $153 | 72 |
| 240 Berwick Dr | 0.72mi | 3/2.0 (-1) | 1,804 (-1%) | 7mo | $229,900 | $127 | 51 |
Match score weights: distance 35% · size 25% · config 20% · recency 20%. Top-matched comps best support the ARV.
Projected returns pro-forma
-3.0% appreciation · 3.0% rent growth · sell at horizon
- IRR
- -24.0%
- Equity multiple
- 0.18×
- Total profit
- $-34,486
- Equity at exit
- $22,365
- IRR
- -18.3%
- Equity multiple
- -0.00×
- Total profit
- $-42,148
- Equity at exit
- $12,969
Cash invested: $42,000 (down + closing). Projections, not guarantees.
Landlord ↔ Tenant lean methodology
- Overall (STATE)
- 87 Strongly Landlord-Friendly
- State Texas
- 87 Strongly Landlord-Friendly · R+5
- County
- — inherits STATE
- City
- — inherits STATE
ZIP-level market 77611
- Active inventory
- 125
- Price-to-rent
- 7.0×
Monthly cashflow live
- Estimated rent
- $1,781 medium interval (Pro) →
- Mortgage (P&I)
- −$787
- Tax from tax record
- −$297 /mo · $3,565/yr
- Insurance
- −$62
- Flood insurance flood zone
- −$427 /mo · $5,118/yr
- HOA
- −$0
- Vacancy / Maint / Mgmt
- −$374
- Net cashflow
- $-165
Break-even live
Sensitivity live
| Price | -10% $-81 | -5% $-123 | +0% $-165 | +5% $-208 | +10% $-250 |
|---|---|---|---|---|---|
| Rent | -10% $-306 | -5% $-236 | +0% $-165 | +5% $-95 | +10% $-25 |
| Rate | -1.0pp $-90 | -0.5pp $-127 | base $-165 | +0.5pp $-204 | +1.0pp $-244 |
UW: 25.0% down · 7.5% · 30yr · 1.5% tax · 5.0% vac · 8.0% maint · 8.0% mgmt
Financing live
Cash to close
- Down payment
- $37,500
- Closing costs
- $4,500
- Reserves months
- —
- Total cash needed
- —
Loan-product check · same deal, 3 products live
Conventional
25% down · 7.5% · 30yr
- Down + closing
- —
- Monthly P&I
- —
- Monthly cashflow
- —
- DSCR
- —
- Eligible?
- —
Personal DTI + credit; lowest rate.
DSCR
20% down · 8.5% · 30yr
- Down + closing
- —
- Monthly P&I
- —
- Monthly cashflow
- —
- DSCR
- —
- Eligible?
- —
No personal income docs; deal must DSCR.
Hard money
10% down · 12.0% · 12mo
- Down + closing
- —
- Monthly P&I
- —
- Monthly cashflow
- —
- DSCR
- —
- Eligible?
- —
Short-term bridge; refi at stabilization.
Rent comps 3 comps
| Address | Beds | Baths | Sqft | Rent | $/sqft | DOM | Units | Dist |
|---|---|---|---|---|---|---|---|---|
| 516 Shannons Way Bridge City, TX | 3.0 | 2.0 | 1800 | $1,800 | $1.00 | 15d | 1 | 0.59mi |
| 2201 Wise St Bridge City, TX | 2.0–3.0 | 1.0–2.0 | 1144 | $1,500 | $1.31 | 15d | 7 | 0.69mi |
| 880 Morning Glory Dr Bridge City, TX | 3.0 | 2.0 | 1515 | $1,795 | $1.18 | 45d | 1 | 0.91mi |
Listing history 21 events
-
2026-06-22pricedays on market $150,000 Active 54 DOM
-
2026-06-18days on market $160,000 Active 51 DOM
-
2026-06-17days on market $160,000 Active 50 DOM
-
2026-06-16days on market $160,000 Active 49 DOM
-
2026-06-15days on market $160,000 Active 48 DOM
-
2026-06-14days on market $160,000 Active 46 DOM
-
2026-06-10days on market $160,000 Active 43 DOM
-
2026-06-09days on market $160,000 Active 42 DOM
-
2026-06-08days on market $160,000 Active 41 DOM
-
2026-06-07pricedays on market $160,000 Active 40 DOM
-
2026-06-03days on market $169,000 Active 36 DOM
-
2026-06-02days on market $169,000 Active 35 DOM
-
2026-06-01days on market $169,000 Active 34 DOM
-
2026-05-31days on market $169,000 Active 33 DOM
-
2026-05-30days on market $169,000 Active 32 DOM
-
2026-05-05price $169,000 410-char remark
-
2026-04-28$175,000 Active 410-char remark
-
2015-07-28soldstatus
-
2015-07-27soldstatus 715-char remark
Show marketing remark (715 chars)
You will never rent again when you purchase this brick home in the Bridge City School District. This 4 bedroom, 1 1/2 bath house has plenty of room for the growing family. Oversized Kitchen /Dining area with plenty of room to gather in and cook that favorite meal. Appliances updated (2009) . Relax and enjoy your family in the nice size living room. Throughout the house is tile and carpet. 1 car garage and a detached garage. Extra covered parking could be used to park an RV. Fenced yard. Shallow well for watering. Close to schools, restaurants and shopping. Make your appointment today and view this "move in ready" "pride of ownership" house. Refrigerator does not stay but is for sale.
-
2015-07-10$102,500 715-char remark
Show marketing remark (715 chars)
You will never rent again when you purchase this brick home in the Bridge City School District. This 4 bedroom, 1 1/2 bath house has plenty of room for the growing family. Oversized Kitchen /Dining area with plenty of room to gather in and cook that favorite meal. Appliances updated (2009) . Relax and enjoy your family in the nice size living room. Throughout the house is tile and carpet. 1 car garage and a detached garage. Extra covered parking could be used to park an RV. Fenced yard. Shallow well for watering. Close to schools, restaurants and shopping. Make your appointment today and view this "move in ready" "pride of ownership" house. Refrigerator does not stay but is for sale.
-
2014-12-23soldstatus
ⓘ Source: listings_history table (triggers on properties + properties_extension) + one-shot
backfill from property_details.listing_events for pre-trigger history.
Tax reassessment forecast TX · Resets to sale price
- Current annual tax
- $3,565 · $297/mo
- Projected year-2 tax
- $3,565 · $297/mo
- Expected delta
- $0/yr ($0/mo · 0.0%)
ⓘ Screening estimate from a state-policy table — verify with the county assessor before closing.
Climate risk First Street
- Flood 9/10 Extreme FEMA zone AE · 99% chance over 30 yrs
- Wildfire 3/10 Moderate
- Heat 9/10 Extreme 7 d/yr ≥109°F today · 24 d/yr by 30 yrs out
- Wind 9/10 Extreme 99% chance of damaging wind over 30 yrs
- Air quality 2/10 Low 1 unhealthy d/yr today · 1 by 30 yrs out
Nearby sold comps map
Loading sold comps map…
Walkable amenities ~0.75 mi
Loading nearby amenities…
Taxation est. · year 1
- Rental income
- $21,378
- − Mortgage interest
- −$8,402
- − Property taxes
- −$3,565
- − Insurance
- −$5,868
- − Repairs & maintenance
- −$1,710
- − Management
- −$1,710
- − Depreciation
- −$4,364
- Taxable loss
- −$4,243
- Est. tax savings @ 24.0%
- +$1,018
- After-tax cash flow
- $-967/yr
For passive investors: Depreciation is non-cash, so a rental often shows a tax loss while cash-flowing — sheltering income. Rental losses are passive: they offset passive income freely, and up to $25,000/yr can offset ordinary (W-2) income if you actively participate and your MAGI is under $100k (phasing out to $0 by $150k); unused losses carry forward. On sale, claimed depreciation is recaptured at up to 25%, and gains may owe capital-gains tax (a 1031 exchange can defer both). Figures are a year-1 estimate at your 24.0% rate — not tax advice; consult a CPA.
Schools (NCES district)
- District
- Bridge City ISD
- NCES district ID
- 4811310
- Math proficiency
- 41% ▼ -11.00%
- Reading proficiency
- 51% ▲ 1.00%
- Median HH income
- $60,817
- Composite
- 40.47/100
- National rank
- #3720
- State rank
- #224 of 826 in TX
Livability — Bridge City
- Score
- 72/100
- State rank
- #251
- US rank
- #5948
Category grades
Schools grade is shown separately in the Schools card above.
Census & demographics
- Census place
- Bridge City, TX
- County
- Orange County · 87,112 people
- City population
- 10,112
- Metro
- Beaumont-Port Arthur, TX
- Population (ZIP)
- 10,112
- Household income
- $92,004
- Rent vs Own
- Severe rent burden
- 214.0
Population outlook (Orange County) Hauer SSP2
- Today (2025)
- 88,065 people
- By 2030
- 89,591 · +1.7%
- By 2040
- 91,982 · +4.4%
- By 2050
- 93,023 · +5.6%
- By 2075
- 94,871 · +7.7%
- By 2100
- 88,155 · +0.1%
Race, ethnicity, and origin ACS 2023
- Neighborhood character
- Predominantly White (82%)
- Race & ethnicity
- White 82% Hispanic / Latino 14% Two or more races 12% Asian 2%
- Hispanic origin (detail)
- Mexican 12%
- Common ancestry
- Lithuanian 12% Slovak 3% Iranian 2%
- Foreign-born
- 3% · Canada
- Languages at home
- 89% English-only · Spanish 6% French/Haitian/Cajun 2% Russian/Polish/Slavic 1%
Political lean MEDSL · Orange
- 2024 margin
- Solid R (+66.8) · D 16.4% · R 83.1%
- 2008→2024 swing
- -19.6pp toward R · 2008: -47.1pp · 2024: -66.8pp
- All cycles
- 2024: R+66.8 2020: R+63.4 2016: R+61.9 2012: R+54.3 2008: R+47.1
Not yet ingested
- Civics
- —
Market trends
- HPI YoY
- ▼ -98.42%
- Current HPI
- 155.9874
- Rent YoY
- —
- Metro
- Beaumont-Port Arthur, TX
- State GDP YoY
- ▲ 3.95%
- F500 in state
- 110
Industry mix (Fortune 500 HQ in TX)
| Industry | F500 HQs | Revenue |
|---|---|---|
| Energy | 16 | $1,198B |
|
||
| Technology | 5 | $198B |
|
||
| Engineering / Construction | 4 | $72B |
|
||
| Energy Services | 3 | $60B |
|
||
| Utilities | 3 | $41B |
|
||
| Healthcare | 2 | $330B |
|
||
Price history
+56.1% since first listed7 events — show timeline
- 2026-06-04 Price Changed $160,000 HARMLS
- 2026-05-05 Price Changed $169,000 HARMLS
- 2026-04-28 Listed $175,000 HARMLS
- 2015-07-28 Sold (Public Records) — Public Records
- 2015-07-27 Sold (MLS) — BBOR
- 2015-07-10 Listed $102,500 BBOR
- 2014-12-23 Sold (Public Records) — Public Records
Property tax history
+6.2%/yrLatest (2025): $3,565 · +9.4% YoY. Source: county tax records.
Cash-flow waterfall
monthlySold comps — $/sqft
last 12 mo · ≤1 miLoading sold comps…