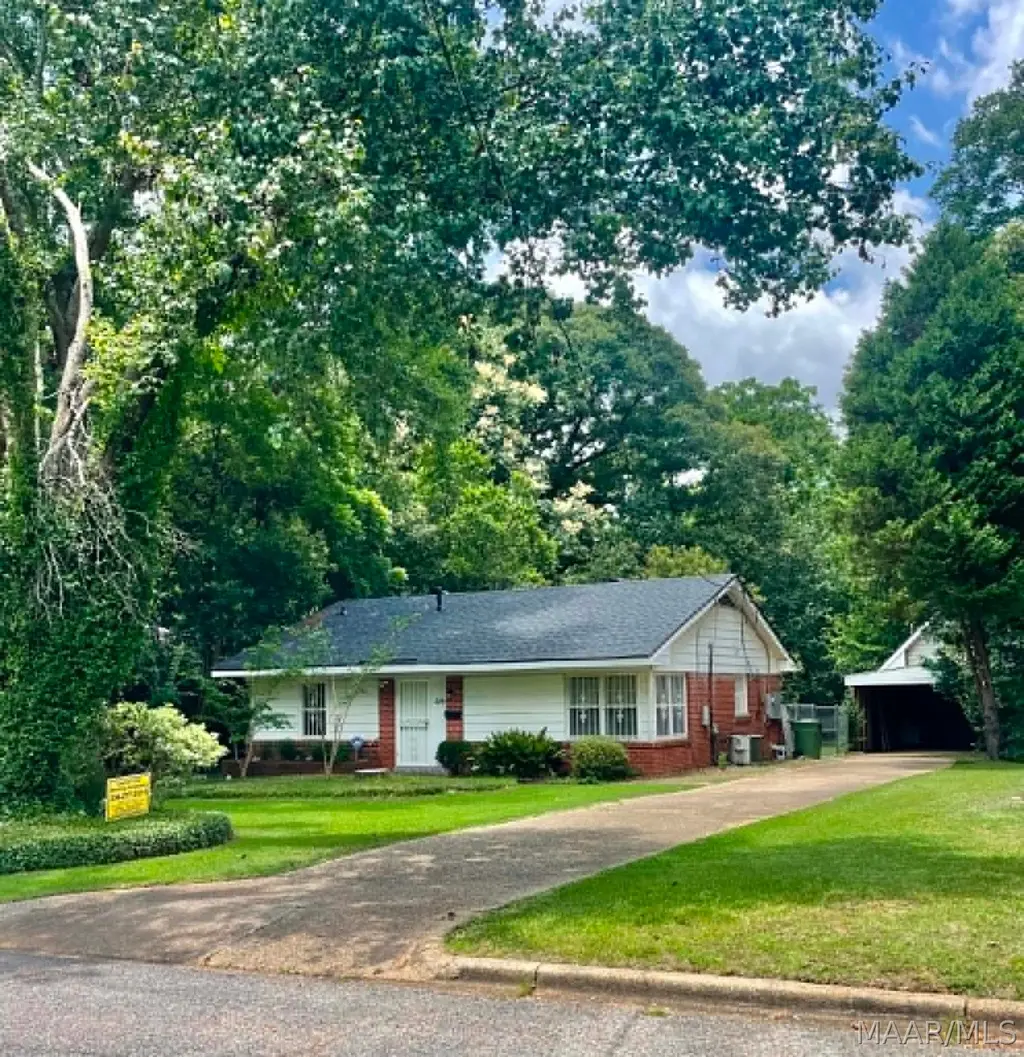
3019 Cabot St · Montgomery, AL
Flood risk 1/10 · Minimal
- FEMA flood zone
- X (unshaded)
- Chance of flooding over 30 yrs
- 0.0%
- Est. flood insurance / yr
- $507 – $1,088
Fire risk 3/10 · Minor
- Est. fire insurance / yr
- $916 – $1,700
Heat risk 7/10 · Major
- Hot days now (above 107°F)
- 7 days/yr
- Hot days in 30 yrs
- 18 days/yr
Wind risk 8/10 · Major
- Chance of severe wind over 30 yrs
- 80.0%
Air-quality risk 3/10 · Minor
- Unhealthy air days now
- 4 days/yr
- Unhealthy air days in 30 yrs
- 4 days/yr
Risk factors via First Street. Map © Google.
Why this score? — see what drove the B- grade
The composite is a weighted blend of 9 inputs, each scored 0–100. Each bar is that input's sub-score; the figure is the points it added to the 100-point composite (weight × sub-score).
- Cash flow +30.0/30.0
- DSCR +10.0/10.0
- 1% rule +8.8/10.0
- ARV discount +7.5/15.0
- Livability +3.2/5.0
- Rent growth +2.5/5.0
- Condition / age +2.5/5.0
- Schools +1.7/10.0
- Appreciation +0.0/10.0
$75,000
🖨 Deal sheet 📄 Offer letter ✓ Due diligence
Listing remarks
This home has great curb appeal. The roof was replaced in May of this year. New interior paint in some rooms and wait to you see the beautiful, spacious and tree shaded back yard. The yard goes past the fence to the tree line at the back of the lot. It has several fenced areas for your children to play in safety and privacy and lots of separate areas for your pets. You have a 2-story storage building attached to a 2-car detached carport. There is a lot of BANG FOR THE BUCK in this home. You will be convenient to all of your needs and will have a wonderful place to call home.
Key facts
- 0.5 acre lot
- 2 parking spots
- Built 1962
Property features AI
Exterior
- Parking: Detached carport with 2 carport spaces
- Utilities: Public water; Public sewer; Electricity available; Natural gas available; Cable available; High-speed internet available
- Home design: Single-story brick home; Slab foundation
- Construction: Brick construction; Built in public records year (year built source: public records)
- Exterior features: Fully fenced lot with privacy fencing; Patio; Storage shed and workshop; Mature trees; City lot; Public paved road frontage
Interior
- Kitchen: Electric cooktop, electric oven and electric range; Refrigerator; Plumbed for ice maker
- Bedrooms: Two bedrooms on the first floor
- Flooring: Tile; Wood
- Bathrooms: One full bathroom on the first floor
- Heating & cooling: Central heating (gas); Central air conditioning (electric); Ceiling fans
- Interior features: Blinds and window treatments; Tile and wood flooring
- Laundry & utility: Washer hookup; Dryer hookup; Washer and dryer included; Gas water heater
Neighborhood map
What this means for you Summary
Snapshot
- This is a 3-bed/1.0-bath single-family listed at $75k.
Deal economics
- At list price, monthly cash flow is $363 ($4k/yr) — positive.
- The deal already cash-flows at list — no discount required.
- Meets the 1% rule at list price ($1k rent vs $75k).
- Cap rate 12.1% vs local median 6.0% in Montgomery — top-decile yield for the area; either an underpriced asset or a hidden risk that comps aren't pricing in. Stress-test before assuming the spread holds.
Location & tenants
- Location reads 65/100 on livability (#138 in AL) — a middle-class / working-renter tenant base. Strengths: cost of living A+, housing A+; Watch: schools C-, employment D, crime F.
- Montgomery County (urban): math 9% / reading 31% proficiency, ranked #106 of 129 in AL (top 82%) — low school quality limits family demand, transient renter base, plan for 1-2y turnover; 70% free/reduced lunch — lower-income household profile, screen leases tightly.
- Market conditions: 62 active listings in the ZIP; 32 comparable units currently listed for rent nearby; rentals lingering (median 44d on market — plan ~5-8 weeks vacancy on turnover, expect pricing pressure); 69% of comp listings sitting > 30 days — soft ceiling on asking rent; 460 units permitted in Montgomery County in 2024 (37 in 5+ unit buildings).
Forward outlook
- Local home prices are declining (-3.0%/yr); year-one equity from $519 of loan paydown is wiped out by about $2k of value loss. Plan a longer hold.
- Montgomery County population projected to shrink 8% by 2050 — rents likely to lag national; underwrite the cash flow, not the appreciation.
- At projected returns (-3.0% appreciation + 3.0% rent growth), your $21k cash investment doubles in ~6 years — after that, you're playing with house money.
Negotiation context
- Only 2 days on market — expect competitive offers; lowballing is unlikely to land.
Risks & watch-outs
- Climate carrying-cost: severe wind risk, 80% chance of damaging wind over 30y; extreme-heat days projected 7→18/yr by 2055 (HVAC capex compounding) — expect insurance premiums to compound above CPI over the hold.
Questions for the listing agent
- Built in 1962 — when were the roof, HVAC, electrical panel, plumbing, and water heater last replaced?
- Is there a deadline driving the sale (1031 exchange, divorce, estate, relocation)? That informs how much negotiation room exists.
- Crime grade is F in this area — have there been break-ins, vandalism, or insurance claims at this property in the last 3 years? What carrier currently insures it and at what premium?
- What's the average days-on-market for RENTAL listings here right now (not sales)? A rising rental-DOM trend means longer vacancies and softer asking-rent achievability than the comps imply.
- What's the recent tenant-quality profile in this submarket — average credit score on applications, eviction rate, late-payment / NSF rate, and stable-employment percentage? A property-management company in the area should have these aggregated.
- How much new for-sale + rental construction is in the pipeline within 1–3 miles? Heavy new supply typically softens prices + rents 12–24 months out; constrained supply supports both.
Investment metrics
- 1% rule
- 1.38% ✓
- Cap rate
- 12.10%
- Cash-on-cash
- 20.75%
- DSCR
- 1.92
- GRM
- 6.0
CMA / ARV
- ARV (on-the-fly)
- $48,672
- Comps found
- 12
Show comp detail 12 sales within ~0.75 mi
| Address | Dist | Beds/Ba | Sqft | Sold | Price | $/sf | Match |
|---|---|---|---|---|---|---|---|
| 3123 Fairground Rd | 0.14mi | 3/1.0 | 962 (+3%) | 2mo | $64,000 | $67 | 87 |
| 1945 Gibson St | 0.18mi | 3/1.0 | 1,045 (+12%) | 2mo | $23,000 | $22 | 70 |
| 1800 Cotton Ct | 0.48mi | 3/1.0 | 962 (+3%) | 5mo | $62,500 | $65 | 68 |
| 1930 Gibson St | 0.19mi | 3/2.0 | 1,040 (+11%) | 4mo | $63,500 | $61 | 65 |
| 3329 Texas St | 0.43mi | 3/1.0 | 1,000 (+7%) | 7mo | $70,000 | $70 | 63 |
| 218 Broadway St | 0.62mi | 2/1.0 (-1) | 960 (+3%) | 1mo | $49,000 | $51 | 61 |
| 298 Broadway St | 0.60mi | 2/1.0 (-1) | 896 (-4%) | 2mo | $36,000 | $40 | 58 |
| 2003 Miller St | 0.35mi | 2/1.0 (-1) | 1,044 (+12%) | 2mo | $54,000 | $52 | 58 |
| 1515 Baffin Ct | 0.58mi | 3/1.0 | 1,025 (+10%) | 3mo | $26,000 | $25 | 55 |
| 1544 Gibson St | 0.64mi | 3/1.0 | 1,025 (+10%) | 2mo | $52,000 | $51 | 53 |
| 1625 Champion St | 0.69mi | 3/1.0 | 840 (-10%) | 0mo | $72,500 | $86 | 50 |
| 2058 Lucas Dr | 0.75mi | 3/1.0 | 805 (-14%) | 0mo | $28,000 | $35 | 42 |
Match score weights: distance 35% · size 25% · config 20% · recency 20%. Top-matched comps best support the ARV.
Projected returns pro-forma
-3.0% appreciation · 3.0% rent growth · sell at horizon
- IRR
- 13.1%
- Equity multiple
- 1.52×
- Total profit
- $10,953
- Equity at exit
- $11,183
- IRR
- 21.9%
- Equity multiple
- 2.87×
- Total profit
- $39,226
- Equity at exit
- $6,485
Cash invested: $21,000 (down + closing). Projections, not guarantees.
Landlord ↔ Tenant lean methodology
- Overall (STATE)
- 90 Strongly Landlord-Friendly
- State Alabama
- 90 Strongly Landlord-Friendly · R+15
- County
- — inherits STATE
- City
- — inherits STATE
ZIP-level market 36110
- Home prices YoY
- -34.8%
- Active inventory
- 62
- Price-to-rent
- 6.0×
Monthly cashflow live
- Estimated rent
- $1,035 high interval (Pro) →
- Mortgage (P&I)
- −$393
- Tax from tax record
- −$30 /mo · $364/yr
- Insurance
- −$31
- HOA
- −$0
- Vacancy / Maint / Mgmt
- −$217
- Net cashflow
- $363
Break-even live
UW: 25.0% down · 7.5% · 30yr · 1.5% tax · 5.0% vac · 8.0% maint · 8.0% mgmt
Financing live
Cash to close
- Down payment
- $18,750
- Closing costs
- $2,250
- Reserves months
- —
- Total cash needed
- —
Loan-product check · same deal, 3 products live
Conventional
25% down · 7.5% · 30yr
- Down + closing
- —
- Monthly P&I
- —
- Monthly cashflow
- —
- DSCR
- —
- Eligible?
- —
Personal DTI + credit; lowest rate.
DSCR
20% down · 8.5% · 30yr
- Down + closing
- —
- Monthly P&I
- —
- Monthly cashflow
- —
- DSCR
- —
- Eligible?
- —
No personal income docs; deal must DSCR.
Hard money
10% down · 12.0% · 12mo
- Down + closing
- —
- Monthly P&I
- —
- Monthly cashflow
- —
- DSCR
- —
- Eligible?
- —
Short-term bridge; refi at stabilization.
Rent comps 32 comps
| Address | Beds | Baths | Sqft | Rent | $/sqft | DOM | Units | Dist |
|---|---|---|---|---|---|---|---|---|
| 2056 Midway St Montgomery, AL | 3.0 | 1.0 | 1110 | $985 | $0.89 | 43d | 1 | 0.09mi |
| 2076 Midway St Montgomery, AL | 3.0 | 1.0 | 1068 | $1,000 | $0.94 | 43d | 1 | 0.10mi |
| 2111 Yarbrough St Montgomery, AL | 3.0 | 1.0 | 962 | $795 | $0.83 | 43d | 1 | 0.29mi |
| 1817 Texas Ct Montgomery, AL | 3.0 | 1.0 | 925 | $1,050 | $1.14 | 21d | 1 | 0.29mi |
| 2107 Yarbrough Cir Montgomery, AL | 3.0 | 1.0 | 910 | $925 | $1.02 | 43d | 1 | 0.32mi |
| 3329 Texas St Montgomery, AL | 3.0 | 1.0 | 1000 | $1,100 | $1.10 | 43d | 1 | 0.43mi |
| 3114 Cotton St Montgomery, AL | 3.0 | 1.0 | 888 | $1,100 | $1.24 | 43d | 1 | 0.47mi |
| 1324 Federal Dr Montgomery, AL | 2.0 | 1.0 | 1000 | $1,100 | $1.10 | 43d | 1 | 0.53mi |
| 3042 George B Edmondson Dr Montgomery, AL | 3.0 | 1.0 | 900 | $860 | $0.96 | 43d | 1 | 0.53mi |
| 298 Broadway St Montgomery, AL | 2.0 | 1.0 | 896 | $900 | $1.00 | 43d | 1 | 0.60mi |
| 218 Broadway St Montgomery, AL | 2.0 | 1.0 | 960 | $895 | $0.93 | 13d | 1 | 0.62mi |
| 2006 Harmon St Unit 3 Montgomery, AL | 3.0 | 1.0 | 800 | $500 | $0.62 | 43d | 1 | 0.65mi |
| 2503 Skyline Ave Montgomery, AL | 3.0 | 1.0 | 1015 | $1,150 | $1.13 | 43d | 1 | 0.66mi |
| 341 Chisholm St Montgomery, AL | 3.0 | 1.0 | 756 | $1,195 | $1.58 | 21d | 1 | 0.70mi |
| 216 Gardendale Dr Montgomery, AL | 3.0 | 1.0 | 900 | $850 | $0.94 | 21d | 1 | 0.78mi |
| 4010 Vandiver Ct Montgomery, AL | 2.0 | 2.0 | 630 | $1,050 | $1.67 | 43d | 1 | 0.87mi |
| 4029 Chelsea Dr Montgomery, AL | 3.0 | 1.0 | 1000 | $1,200 | $1.20 | 43d | 1 | 0.89mi |
| 3613 Erwin Dr Montgomery, AL | 3.0 | 2.0 | 1092 | $1,250 | $1.14 | 43d | 1 | 1.04mi |
| 740 Coliseum Blvd Unit 740A Montgomery, AL | 2.0 | 1.0 | 1100 | $895 | $0.81 | 13d | 1 | 1.04mi |
| 700 Coliseum Blvd Unit 700D Montgomery, AL | 2.0 | 1.0 | 911 | $895 | $0.98 | 43d | 1 | 1.10mi |
| 16 Garden St Montgomery, AL | 3.0 | 1.5 | 1008 | $775 | $0.77 | 44d | 1 | 1.11mi |
| 207 Destin St Montgomery, AL | 3.0 | 1.0 | 966 | $695 | $0.72 | 21d | 1 | 1.11mi |
| 517 N Florida St Unit B Montgomery, AL | 2.0 | 1.0 | 900 | $750 | $0.83 | 43d | 1 | 1.24mi |
| 2023 Windsor Ave Montgomery, AL | 2.0 | 1.0 | 889 | $895 | $1.01 | 43d | 1 | 1.25mi |
| 2122 Windsor Ave Montgomery, AL | 2.0 | 1.0 | 1052 | $725 | $0.69 | 43d | 1 | 1.26mi |
| 424 N California St Apt D Montgomery, AL | 2.0 | 1.0 | 850 | $778 | $0.92 | 21d | 1 | 1.30mi |
| 142 W Michigan Ave Montgomery, AL | 3.0 | 1.0 | 840 | $995 | $1.18 | 13d | 1 | 1.36mi |
| 429 Edward St Montgomery, AL | 3.0 | 1.0 | 828 | $1,080 | $1.30 | 13d | 1 | 1.36mi |
| 80 Turner Pl Unit 14 Montgomery, AL | 2.0 | 1.0 | 620 | $750 | $1.21 | 43d | 1 | 1.37mi |
| 412 Edward St Montgomery, AL | 3.0 | 1.0 | 828 | $800 | $0.97 | 43d | 1 | 1.37mi |
| 186 E Salem Dr Montgomery, AL | 3.0 | 1.0 | 1040 | $1,195 | $1.15 | 21d | 1 | 1.40mi |
| 7 Calhoun Rd Unit B Montgomery, AL | 2.0 | 1.0 | 961 | $850 | $0.88 | 43d | 1 | 1.48mi |
Listing history 3 events
-
2026-06-18days on market $75,000 Active 2 DOM
-
2026-06-16remarks 581-char remark
-
2026-06-16$75,000 Active 1 DOM
ⓘ Source: listings_history table (triggers on properties + properties_extension) + one-shot
backfill from property_details.listing_events for pre-trigger history.
Tax reassessment forecast AL · Resets to sale price
- Current annual tax
- $364 · $30/mo
- Projected year-2 tax
- $364 · $30/mo
- Expected delta
- $0/yr ($0/mo · 0.0%)
ⓘ Screening estimate from a state-policy table — verify with the county assessor before closing.
Climate risk First Street
- Flood 1/10 Low FEMA zone X (unshaded) · 0% chance over 30 yrs
- Wildfire 3/10 Moderate
- Heat 7/10 Severe 7 d/yr ≥107°F today · 18 d/yr by 30 yrs out
- Wind 8/10 Severe 80% chance of damaging wind over 30 yrs
- Air quality 3/10 Moderate 4 unhealthy d/yr today · 4 by 30 yrs out
Nearby sold comps map
Loading sold comps map…
Walkable amenities ~0.75 mi
Loading nearby amenities…
Taxation est. · year 1
- Rental income
- $12,426
- − Mortgage interest
- −$4,201
- − Property taxes
- −$364
- − Insurance
- −$375
- − Repairs & maintenance
- −$994
- − Management
- −$994
- − Depreciation
- −$2,182
- Taxable income
- $3,316
- Est. tax owed @ 24.0%
- −$796
- After-tax cash flow
- $3,562/yr
For passive investors: Depreciation is non-cash, so a rental often shows a tax loss while cash-flowing — sheltering income. Rental losses are passive: they offset passive income freely, and up to $25,000/yr can offset ordinary (W-2) income if you actively participate and your MAGI is under $100k (phasing out to $0 by $150k); unused losses carry forward. On sale, claimed depreciation is recaptured at up to 25%, and gains may owe capital-gains tax (a 1031 exchange can defer both). Figures are a year-1 estimate at your 24.0% rate — not tax advice; consult a CPA.
Schools (NCES district)
- District
- Montgomery County
- NCES district ID
- 0102430
- Math proficiency
- 9% ▼ -21.00%
- Reading proficiency
- 31% ▼ -1.00%
- Median HH income
- $43,902
- Composite
- 17.24/100
- National rank
- #9093
- State rank
- #106 of 129 in AL
Livability — Montgomery
- Score
- 65/100
- State rank
- #138
- US rank
- #13416
Category grades
Schools grade is shown separately in the Schools card above.
Census & demographics
- Census place
- Montgomery, AL
- County
- Montgomery County · 190,016 people
- City population
- 175,913
- Metro
- Montgomery, AL
- Population (ZIP)
- 12,102
- Household income
- $47,315
- Rent vs Own
- Severe rent burden
- 753.0
Population outlook (Montgomery County) Hauer SSP2
- Today (2025)
- 224,008 people
- By 2030
- 221,460 · -1.1%
- By 2040
- 214,179 · -4.4%
- By 2050
- 204,912 · -8.5%
- By 2075
- 177,821 · -20.6%
- By 2100
- 145,134 · -35.2%
Race, ethnicity, and origin ACS 2023
- Neighborhood character
- Predominantly Black (83%)
- Race & ethnicity
- Black 83% White 11% Two or more races 3% Asian 2% Hispanic / Latino 1%
- Common ancestry
- Hispanic 1%
- Foreign-born
- 2% · China, Canada
- Languages at home
- 96% English-only · Spanish 2% Other Asian/Pacific 1%
Political lean MEDSL · Montgomery
- 2024 margin
- Solid D (+30.7) · D 64.8% · R 34.1% · Other 1.1%
- 2008→2024 swing
- +11.5pp toward D · 2008: 19.2pp · 2024: 30.7pp
- All cycles
- 2024: D+30.7 2020: D+31.5 2016: D+26.2 2012: D+24.3 2008: D+19.2
Not yet ingested
- Civics
- —
Market trends
- HPI YoY
- ▼ -35.37%
- Current HPI
- 66.3114
- Rent YoY
- —
- Metro
- Montgomery, AL
- State GDP YoY
- ▲ 2.94%
- F500 in state
- 4
Industry mix (Fortune 500 HQ in AL)
| Industry | F500 HQs | Revenue |
|---|---|---|
| Financial Services | 1 | $8B |
|
||
| Healthcare | 1 | $5B |
|
||
Price history
1 event — show timeline
- 2026-06-15 Listed $75,000 MAAR
Property tax history
+1.4%/yrLatest (2025): $364 · +1.1% YoY. Source: county tax records.
Cash-flow waterfall
monthlySold comps — $/sqft
last 12 mo · ≤1 miLoading sold comps…