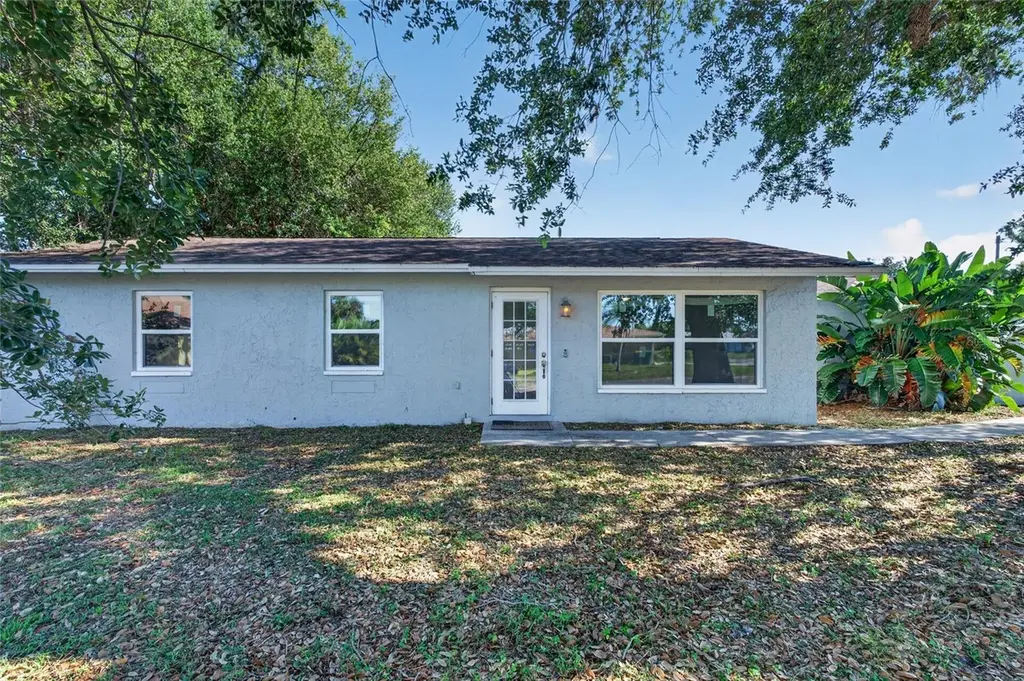
2025 Barksdale St · Port Charlotte, FL
Flood risk 7/10 · Major
- FEMA flood zone
- X (shaded)
- Chance of flooding over 30 yrs
- 0.73%
- Est. flood insurance / yr
- $507 – $1,088
Fire risk 1/10 · Minimal
- Est. fire insurance / yr
- $947 – $1,759
Heat risk 10/10 · Severe
- Hot days now (above 107°F)
- 7 days/yr
- Hot days in 30 yrs
- 28 days/yr
Wind risk 10/10 · Severe
- Chance of severe wind over 30 yrs
- 99.0%
Air-quality risk 3/10 · Minor
- Unhealthy air days now
- 2 days/yr
- Unhealthy air days in 30 yrs
- 2 days/yr
Risk factors via First Street. Map © Google.
Why this score? — see what drove the F grade
The composite is a weighted blend of 9 inputs, each scored 0–100. Each bar is that input's sub-score; the figure is the points it added to the 100-point composite (weight × sub-score).
- Cash flow +13.0/30.0
- Schools +4.6/10.0
- DSCR +3.9/10.0
- Livability +3.2/5.0
- 1% rule +2.8/10.0
- Condition / age +2.5/5.0
- Rent growth +2.1/5.0
- ARV discount +0.0/15.0
- Appreciation +0.0/10.0
$230,000
🖨 Deal sheet 📄 Offer letter ✓ Due diligence
Listing remarks MLS
Looking for a Super clean move in ready condition home in Port Charlotte this is it. Three bedrooms, two bathrooms, garage with a screened in lanai. Porcelain tile though out main living area on a diagonal, carpet in the bedrooms. Ceiling fans in bedrooms and living room. This property is located in an X flood zone on a over-sized corner lot. There is city water, square D electric panel installed 4/2012, Ac with all duct work installed on 10/2015. This home is close to everything being located in the heart of Port Charlotte.
Key facts
- No hoa fees
- New impact windows
- Mature landscaping
Tags
Property features AI
Finance
- Other: Homestead exemption; Zoned RSF3.5
- HOA & community: No association; Pets allowed
Exterior
- Parking: Attached garage (1 car, approximately 12 x 26); Driveway
- Utilities: Public water available; Septic tank; Cable available; Electricity connected
- Home design: Single-family residence; One story; South-facing; Completed condition
- Construction: Block foundation; Block and stucco construction; Shingle roof; Built on a 90 x 125 lot (approx. 0.26 acres)
- Exterior features: Rear screened porch; Outdoor lighting; Rain gutters; Corner lot; Paved lot; In-county location; Oak trees
Interior
- Kitchen: Range; Range hood; Refrigerator; Exhaust fan; Electric water heater
- Bedrooms: 3 bedrooms
- Flooring: Laminate; Tile
- Bathrooms: 2 full bathrooms
- Heating & cooling: Central heating (electric); Central air conditioning
- Interior features: Ceiling fans; Living room/dining room combo; Thermostat; Window treatments; Blinds; Storm windows; Florida room
- Laundry & utility: Washer hookup; Electric dryer hookup
Neighborhood map
What this means for you Summary
Snapshot
- This is a 2-bed/2.0-bath single-family listed at $230k.
Deal economics
- At list price, monthly cash flow is $-79 ($-950/yr) — negative.
- To cash-flow at today's rent, offer at most $216k (6.1% below list).
- To meet the 1% rule (rent ≥ 1% of price), the offer needs to be $179k (22.1% below list).
- Recommended offer: $179k (22.1% below list) — sets the bar for 1% rule.
- Cap rate 6.2% vs local median 4.4% in Port Charlotte — top-decile yield for the area; either an underpriced asset or a hidden risk that comps aren't pricing in. Stress-test before assuming the spread holds.
Location & tenants
- Location reads 65/100 on livability (#655 in FL) — a middle-class / working-renter tenant base. Strengths: cost of living A+, housing A+; Watch: employment D, amenities F, commute F.
- Charlotte (suburban): math 54% / reading 54% proficiency, ranked #22 of 73 in FL (top 30%) — acceptable for families but not a draw, mixed tenant base, ~2y average lease.
- Zoned schools: Liberty Elementary School (math 56% / reading 56%, grade C+, #832 of 2,144 statewide, top 40%, 622 students, 56% FRL); Port Charlotte High School (math 23% / reading 38%, grade F, #434 of 667 statewide, top 66%, 1,649 students, 43% FRL) — zoned schools at 50% FRL track the district average.
- Market conditions: Rents soft (-1.6%/yr); 953 active listings in the ZIP; 15 comparable units currently listed for rent nearby; rentals at typical pace (median 21d on market — plan ~3-4 weeks tenant-placement turnaround); 4,585 units permitted in Charlotte County in 2024 (703 in 5+ unit buildings).
- This rent runs 34% of the median local income ($63k/yr) — at the standard rent-burdened threshold; future hikes will face affordability resistance.
Forward outlook
- Local home prices are declining (-3.0%/yr); year-one equity from $2k of loan paydown is wiped out by about $7k of value loss. Plan a longer hold.
- Charlotte County population projected at +24% by 2050 — long-run rental-demand tailwind backs the buy-and-hold thesis.
Negotiation context
- It's been on market 30 days — a 2% lower offer ($227k) is reasonable based on typical stale-listing flexibility.
- 5 sale attempts since 16y ago with the ask held roughly flat each time — persistent listings suggest the price (not the market) is what's stuck; bring a comps-based counter.
- Current owner paid $132k; list at $230k implies a 75% gain — meaningful room to come down on a strong offer.
Risks & watch-outs
- Watch-outs: flood insurance adds $66/mo.
- Climate carrying-cost: major flood risk; severe wind risk, 99% chance of damaging wind over 30y; extreme-heat days projected 7→28/yr by 2055 (HVAC capex compounding) — expect insurance premiums to compound above CPI over the hold.
Questions for the listing agent
- What do current leases actually rent for vs. the listed asking? Can we see a recent rent roll and the last 12 months of T-12 income?
- Built in 1978 — when were the roof, HVAC, electrical panel, plumbing, and water heater last replaced?
- What's the actual annual flood-insurance premium (NFIP or private), and is the property in a SFHA with mandatory coverage?
- Is there a deadline driving the sale (1031 exchange, divorce, estate, relocation)? That informs how much negotiation room exists.
- Schools are D-rated, which usually means shorter tenancies and higher turnover. Who's the typical renter profile here, and what's been the actual vacancy rate?
- The area grade is low — what's the realistic commute time and amenity access for the typical tenant pool here? Any planned neighborhood developments (good or bad) we should know about?
- What's the average days-on-market for RENTAL listings here right now (not sales)? A rising rental-DOM trend means longer vacancies and softer asking-rent achievability than the comps imply.
- What's the recent tenant-quality profile in this submarket — average credit score on applications, eviction rate, late-payment / NSF rate, and stable-employment percentage? A property-management company in the area should have these aggregated.
- How much new for-sale + rental construction is in the pipeline within 1–3 miles? Heavy new supply typically softens prices + rents 12–24 months out; constrained supply supports both.
Investment metrics
- 1% rule
- 0.78% ✗
- Cap rate
- 6.23%
- Cash-on-cash
- -0.24%
- DSCR
- 0.99
- GRM
- 10.7
CMA / ARV
- ARV (on-the-fly)
- $193,248
- Comps found
- 7
Show comp detail 7 sales within ~0.75 mi
| Address | Dist | Beds/Ba | Sqft | Sold | Price | $/sf | Match |
|---|---|---|---|---|---|---|---|
| 18033 Cochran Blvd | 0.33mi | 2/1.5 | 1,090 (+3%) | 7mo | $185,000 | $170 | 71 |
| 2174 Taunt St | 0.42mi | 3/2.0 (+1) | 1,050 (-1%) | 5mo | $192,000 | $183 | 71 |
| 2318 Summit St | 0.61mi | 2/2.0 | 968 (-8%) | 2mo | $224,000 | $231 | 56 |
| 2094 Backton St | 0.49mi | 2/2.0 | 1,201 (+14%) | 1mo | $129,000 | $107 | 53 |
| 18103 Clanton Ave | 0.63mi | 2/1.0 | 1,148 (+9%) | 12mo | $197,500 | $172 | 42 |
| 2341 Granadeer St | 0.63mi | 3/2.0 (+1) | 1,183 (+12%) | 5mo | $223,000 | $189 | 41 |
| 18456 Yarbrough Ave | 0.55mi | 2/1.0 | 900 (-15%) | 16mo | $195,000 | $217 | 32 |
Match score weights: distance 35% · size 25% · config 20% · recency 20%. Top-matched comps best support the ARV.
Projected returns pro-forma
-3.0% appreciation · 0.0% rent growth · sell at horizon
- IRR
- -22.0%
- Equity multiple
- 0.26×
- Total profit
- $-47,596
- Equity at exit
- $34,294
- IRR
- -24.8%
- Equity multiple
- -0.06×
- Total profit
- $-68,362
- Equity at exit
- $19,886
Cash invested: $64,400 (down + closing). Projections, not guarantees.
Landlord ↔ Tenant lean methodology
- Overall (STATE)
- 87 Strongly Landlord-Friendly
- State Florida
- 87 Strongly Landlord-Friendly · R+3
- County
- — inherits STATE
- City
- — inherits STATE
ZIP-level market 33948
- Home prices YoY
- -14.9%
- Rents YoY
- -1.6%
- Active inventory
- 953
- Price-to-rent
- 10.7×
Monthly cashflow live
- Estimated rent
- $1,792 high interval (Pro) →
- Mortgage (P&I)
- −$1,206
- Tax from tax record
- −$126 /mo · $1,516/yr
- Insurance
- −$96
- Flood insurance flood zone
- −$66 /mo · $798/yr
- HOA
- −$0
- Vacancy / Maint / Mgmt
- −$376
- Net cashflow
- $-79
Break-even live
UW: 25.0% down · 7.5% · 30yr · 1.5% tax · 5.0% vac · 8.0% maint · 8.0% mgmt
Financing live
Cash to close
- Down payment
- $57,500
- Closing costs
- $6,900
- Reserves months
- —
- Total cash needed
- —
Loan-product check · same deal, 3 products live
Conventional
25% down · 7.5% · 30yr
- Down + closing
- —
- Monthly P&I
- —
- Monthly cashflow
- —
- DSCR
- —
- Eligible?
- —
Personal DTI + credit; lowest rate.
DSCR
20% down · 8.5% · 30yr
- Down + closing
- —
- Monthly P&I
- —
- Monthly cashflow
- —
- DSCR
- —
- Eligible?
- —
No personal income docs; deal must DSCR.
Hard money
10% down · 12.0% · 12mo
- Down + closing
- —
- Monthly P&I
- —
- Monthly cashflow
- —
- DSCR
- —
- Eligible?
- —
Short-term bridge; refi at stabilization.
Rent comps 15 comps
| Address | Beds | Baths | Sqft | Rent | $/sqft | DOM | Units | Dist |
|---|---|---|---|---|---|---|---|---|
| 2223 Tinker St Port Charlotte, FL | 3.0 | 2.0 | 1337 | $2,400 | $1.80 | 20d | 1 | 0.54mi |
| 1261 Joplin Ave NW Port Charlotte, FL | 2.0 | 2.0 | 1200 | $1,950 | $1.62 | 20d | 1 | 0.75mi |
| 2586 Auburn Blvd Port Charlotte, FL | 2.0 | 2.0 | 1028 | $1,850 | $1.80 | 13d | 1 | 0.76mi |
| 2457 Haven St Port Charlotte, FL | 3.0 | 2.0 | 1150 | $1,775 | $1.54 | 20d | 1 | 0.85mi |
| 17319 Terry Ave Port Charlotte, FL | 3.0 | 2.0 | 1478 | $2,095 | $1.42 | 20d | 1 | 0.89mi |
| 17230 Belmont Ave Port Charlotte, FL | 2.0 | 2.0 | 1052 | $1,375 | $1.31 | 20d | 1 | 0.94mi |
| 2113 Como St Port Charlotte, FL | 3.0 | 2.0 | 1162 | $1,500 | $1.29 | 20d | 1 | 0.95mi |
| 2022 Dorion St Port Charlotte, FL | 3.0 | 2.0 | 1200 | $1,695 | $1.41 | 13d | 1 | 1.02mi |
| 17107 Thompson Ave Unit 17107 Port Charlotte, FL | 3.0 | 2.0 | 1190 | $1,900 | $1.60 | 20d | 1 | 1.18mi |
| 2023 Fraser St Port Charlotte, FL | 2.0 | 2.0 | 935 | $1,450 | $1.55 | 13d | 1 | 1.27mi |
| 2021 Fraser St Port Charlotte, FL | 2.0 | 2.0 | 935 | $1,450 | $1.55 | 13d | 1 | 1.27mi |
| 2046 Hilton St Port Charlotte, FL | 2.0 | 2.0 | 1052 | $1,375 | $1.31 | 20d | 1 | 1.30mi |
| 2084 Hilton St Port Charlotte, FL | 2.0 | 2.0 | 1052 | $1,395 | $1.33 | 13d | 1 | 1.30mi |
| 2233 Fraser St Unit 2235 Port Charlotte, FL | 3.0 | 2.0 | 1162 | $1,647 | $1.42 | 20d | 1 | 1.34mi |
| 1225 Armsdale Ave Port Charlotte, FL | 3.0 | 2.0 | 1140 | $1,525 | $1.34 | 20d | 1 | 1.41mi |
Listing history 29 events
-
2026-06-18days on market $230,000 Active 30 DOM
-
2026-06-17days on market $230,000 Active 29 DOM
-
2026-06-16days on market $230,000 Active 28 DOM
-
2026-06-15days on market $230,000 Active 27 DOM
-
2026-06-14days on market $230,000 Active 25 DOM
-
2026-06-13days on market $230,000 Active 24 DOM
-
2026-06-10days on market $230,000 Active 22 DOM
-
2026-06-09days on market $230,000 Active 21 DOM
-
2026-06-08days on market $230,000 Active 20 DOM
-
2026-06-07days on market $230,000 Active 19 DOM
-
2026-06-05days on market $230,000 Active 16 DOM
-
2026-06-03days on market $230,000 Active 15 DOM
-
2026-06-02days on market $230,000 Active 14 DOM
-
2026-06-01days on market $230,000 Active 13 DOM
-
2026-05-31days on market $230,000 Active 12 DOM
-
2026-05-30days on market $230,000 Active 11 DOM
-
2026-05-19$230,000 Active
-
2016-12-30soldstatus $131,500
-
2016-12-29soldstatus $131,500 Sold 531-char remark
Show marketing remark (531 chars)
Looking for a Super clean move in ready condition home in Port Charlotte this is it. Three bedrooms, two bathrooms, garage with a screened in lanai. Porcelain tile though out main living area on a diagonal, carpet in the bedrooms. Ceiling fans in bedrooms and living room. This property is located in an X flood zone on a over-sized corner lot. There is city water, square D electric panel installed 4/2012, Ac with all duct work installed on 10/2015. This home is close to everything being located in the heart of Port Charlotte.
-
2016-12-07status Pending 531-char remark
Show marketing remark (531 chars)
Looking for a Super clean move in ready condition home in Port Charlotte this is it. Three bedrooms, two bathrooms, garage with a screened in lanai. Porcelain tile though out main living area on a diagonal, carpet in the bedrooms. Ceiling fans in bedrooms and living room. This property is located in an X flood zone on a over-sized corner lot. There is city water, square D electric panel installed 4/2012, Ac with all duct work installed on 10/2015. This home is close to everything being located in the heart of Port Charlotte.
-
2016-11-28$132,900 Active 531-char remark
Show marketing remark (531 chars)
Looking for a Super clean move in ready condition home in Port Charlotte this is it. Three bedrooms, two bathrooms, garage with a screened in lanai. Porcelain tile though out main living area on a diagonal, carpet in the bedrooms. Ceiling fans in bedrooms and living room. This property is located in an X flood zone on a over-sized corner lot. There is city water, square D electric panel installed 4/2012, Ac with all duct work installed on 10/2015. This home is close to everything being located in the heart of Port Charlotte.
-
2012-04-13historical
-
2012-01-26soldstatus $35,000
-
2011-10-21$44,900
-
2011-10-14$39,900
-
2011-08-18historical
-
2010-09-20$34,600
-
1997-11-17soldstatus $48,000
-
1988-03-01soldstatus $50,000
ⓘ Source: listings_history table (triggers on properties + properties_extension) + one-shot
backfill from property_details.listing_events for pre-trigger history.
Tax reassessment forecast FL · Resets to sale price
- Current annual tax
- $1,516 · $126/mo
- Projected year-2 tax
- $1,909 · $159/mo
- Expected delta
- +$393/yr (+$33/mo · 25.9%)
ⓘ Screening estimate from a state-policy table — verify with the county assessor before closing.
Climate risk First Street
- Flood 7/10 Severe FEMA zone X (shaded) · 73% chance over 30 yrs
- Wildfire 1/10 Low
- Heat 10/10 Extreme 7 d/yr ≥107°F today · 28 d/yr by 30 yrs out
- Wind 10/10 Extreme 99% chance of damaging wind over 30 yrs
- Air quality 3/10 Moderate 2 unhealthy d/yr today · 2 by 30 yrs out
Nearby sold comps map
Loading sold comps map…
Walkable amenities ~0.75 mi
Loading nearby amenities…
Taxation est. · year 1
- Rental income
- $21,503
- − Mortgage interest
- −$12,884
- − Property taxes
- −$1,516
- − Insurance
- −$1,948
- − Repairs & maintenance
- −$1,720
- − Management
- −$1,720
- − Depreciation
- −$6,691
- Taxable loss
- −$4,976
- Est. tax savings @ 24.0%
- +$1,194
- After-tax cash flow
- $244/yr
For passive investors: Depreciation is non-cash, so a rental often shows a tax loss while cash-flowing — sheltering income. Rental losses are passive: they offset passive income freely, and up to $25,000/yr can offset ordinary (W-2) income if you actively participate and your MAGI is under $100k (phasing out to $0 by $150k); unused losses carry forward. On sale, claimed depreciation is recaptured at up to 25%, and gains may owe capital-gains tax (a 1031 exchange can defer both). Figures are a year-1 estimate at your 24.0% rate — not tax advice; consult a CPA.
Schools (NCES district)
- District
- Charlotte
- NCES district ID
- 1200240
- Math proficiency
- 54% ▼ -6.00%
- Reading proficiency
- 54% ▼ -1.00%
- Median HH income
- $44,864
- Composite
- 45.62/100
- National rank
- #2586
- State rank
- #22 of 73 in FL
Livability — Port Charlotte
- Score
- 65/100
- State rank
- #655
- US rank
- #13081
Category grades
Schools grade is shown separately in the Schools card above.
Census & demographics
- Census place
- Port Charlotte, FL
- County
- Charlotte County · 196,994 people
- City population
- 102,180
- Metro
- Punta Gorda, FL
- Population (ZIP)
- 18,696
- Household income
- $62,744
- Rent vs Own
- Severe rent burden
- 501.0
Population outlook (Charlotte County) Hauer SSP2
- Today (2025)
- 198,646 people
- By 2030
- 210,507 · +6.0%
- By 2040
- 230,857 · +16.2%
- By 2050
- 247,148 · +24.4%
- By 2075
- 281,777 · +41.8%
- By 2100
- 293,609 · +47.8%
Race, ethnicity, and origin ACS 2023
- Neighborhood character
- Predominantly White (79%)
- Race & ethnicity
- White 79% Two or more races 8% Black 7% Hispanic / Latino 7% Asian 2%
- Hispanic origin (detail)
- Mexican 2% Puerto Rican 1%
- Common ancestry
- Lithuanian 5% Romanian 4% Iranian 2%
- Foreign-born
- 11% · Canada
- Languages at home
- 88% English-only · Spanish 5% Russian/Polish/Slavic 2% Other Indo-European 1%
Political lean MEDSL · Charlotte
- 2024 margin
- Solid R (+34.0) · D 32.7% · R 66.7%
- 2008→2024 swing
- -26.7pp toward R · 2008: -7.2pp · 2024: -34.0pp
- All cycles
- 2024: R+34.0 2020: R+26.6 2016: R+27.8 2012: R+14.3 2008: R+7.2
Not yet ingested
- Civics
- —
Market trends
- HPI YoY
- ▼ -55.31%
- Current HPI
- 315.0548
- Rent YoY
- ▼ -1.63%
- Metro
- Punta Gorda, FL
- State GDP YoY
- ▲ 3.28%
- F500 in state
- 36
Industry mix (Fortune 500 HQ in FL)
| Industry | F500 HQs | Revenue |
|---|---|---|
| Industrial Technology | 2 | $29B |
|
||
| Insurance | 2 | $17B |
|
||
| Retail | 1 | $60B |
|
||
| Technology Distribution | 1 | $58B |
|
||
| Homebuilding | 1 | $35B |
|
||
| Technology Manufacturing | 1 | $35B |
|
||
Price history
+360.0% since first listed13 events — show timeline
- 2026-05-19 Listed $230,000 Stellar MLS as Distributed by MLS Grid
- 2016-12-30 Sold (Public Records) $131,500 Public Records
- 2016-12-29 Sold (MLS) $131,500 Stellar MLS as Distributed by MLS Grid
- 2016-12-07 Pending — Stellar MLS as Distributed by MLS Grid
- 2016-11-28 Listed $132,900 Stellar MLS as Distributed by MLS Grid
- 2012-04-13 Listing Removed — MiRealSource-MiMLS
- 2012-01-26 Sold (MLS) $35,000 Stellar MLS as Distributed by MLS Grid
- 2011-10-21 Listed $44,900 MiRealSource-MiMLS
- 2011-10-14 Listed $39,900 Stellar MLS as Distributed by MLS Grid
- 2011-08-18 Listing Removed — Stellar MLS as Distributed by MLS Grid
- 2010-09-20 Listed $34,600 Stellar MLS as Distributed by MLS Grid
- 1997-11-17 Sold (Public Records) $48,000 Public Records
- 1988-03-01 Sold (Public Records) $50,000 Public Records
Property tax history
+2.6%/yrLatest (2025): $1,516 · +2.1% YoY. Source: county tax records.
Cash-flow waterfall
monthlySold comps — $/sqft
last 12 mo · ≤1 miLoading sold comps…