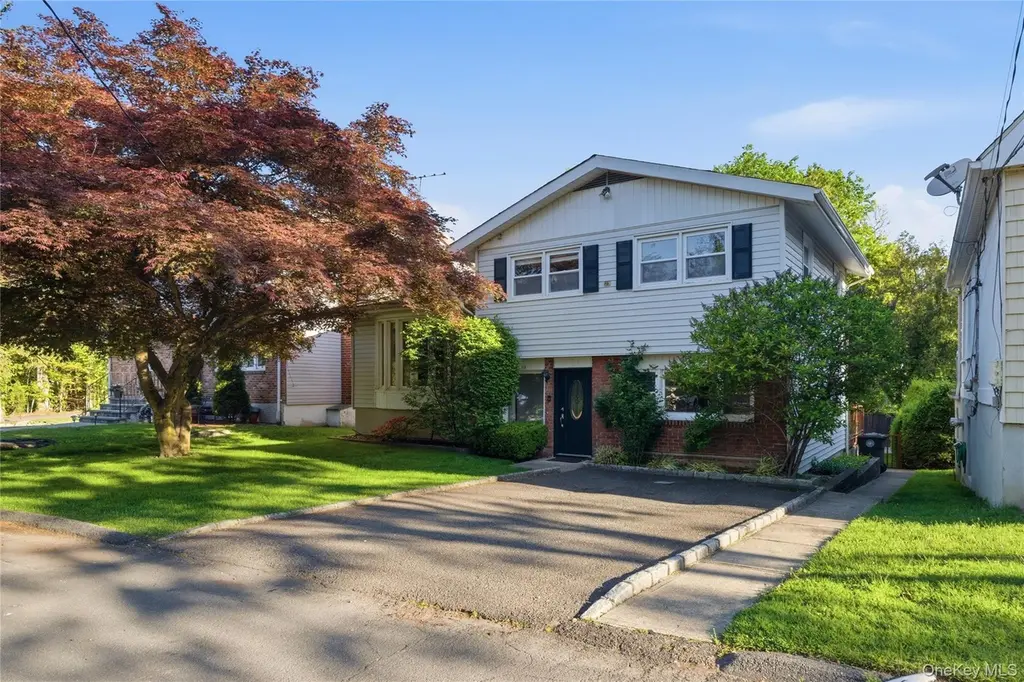
136 Condit St · Harrison, NY
Flood risk 3/10 · Minor
- FEMA flood zone
- X (unshaded)
- Chance of flooding over 30 yrs
- 0.2%
- Est. flood insurance / yr
- $473 – $860
Fire risk 2/10 · Minimal
- Est. fire insurance / yr
- $691 – $1,283
Heat risk 6/10 · Moderate
- Hot days now (above 98°F)
- 7 days/yr
- Hot days in 30 yrs
- 16 days/yr
Wind risk 6/10 · Moderate
- Chance of severe wind over 30 yrs
- 27.0%
Air-quality risk 4/10 · Minor
- Unhealthy air days now
- 5 days/yr
- Unhealthy air days in 30 yrs
- 7 days/yr
Risk factors via First Street. Map © Google.
Why this score? — see what drove the D grade
The composite is a weighted blend of 9 inputs, each scored 0–100. Each bar is that input's sub-score; the figure is the points it added to the 100-point composite (weight × sub-score).
- ARV discount +11.8/15.0
- Cash flow +8.4/30.0
- Schools +6.5/10.0
- Rent growth +4.9/5.0
- Livability +3.6/5.0
- Condition / age +2.5/5.0
- 1% rule +2.3/10.0
- DSCR +2.3/10.0
- Appreciation +0.0/10.0
$899,000
🖨 Deal sheet (PDF) 📄 Offer letter ✓ Due diligence
Listing remarks
Welcome to 136 Condit Street—a charming 4-bedroom, 2-bathroom home that blends comfort and convenience. The inviting living room features vaulted ceilings and a cozy fireplace, creating the perfect space for both relaxing and entertaining. The finished lower level offers incredible flexibility, great for use as an expansive recreation space, home office or gym. From the kitchen, step out onto a freshly stained deck overlooking a lush, level backyard—ideal for outdoor gatherings. Hardwood floors lie preserved beneath the carpeting throughout. Ideally located near Veteran’s Memorial Park, schools, and only one mile from the Harrison train station, shopping, and dining, this
Key facts
- 4,792 sq ft lot
- Built 1962
- Listed 38 days
Property features AI
Exterior
- Parking: Driveway
- Utilities: Con-Edison electric service; Natural gas connected; Public water; Public sewer; Trash collection
- Home design: Single family residence
- Construction: Vinyl siding construction
- Exterior features: Vinyl siding; Not waterfront
Interior
- Kitchen: Range; Refrigerator; Dishwasher
- Bedrooms: Total rooms: 8
- Flooring: Carpet; Hardwood; Vinyl; Combination flooring
- Bathrooms: 2 full bathrooms
- Heating & cooling: Hot water heat; Steam heat; Central air conditioning; One fireplace
- Interior features: Cathedral ceilings; Partial basement; Pull-down attic stairs; Basement laundry
- Laundry & utility: Washer; Dryer; Laundry located in basement
Neighborhood map
What this means for you Summary
Snapshot
- This is a 4-bed/2.0-bath single-family listed at $899k.
Deal economics
- At list price, monthly cash flow is $-813 ($-10k/yr) — negative.
- To cash-flow at today's rent, offer at most $755k (16.0% below list).
- To meet the 1% rule (rent ≥ 1% of price), the offer needs to be $659k (26.7% below list).
- Recommended offer: $659k (26.7% below list) — sets the bar for 1% rule.
- Cap rate 5.2% vs local median 2.2% in Harrison — top-decile yield for the area; either an underpriced asset or a hidden risk that comps aren't pricing in. Stress-test before assuming the spread holds.
Location & tenants
- Location reads 72/100 on livability (#355 in NY) — a middle-class / working-renter tenant base. Strengths: commute A+, employment A+, crime A; Watch: housing C-, amenities F, cost of living F.
- Harrison Central School District (suburban): math 69% / reading 72% proficiency, ranked #92 of 590 in NY (top 16%) — strong family-tenant draw, lease renewals of 3-5y typical; only 10% free/reduced lunch — higher-income household profile.
- Zoned schools: Harrison Avenue Elementary School (math 83% / reading 85%, grade A+, #122 of 2,108 statewide, top 6%, 559 students, 8% FRL); Louis M Klein Middle School (math 51% / reading 71%, grade B+, #150 of 729 statewide, top 21%, 824 students, 22% FRL); Harrison High School (math 96%, 1,064 students, 21% FRL).
- Market conditions: Rents rising fast (+9.7%/yr); 63 active listings in the ZIP; 18 comparable units currently listed for rent nearby; rentals at typical pace (median 21d on market — plan ~3-4 weeks tenant-placement turnaround); high-income renter base; 954 units permitted in Westchester County in 2024 (649 in 5+ unit buildings).
- At $6,586/mo this rent would consume 51% of the median local household income ($154k/yr) (locally 461% of renters already pay >50% of income on rent) — very limited rent-growth headroom before tenants either downsize or default.
Forward outlook
- Local home prices are declining (-3.0%/yr); year-one equity from $6k of loan paydown is wiped out by about $27k of value loss. Plan a longer hold.
- Westchester County population projected at +10% by 2050 — modest demand growth; plan on rents tracking national, not racing it.
Negotiation context
- It's been on market 39 days — a 3% lower offer ($872k) is reasonable based on typical stale-listing flexibility.
- Current owner paid $290k; list at $899k implies a 210% gain — meaningful room to come down on a strong offer.
Risks & watch-outs
- Climate carrying-cost: major wind risk, 27% chance of damaging wind over 30y; extreme-heat days projected 7→16/yr by 2055 (HVAC capex compounding) — expect insurance premiums to compound above CPI over the hold.
Questions for the listing agent
- What do current leases actually rent for vs. the listed asking? Can we see a recent rent roll and the last 12 months of T-12 income?
- It's been on market 39 days. Have you received any prior offers? Is the seller open to a 27% concession, seller financing, or rate buy-down credit?
- Built in 1962 — when were the roof, HVAC, electrical panel, plumbing, and water heater last replaced?
- Is there a deadline driving the sale (1031 exchange, divorce, estate, relocation)? That informs how much negotiation room exists.
- Schools are A-rated — typically a magnet for longer-tenancy family renters. What's the average tenant stay here, and is there a school-zone premium baked into asking?
- The area grade is low — what's the realistic commute time and amenity access for the typical tenant pool here? Any planned neighborhood developments (good or bad) we should know about?
- What's the average days-on-market for RENTAL listings here right now (not sales)? A rising rental-DOM trend means longer vacancies and softer asking-rent achievability than the comps imply.
- What's the recent tenant-quality profile in this submarket — average credit score on applications, eviction rate, late-payment / NSF rate, and stable-employment percentage? A property-management company in the area should have these aggregated.
- How much new for-sale + rental construction is in the pipeline within 1–3 miles? Heavy new supply typically softens prices + rents 12–24 months out; constrained supply supports both.
Investment metrics
- 1% rule
- 0.73% ✗
- Cap rate
- 5.21%
- Cash-on-cash
- -3.87%
- DSCR
- 0.83
- GRM
- 11.4
CMA / ARV
- ARV (median comp)
- $993,767
- List price
- $899,000
- Delta
- -9.54%
- Verdict
- FAIR
- Comps
- 20 within 1.0 mi
Show comp detail 8 sales within ~0.75 mi
| Address | Dist | Beds/Ba | Sqft | Sold | Price | $/sf | Match |
|---|---|---|---|---|---|---|---|
| 87 Crystal St | 0.15mi | 3/2.0 (-1) | 1,642 (+9%) | 12mo | $475,000 | $289 | 63 |
| 43 Bellain Ave | 0.43mi | 3/2.0 (-1) | 1,562 (+3%) | 11mo | $1,030,000 | $659 | 60 |
| 176 Adelphi Ave | 0.16mi | 3/2.0 (-1) | 1,370 (-9%) | 15mo | $800,000 | $584 | 60 |
| 13 Sunnyside Pl | 0.60mi | 3/1.0 (-1) | 1,487 (-2%) | 6mo | $999,000 | $672 | 55 |
| 66 Sterling Ave | 0.73mi | 4/2.0 | 1,530 (+1%) | 13mo | $938,300 | $613 | 53 |
| 90 Frances Ave | 0.61mi | 3/2.0 (-1) | 1,311 (-13%) | 11mo | $563,000 | $429 | 35 |
| 39 Danner Ave | 0.59mi | 3/1.0 (-1) | 1,349 (-11%) | 20mo | $890,000 | $660 | 29 |
| 17 Adelphi Ave | 0.63mi | 3/2.0 (-1) | 1,344 (-11%) | 22mo | $882,500 | $657 | 28 |
Match score weights: distance 35% · size 25% · config 20% · recency 20%. Top-matched comps best support the ARV.
Projected returns pro-forma
-3.0% appreciation · 8.0% rent growth · sell at horizon
- IRR
- -17.6%
- Equity multiple
- 0.35×
- Total profit
- $-162,662
- Equity at exit
- $134,044
- IRR
- -2.4%
- Equity multiple
- 0.80×
- Total profit
- $-49,984
- Equity at exit
- $77,729
Cash invested: $251,720 (down + closing). Projections, not guarantees.
Landlord ↔ Tenant lean methodology
- Overall (STATE)
- 15 Strongly Tenant-Friendly
- State New York
- 15 Strongly Tenant-Friendly · D+10
- County
- — inherits STATE
- City
- — inherits STATE
ZIP-level market 10528
- Home prices YoY
- -18.4%
- Rents YoY
- 9.7%
- Active inventory
- 63
- Price-to-rent
- 11.4×
Monthly cashflow live
- Estimated rent
- $6,586 high interval (Pro) →
- Mortgage (P&I)
- −$4,714
- Tax from tax record
- −$927 /mo · $11,118/yr
- Insurance
- −$375
- HOA
- −$0
- Vacancy / Maint / Mgmt
- −$1,383
- Net cashflow
- $-813
Break-even live
Sensitivity live
| Price | -10% $-304 | -5% $-558 | +0% $-813 | +5% $-1,067 | +10% $-1,322 |
|---|---|---|---|---|---|
| Rent | -10% $-1,333 | -5% $-1,073 | +0% $-813 | +5% $-553 | +10% $-293 |
| Rate | -1.0pp $-360 | -0.5pp $-584 | base $-813 | +0.5pp $-1,046 | +1.0pp $-1,283 |
UW: 25.0% down · 7.5% · 30yr · 1.5% tax · 5.0% vac · 8.0% maint · 8.0% mgmt
Financing live
Cash to close
- Down payment
- $224,750
- Closing costs
- $26,970
- Reserves months
- —
- Total cash needed
- —
Loan-product check · same deal, 3 products live
Conventional
25% down · 7.5% · 30yr
- Down + closing
- —
- Monthly P&I
- —
- Monthly cashflow
- —
- DSCR
- —
- Eligible?
- —
Personal DTI + credit; lowest rate.
DSCR
20% down · 8.5% · 30yr
- Down + closing
- —
- Monthly P&I
- —
- Monthly cashflow
- —
- DSCR
- —
- Eligible?
- —
No personal income docs; deal must DSCR.
Hard money
10% down · 12.0% · 12mo
- Down + closing
- —
- Monthly P&I
- —
- Monthly cashflow
- —
- DSCR
- —
- Eligible?
- —
Short-term bridge; refi at stabilization.
Rent comps 18 comps
| Address | Beds | Baths | Sqft | Rent | $/sqft | DOM | Units | Dist |
|---|---|---|---|---|---|---|---|---|
| 89 Crystal St Harrison, NY | 3.0 | 2.5 | 1700 | $8,250 | $4.85 | 21d | 1 | 0.13mi |
| 87 Crystal St Harrison, NY | 3.0 | 2.5 | 1700 | $8,250 | $4.85 | 21d | 1 | 0.13mi |
| 140 Rockwell St Unit A Harrison, NY | 3.0 | 2.5 | 1850 | $7,000 | $3.78 | 6d | 1 | 0.23mi |
| 69 Ellsworth Ave Harrison, NY | 3.0 | 2.5 | 2000 | $6,500 | $3.25 | 45d | 1 | 0.32mi |
| 135 Webster Ave Harrison, NY | 3.0 | 1.0 | 1500 | $3,300 | $2.20 | 21d | 1 | 0.35mi |
| 52 Nelson Ave Unit 2 Harrison, NY | 3.0 | 1.5 | 1450 | $4,000 | $2.76 | 21d | 1 | 0.42mi |
| 8 Marion Ave #6 Harrison, NY | 3.0 | 2.5 | 1420 | $6,400 | $4.51 | 6d | 1 | 0.60mi |
| 332 Halstead Ave Harrison, NY | 1.0–3.0 | 1.0–3.0 | 1116 | $5,000 | $4.48 | 0d | 1 | 0.71mi |
| 132 Halstead Ave Unit 4D Harrison, NY | 3.0 | 2.5 | 1329 | $6,850 | $5.15 | 45d | 1 | 0.76mi |
| 69 Oak St Unit B Harrison, NY | 3.0 | 3.5 | 2100 | $7,000 | $3.33 | 0d | 1 | 0.79mi |
| 8 Davenport St Harrison, NY | 3.0 | 2.0 | 1700 | $5,000 | $2.94 | 5d | 1 | 0.81mi |
| 14 Fremont St Unit 1 Harrison, NY | 3.0 | 2.0 | 1500 | $4,300 | $2.87 | 9d | 1 | 0.96mi |
| 29 Fremont St Unit B Harrison, NY | 3.0 | 2.0 | 1330 | $4,500 | $3.38 | 45d | 1 | 0.97mi |
| 1016 Jefferson Ave Mamaroneck, NY | 3.0 | 1.5 | 1300 | $4,200 | $3.23 | 21d | 1 | 1.06mi |
| 1408 Henry Ave #2 Mamaroneck, NY | 3.0 | 1.5 | 1400 | $4,200 | $3.00 | 45d | 1 | 1.12mi |
| 625 Lorraine St Mamaroneck, NY | 5.0 | 2.0 | 1926 | $6,300 | $3.27 | 0d | 1 | 1.16mi |
| 9 Marlene Ct Rye, NY | 4.0 | 3.0 | 1750 | $10,500 | $6.00 | 9d | 1 | 1.38mi |
| 317 Hornidge Rd Mamaroneck, NY | 4.0 | 2.0 | 1600 | $5,500 | $3.44 | 19d | 1 | 1.40mi |
Listing history 19 events
-
2026-06-21days on market $899,000 Active 39 DOM
-
2026-06-18days on market $899,000 Active 36 DOM
-
2026-06-17days on market $899,000 Active 35 DOM
-
2026-06-16days on market $899,000 Active 34 DOM
-
2026-06-15days on market $899,000 Active 33 DOM
-
2026-06-13days on market $899,000 Active 31 DOM
-
2026-06-13days on market $899,000 Active 30 DOM
-
2026-06-09days on market $899,000 Active 27 DOM
-
2026-06-08days on market $899,000 Active 26 DOM
-
2026-06-07days on market $899,000 Active 25 DOM
-
2026-06-04pricedays on market $899,000 Active 22 DOM
-
2026-06-03days on market $949,000 Active 21 DOM
-
2026-06-02days on market $949,000 Active 20 DOM
-
2026-06-01days on market $949,000 Active 19 DOM
-
2026-05-31days on market $949,000 Active 18 DOM
-
2026-05-14$949,000 Active 764-char remark
-
2026-05-12historical $949,000 764-char remark
-
1998-06-18soldstatus $290,000
-
1996-09-23soldstatus $270,000
ⓘ Source: listings_history table (triggers on properties + properties_extension) + one-shot
backfill from property_details.listing_events for pre-trigger history.
Tax reassessment forecast NY · Partial reset (capped growth)
- Current annual tax
- $11,118 · $927/mo
- Projected year-2 tax
- $13,156 · $1,096/mo
- Expected delta
- +$2,037/yr (+$170/mo · 18.3%)
ⓘ Screening estimate from a state-policy table — verify with the county assessor before closing.
Climate risk First Street
- Flood 3/10 Moderate FEMA zone X (unshaded) · 20% chance over 30 yrs
- Wildfire 2/10 Low
- Heat 6/10 Major 7 d/yr ≥98°F today · 16 d/yr by 30 yrs out
- Wind 6/10 Major 27% chance of damaging wind over 30 yrs
- Air quality 4/10 Moderate 5 unhealthy d/yr today · 7 by 30 yrs out
Nearby sold comps map
Loading sold comps map…
Walkable amenities ~0.75 mi
Loading nearby amenities…
Taxation est. · year 1
- Rental income
- $79,029
- − Mortgage interest
- −$50,358
- − Property taxes
- −$11,118
- − Insurance
- −$4,495
- − Repairs & maintenance
- −$6,322
- − Management
- −$6,322
- − Depreciation
- −$26,153
- Taxable loss
- −$25,739
- Est. tax savings @ 24.0%
- +$6,177
- After-tax cash flow
- $-3,576/yr
For passive investors: Depreciation is non-cash, so a rental often shows a tax loss while cash-flowing — sheltering income. Rental losses are passive: they offset passive income freely, and up to $25,000/yr can offset ordinary (W-2) income if you actively participate and your MAGI is under $100k (phasing out to $0 by $150k); unused losses carry forward. On sale, claimed depreciation is recaptured at up to 25%, and gains may owe capital-gains tax (a 1031 exchange can defer both). Figures are a year-1 estimate at your 24.0% rate — not tax advice; consult a CPA.
Schools (NCES district)
- District
- Harrison Central School District
- NCES district ID
- 3613740
- Math proficiency
- 69% ▼ -6.00%
- Reading proficiency
- 72% ▲ 6.00%
- Median HH income
- $105,919
- Composite
- 65.12/100
- National rank
- #497
- State rank
- #92 of 590 in NY
Livability — Harrison
- Score
- 72/100
- State rank
- #355
- US rank
- #5963
Category grades
Schools grade is shown separately in the Schools card above.
Census & demographics
- Census place
- Harrison, NY
- County
- Westchester County · 709,332 people
- City population
- 14,091
- Metro
- New York-Newark-Jersey City, NY-NJ-PA
- Population (ZIP)
- 14,091
- Household income
- $154,416
- Rent vs Own
- Severe rent burden
- 461.0
Population outlook (Westchester County) Hauer SSP2
- Today (2025)
- 1,028,035 people
- By 2030
- 1,051,636 · +2.3%
- By 2040
- 1,098,520 · +6.9%
- By 2050
- 1,136,044 · +10.5%
- By 2075
- 1,196,925 · +16.4%
- By 2100
- 1,175,147 · +14.3%
Race, ethnicity, and origin ACS 2023
- Neighborhood character
- Predominantly White (68%)
- Race & ethnicity
- White 68% Hispanic / Latino 16% Asian 10% Two or more races 5% Black 3%
- Hispanic origin (detail)
- Puerto Rican 4% Salvadoran 1%
- Common ancestry
- Lithuanian 3% Romanian 2% Scotch-Irish 2%
- Foreign-born
- 23% · Canada, Dominican Republic, China
- Languages at home
- 70% English-only · Spanish 11% Other Indo-European 8% Other Asian/Pacific 7%
Political lean MEDSL · Westchester
- 2024 margin
- Strong D (+26.3) · D 63.1% · R 36.9%
- 2008→2024 swing
- -1.3pp toward R · 2008: 27.6pp · 2024: 26.3pp
- All cycles
- 2024: D+26.3 2020: D+36.3 2016: D+32.8 2012: D+22.2 2008: D+27.6
Not yet ingested
- Civics
- —
Market trends
- HPI YoY
- ▼ -66.61%
- Current HPI
- 296.3824
- Rent YoY
- ▲ 9.65%
- Metro
- New York-Newark-Jersey City, NY-NJ-PA
- State GDP YoY
- ▲ 2.60%
- F500 in state
- 92
Industry mix (Fortune 500 HQ in NY)
| Industry | F500 HQs | Revenue |
|---|---|---|
| Financial Services | 10 | $950B |
|
||
| Consumer Goods | 9 | $162B |
|
||
| Insurance | 4 | $225B |
|
||
| Telecommunications | 2 | $144B |
|
||
| Pharmaceuticals | 2 | $112B |
|
||
| Media / Entertainment | 2 | $69B |
|
||
Price history
+233.0% since first listed5 events — show timeline
- 2026-06-04 Price Changed $899,000 OneKey® MLS as Distributed by MLS Grid
- 2026-05-14 Listed $949,000 OneKey® MLS as Distributed by MLS Grid
- 2026-05-12 Coming Soon $949,000 OneKey® MLS as Distributed by MLS Grid
- 1998-06-18 Sold (Public Records) $290,000 Public Records
- 1996-09-23 Sold (Public Records) $270,000 Public Records
Property tax history
+2.6%/yrLatest (2025): $11,118 · -8.7% YoY. Source: county tax records.
Cash-flow waterfall
monthlySold comps — $/sqft
last 12 mo · ≤1 miLoading sold comps…