105 Concho St Unit A · Tye, TX
Flood risk 1/10 · Minimal
- FEMA flood zone
- X (unshaded)
- Chance of flooding over 30 yrs
- 0.0%
- Est. flood insurance / yr
- $507 – $1,088
Fire risk 8/10 · Major
- Est. fire insurance / yr
- $1,222 – $2,270
Heat risk 6/10 · Moderate
- Hot days now (above 104°F)
- 7 days/yr
- Hot days in 30 yrs
- 21 days/yr
Wind risk 4/10 · Minor
- Chance of severe wind over 30 yrs
- 14.0%
Air-quality risk 1/10 · Minimal
- Unhealthy air days now
- 0 days/yr
- Unhealthy air days in 30 yrs
- 0 days/yr
Risk factors via First Street. Map © Google.
Why this score? — see what drove the B- grade
The composite is a weighted blend of 9 inputs, each scored 0–100. Each bar is that input's sub-score; the figure is the points it added to the 100-point composite (weight × sub-score).
- Cash flow +30.0/30.0
- 1% rule +10.0/10.0
- DSCR +10.0/10.0
- Appreciation +7.1/10.0
- Livability +3.3/5.0
- Schools +3.2/10.0
- Rent growth +2.5/5.0
- Condition / age +2.5/5.0
- ARV discount +0.0/15.0
$65,000
🖨 Deal sheet 📄 Offer letter ✓ Due diligence
Listing remarks MLS
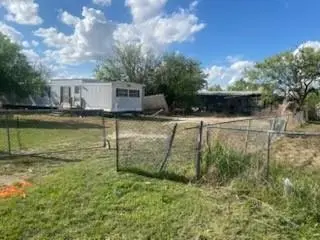
Great opportunity in Tye Texas to have over half an acre of land. Two mobile homes on the property that do need rehab work. Land has been cleared and good opportunity to build or rehab the mobile homes. Large lot with convenient access in heart of Tye. Easy access to interstate 20. This place is ready to go for someone new.
Key facts
- 0.57 acre lot
- 2 parking spots
- Built 1978
Neighborhood map
What this means for you Summary
Snapshot
- This is a 3-bed/1.5-bath manufactured listed at $65k.
Deal economics
- At list price, monthly cash flow is $1k ($16k/yr) — positive.
- The deal already cash-flows at list — no discount required.
- Meets the 1% rule at list price ($2k rent vs $65k).
- Recommended offer: $63k (3.0% below list) — sets the bar for market timing.
Location & tenants
- Location reads 66/100 on livability (#631 in TX) — a middle-class / working-renter tenant base. Strengths: crime A+, cost of living A+, housing A+; Watch: employment C-, health & safety D+, schools F.
- Merkel ISD (rural): math 37% / reading 39% proficiency, ranked #460 of 826 in TX (top 56%) — families likely to look elsewhere, expect single-tenant / working-renter base with shorter leases.
- Market conditions: 11 active listings in the ZIP; 3 comparable units currently listed for rent nearby; rentals at typical pace (median 25d on market — plan ~3-4 weeks tenant-placement turnaround); 508 units permitted in Taylor County in 2024 (0 in 5+ unit buildings).
Forward outlook
- In year one you build about $3k of equity ($449 loan paydown + $3k appreciation (4.2% local appreciation)).
- Taylor County population projected at +16% by 2050 — long-run rental-demand tailwind backs the buy-and-hold thesis.
- At projected returns (4.2% appreciation + 3.0% rent growth), your $18k cash investment doubles in ~1 year — after that, you're playing with house money.
- By year 10, paydown + projected appreciation supports a ~$31k cash-out refi (75% LTV) — recoverable capital for the next deal without selling this one.
Negotiation context
- It's been on market 45 days — a 3% lower offer ($63k) is reasonable based on typical stale-listing flexibility.
Risks & watch-outs
- Climate carrying-cost: severe wildfire risk; extreme-heat days projected 7→21/yr by 2055 (HVAC capex compounding) — expect insurance premiums to compound above CPI over the hold.
Questions for the listing agent
- It's been on market 45 days. Have you received any prior offers? Is the seller open to a 3% concession, seller financing, or rate buy-down credit?
- Built in 1978 — when were the roof, HVAC, electrical panel, plumbing, and water heater last replaced?
- Is there a deadline driving the sale (1031 exchange, divorce, estate, relocation)? That informs how much negotiation room exists.
- Schools are F-rated, which usually means shorter tenancies and higher turnover. Who's the typical renter profile here, and what's been the actual vacancy rate?
- What's the average days-on-market for RENTAL listings here right now (not sales)? A rising rental-DOM trend means longer vacancies and softer asking-rent achievability than the comps imply.
- What's the recent tenant-quality profile in this submarket — average credit score on applications, eviction rate, late-payment / NSF rate, and stable-employment percentage? A property-management company in the area should have these aggregated.
- How much new for-sale + rental construction is in the pipeline within 1–3 miles? Heavy new supply typically softens prices + rents 12–24 months out; constrained supply supports both.
Investment metrics
- 1% rule
- 3.40% ✓
- Cap rate
- 31.12%
- Cash-on-cash
- 88.66%
- DSCR
- 4.94
- GRM
- 2.5
CMA / ARV
- ARV (median comp)
- $45,000
- List price
- $65,000
- Delta
- 44.44%
- Verdict
- OVERPRICED
- Comps
- 2 within 1.0 mi
Projected returns pro-forma
4.22% appreciation · 3.0% rent growth · sell at horizon
- IRR
- 93.8%
- Equity multiple
- 6.37×
- Total profit
- $97,759
- Equity at exit
- $33,783
- IRR
- 92.6%
- Equity multiple
- 13.25×
- Total profit
- $222,985
- Equity at exit
- $55,924
Cash invested: $18,200 (down + closing). Projections, not guarantees.
Landlord ↔ Tenant lean methodology
- Overall (STATE)
- 87 Strongly Landlord-Friendly
- State Texas
- 87 Strongly Landlord-Friendly · R+5
- County
- — inherits STATE
- City
- — inherits STATE
ZIP-level market 79563
- Home prices YoY
- 2.3%
- Active inventory
- 11
- Price-to-rent
- 2.5×
Monthly cashflow live
- Estimated rent
- $2,209 medium interval (Pro) →
- Mortgage (P&I)
- −$341
- Tax from tax record
- −$32 /mo · $388/yr
- Insurance
- −$27
- HOA
- −$0
- Vacancy / Maint / Mgmt
- −$464
- Net cashflow
- $1,345
Break-even live
UW: 25.0% down · 7.5% · 30yr · 1.5% tax · 5.0% vac · 8.0% maint · 8.0% mgmt
Financing live
Cash to close
- Down payment
- $16,250
- Closing costs
- $1,950
- Reserves months
- —
- Total cash needed
- —
Loan-product check · same deal, 3 products live
Conventional
25% down · 7.5% · 30yr
- Down + closing
- —
- Monthly P&I
- —
- Monthly cashflow
- —
- DSCR
- —
- Eligible?
- —
Personal DTI + credit; lowest rate.
DSCR
20% down · 8.5% · 30yr
- Down + closing
- —
- Monthly P&I
- —
- Monthly cashflow
- —
- DSCR
- —
- Eligible?
- —
No personal income docs; deal must DSCR.
Hard money
10% down · 12.0% · 12mo
- Down + closing
- —
- Monthly P&I
- —
- Monthly cashflow
- —
- DSCR
- —
- Eligible?
- —
Short-term bridge; refi at stabilization.
Rent comps 3 comps
| Address | Beds | Baths | Sqft | Rent | $/sqft | DOM | Units | Dist |
|---|---|---|---|---|---|---|---|---|
| 136 Nolan St Unit B Tye, TX | 2.0 | 1.0 | 692 | $3,000 | $4.34 | 13d | 1 | 0.10mi |
| 138 Nolan St Unit B Tye, TX | 2.0 | 1.0 | 692 | $1,500 | $2.17 | 24d | 1 | 0.11mi |
| 102 Mendy Ln Tye, TX | 2.0 | 2.0 | 1064 | $1,495 | $1.41 | 44d | 1 | 0.62mi |
Listing history 3 events
-
2026-04-11$65,000 Active 330-char remark
Show marketing remark (330 chars)
Great opportunity in Tye Texas to have over half an acre of land. Two mobile homes on the property that do need rehab work. Land has been cleared and good opportunity to build or rehab the mobile homes. Large lot with convenient access in heart of Tye. Easy access to interstate 20. This place is ready to go for someone new.
-
2025-10-15soldstatus
-
2024-01-26soldstatus
ⓘ Source: listings_history table (triggers on properties + properties_extension) + one-shot
backfill from property_details.listing_events for pre-trigger history.
Tax reassessment forecast TX · Resets to sale price
- Current annual tax
- $388 · $32/mo
- Projected year-2 tax
- $1,190 · $99/mo
- Expected delta
- +$802/yr (+$67/mo · 207.0%)
ⓘ Screening estimate from a state-policy table — verify with the county assessor before closing.
Climate risk First Street
- Flood 1/10 Low FEMA zone X (unshaded) · 0% chance over 30 yrs
- Wildfire 8/10 Severe
- Heat 6/10 Major 7 d/yr ≥104°F today · 21 d/yr by 30 yrs out
- Wind 4/10 Moderate 14% chance of damaging wind over 30 yrs
- Air quality 1/10 Low 0 unhealthy d/yr today · 0 by 30 yrs out
Nearby sold comps map
Loading sold comps map…
Walkable amenities ~0.75 mi
Loading nearby amenities…
Taxation est. · year 1
- Rental income
- $26,505
- − Mortgage interest
- −$3,641
- − Property taxes
- −$388
- − Insurance
- −$325
- − Repairs & maintenance
- −$2,120
- − Management
- −$2,120
- − Depreciation
- −$1,891
- Taxable income
- $16,020
- Est. tax owed @ 24.0%
- −$3,845
- After-tax cash flow
- $12,291/yr
For passive investors: Depreciation is non-cash, so a rental often shows a tax loss while cash-flowing — sheltering income. Rental losses are passive: they offset passive income freely, and up to $25,000/yr can offset ordinary (W-2) income if you actively participate and your MAGI is under $100k (phasing out to $0 by $150k); unused losses carry forward. On sale, claimed depreciation is recaptured at up to 25%, and gains may owe capital-gains tax (a 1031 exchange can defer both). Figures are a year-1 estimate at your 24.0% rate — not tax advice; consult a CPA.
Schools (NCES district)
- District
- Merkel ISD
- NCES district ID
- 4830340
- Math proficiency
- 37% ▼ -7.00%
- Reading proficiency
- 39% ▼ -2.00%
- Median HH income
- $43,594
- Composite
- 32.22/100
- National rank
- #5774
- State rank
- #460 of 826 in TX
Livability — Tye
- Score
- 66/100
- State rank
- #631
- US rank
- #12064
Category grades
Schools grade is shown separately in the Schools card above.
Census & demographics
- Census place
- Tye, TX
- Population (ZIP)
- 925
Population outlook (Taylor County) Hauer SSP2
- Today (2025)
- 145,270 people
- By 2030
- 150,050 · +3.3%
- By 2040
- 159,417 · +9.7%
- By 2050
- 168,883 · +16.3%
- By 2075
- 194,436 · +33.8%
- By 2100
- 203,163 · +39.9%
Race, ethnicity, and origin ACS 2023
- Neighborhood character
- Predominantly White (75%)
- Race & ethnicity
- White 75% Hispanic / Latino 19% Two or more races 7% Black 4%
- Hispanic origin (detail)
- Mexican 16%
- Common ancestry
- Slovak 2%
- Foreign-born
- 7% · Canada
- Languages at home
- 89% English-only · Spanish 11%
Political lean MEDSL · Taylor
- 2024 margin
- Solid R (+49.8) · D 24.6% · R 74.4% · Other 1.0%
- 2008→2024 swing
- -4.2pp toward R · 2008: -45.6pp · 2024: -49.8pp
- All cycles
- 2024: R+49.8 2020: R+45.3 2016: R+51.1 2012: R+53.6 2008: R+45.6
Not yet ingested
- Civics
- —
Market trends
- HPI YoY
- ▲ 4.22%
- Current HPI
- 186.4951
- Rent YoY
- —
- Metro
- —
- State GDP YoY
- ▲ 3.95%
- F500 in state
- 110
Industry mix (Fortune 500 HQ in TX)
| Industry | F500 HQs | Revenue |
|---|---|---|
| Energy | 16 | $1,198B |
|
||
| Technology | 5 | $198B |
|
||
| Engineering / Construction | 4 | $72B |
|
||
| Energy Services | 3 | $60B |
|
||
| Utilities | 3 | $41B |
|
||
| Healthcare | 2 | $330B |
|
||
Price history
3 events — show timeline
- 2026-04-11 Listed $65,000 NTREIS
- 2025-10-15 Sold (Public Records) — Public Records
- 2024-01-26 Sold (Public Records) — Public Records
Property tax history
+1.2%/yrLatest (2025): $388 · -8.5% YoY. Source: county tax records.
Cash-flow waterfall
monthlySold comps — $/sqft
last 12 mo · ≤1 miLoading sold comps…