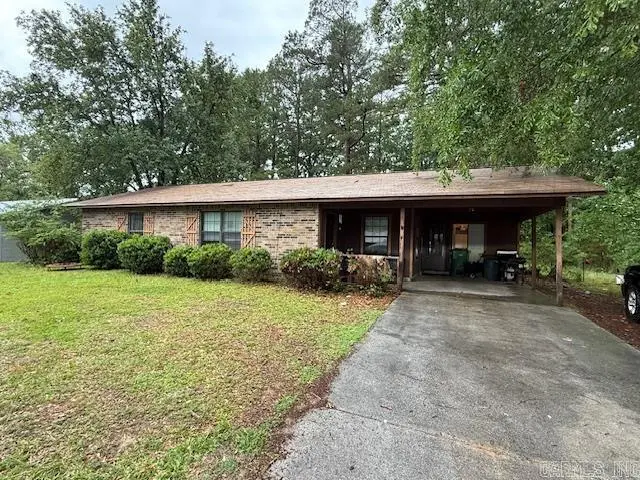
11 Whippoorwill Dr · Sheridan, AR
Flood risk 1/10 · Minimal
- FEMA flood zone
- X (unshaded)
- Chance of flooding over 30 yrs
- 0.0%
- Est. flood insurance / yr
- $507 – $1,088
Fire risk 5/10 · Moderate
- Est. fire insurance / yr
- $1,499 – $2,785
Heat risk 6/10 · Moderate
- Hot days now (above 110°F)
- 7 days/yr
- Hot days in 30 yrs
- 20 days/yr
Wind risk 4/10 · Minor
- Chance of severe wind over 30 yrs
- 17.0%
Air-quality risk 1/10 · Minimal
- Unhealthy air days now
- 0 days/yr
- Unhealthy air days in 30 yrs
- 0 days/yr
Risk factors via First Street. Map © Google.
Why this score? — see what drove the D+ grade
The composite is a weighted blend of 9 inputs, each scored 0–100. Each bar is that input's sub-score; the figure is the points it added to the 100-point composite (weight × sub-score).
- Cash flow +15.2/30.0
- ARV discount +15.0/15.0
- DSCR +4.7/10.0
- 1% rule +3.4/10.0
- Livability +3.4/5.0
- Schools +3.2/10.0
- Rent growth +2.5/5.0
- Condition / age +2.5/5.0
- Appreciation +0.0/10.0
$133,000
🖨 Deal sheet (PDF) 📄 Offer letter ✓ Due diligence
Listing remarks
This lovely home offers 2 bedrooms and 1 bathroom, perfect for comfortable living. Located in a desirable area, it’s close to parks, shops, and other essential amenities. Enjoy the peace and tranquility of a quiet neighborhood while being conveniently near everything you need. * * TENANT OCCUPIED * *
Key facts
- 0.28 acre lot
- Parking
- Community pool
Property features AI
Exterior
- Parking: Carport for 1 car
- Utilities: Public sewer; Public water; Electric service via cooperative
- Home design: Brick and frame combination exterior; Inside city limits
- Construction: Slab foundation; 3-tab shingle roof
- Exterior features: Front porch; Paved road access; Subdivision setting; Community amenities: swimming pool(s), playground, picnic area
Interior
- Kitchen: Free-standing stove / electric range; Dishwasher; Refrigerator stays
- Flooring: Laminate flooring
- Bathrooms: 1 full bathroom
- Heating & cooling: Central electric heating; Central electric cooling
- Interior features: Washer connection; Electric dryer connection; Electric water heater; Paneling on walls/ceilings
- Laundry & utility: Laundry room; Washer connection; Dryer connection (electric)
Neighborhood map
What this means for you Summary
Snapshot
- This is a 2-bed/1.0-bath single-family listed at $133k.
Deal economics
- At list price, monthly cash flow is $47 ($570/yr) — positive.
- The deal already cash-flows at list — no discount required.
- To meet the 1% rule (rent ≥ 1% of price), the offer needs to be $112k (15.7% below list).
- Recommended offer: $112k (15.7% below list) — sets the bar for 1% rule.
- Cap rate 6.7% vs local median 3.7% in Sheridan — top-decile yield for the area; either an underpriced asset or a hidden risk that comps aren't pricing in. Stress-test before assuming the spread holds.
Location & tenants
- Location reads 68/100 on livability (#85 in AR) — a middle-class / working-renter tenant base. Strengths: cost of living A+, housing A+, health & safety A; Watch: employment C-, crime D, amenities F.
- Sheridan School District (town): math 36% / reading 38% proficiency, ranked #89 of 238 in AR (top 37%) — families likely to look elsewhere, expect single-tenant / working-renter base with shorter leases.
- Zoned schools: Sheridan Elementary School (596 students, 47% FRL); Sheridan Middle School (math 40% / reading 44%, grade D-, #78 of 201 statewide, top 40%, 609 students, 42% FRL); Sheridan High School (math 26% / reading 36%, grade F, #131 of 292 statewide, top 45%, 1,271 students, 35% FRL) — zoned schools at 41% FRL track the district average.
- Market conditions: 144 active listings in the ZIP; 28 units permitted in Grant County in 2024 (0 in 5+ unit buildings).
Forward outlook
- Local home prices are declining (-3.0%/yr); year-one equity from $920 of loan paydown is wiped out by about $4k of value loss. Plan a longer hold.
- Grant County population projected to shrink 3% by 2050 — rents likely to lag national; underwrite the cash flow, not the appreciation.
Negotiation context
- It's been on market 33 days — a 3% lower offer ($129k) is reasonable based on typical stale-listing flexibility.
- 2 sale attempts with the ask held roughly flat each time — persistent listings suggest the price (not the market) is what's stuck; bring a comps-based counter.
- Current owner paid $35k; list at $133k implies a 280% gain — meaningful room to come down on a strong offer.
Risks & watch-outs
- Climate carrying-cost: moderate wildfire risk; extreme-heat days projected 7→20/yr by 2055 (HVAC capex compounding) — expect insurance premiums to compound above CPI over the hold.
Questions for the listing agent
- It's been on market 33 days. Have you received any prior offers? Is the seller open to a 16% concession, seller financing, or rate buy-down credit?
- Is there a deadline driving the sale (1031 exchange, divorce, estate, relocation)? That informs how much negotiation room exists.
- Crime grade is D in this area — have there been break-ins, vandalism, or insurance claims at this property in the last 3 years? What carrier currently insures it and at what premium?
- The area grade is low — what's the realistic commute time and amenity access for the typical tenant pool here? Any planned neighborhood developments (good or bad) we should know about?
- What's the average days-on-market for RENTAL listings here right now (not sales)? A rising rental-DOM trend means longer vacancies and softer asking-rent achievability than the comps imply.
- What's the recent tenant-quality profile in this submarket — average credit score on applications, eviction rate, late-payment / NSF rate, and stable-employment percentage? A property-management company in the area should have these aggregated.
- How much new for-sale + rental construction is in the pipeline within 1–3 miles? Heavy new supply typically softens prices + rents 12–24 months out; constrained supply supports both.
Investment metrics
- 1% rule
- 0.84% ✗
- Cap rate
- 6.72%
- Cash-on-cash
- 1.53%
- DSCR
- 1.07
- GRM
- 9.9
CMA / ARV
- ARV (on-the-fly)
- $163,620
- Comps found
- 11
Show comp detail 11 sales within ~0.75 mi
| Address | Dist | Beds/Ba | Sqft | Sold | Price | $/sf | Match |
|---|---|---|---|---|---|---|---|
| 1400 S Rose St | 0.07mi | 3/1.5 (+1) | 1,172 (-3%) | 12mo | $150,000 | $128 | 75 |
| 1316 S Rose St | 0.15mi | 2/2.0 | 1,261 (+4%) | 16mo | $161,900 | $128 | 69 |
| 915 Jones Dr | 0.28mi | 3/1.5 (+1) | 1,100 (-9%) | 3mo | $135,000 | $123 | 62 |
| 1105 S Rose | 0.33mi | 3/2.0 (+1) | 1,286 (+6%) | 6mo | $175,000 | $136 | 60 |
| 722 Jones Dr | 0.29mi | 3/2.0 (+1) | 1,359 (+12%) | 0mo | $184,000 | $135 | 57 |
| 50 Toler St | 0.33mi | 3/2.0 (+1) | 1,336 (+10%) | 6mo | $180,000 | $135 | 53 |
| 909 Reynolds Dr | 0.45mi | 3/1.5 (+1) | 1,112 (-8%) | 8mo | $148,000 | $133 | 52 |
| 706 Scott St | 0.43mi | 3/1.5 (+1) | 1,300 (+7%) | 11mo | $195,000 | $150 | 52 |
| 704 Reynolds | 0.50mi | 3/1.5 (+1) | 1,280 (+6%) | 22mo | $166,000 | $130 | 42 |
| 15 Williams Dr | 0.15mi | 3/2.0 (+1) | 1,032 (-15%) | 23mo | $156,000 | $151 | 40 |
| 40 Donna Dr | 0.50mi | 3/2.0 (+1) | 1,350 (+11%) | 20mo | $200,000 | $148 | 32 |
Match score weights: distance 35% · size 25% · config 20% · recency 20%. Top-matched comps best support the ARV.
Projected returns pro-forma
-3.0% appreciation · 3.0% rent growth · sell at horizon
- IRR
- -13.9%
- Equity multiple
- 0.50×
- Total profit
- $-18,561
- Equity at exit
- $19,831
- IRR
- -5.1%
- Equity multiple
- 0.67×
- Total profit
- $-12,402
- Equity at exit
- $11,499
Cash invested: $37,240 (down + closing). Projections, not guarantees.
Landlord ↔ Tenant lean methodology
- Overall (STATE)
- 92 Strongly Landlord-Friendly
- State Arkansas
- 92 Strongly Landlord-Friendly · R+14
- County
- — inherits STATE
- City
- — inherits STATE
ZIP-level market 72150
- Home prices YoY
- -18.1%
- Active inventory
- 144
- Price-to-rent
- 9.9×
Monthly cashflow live
- Estimated rent
- $1,121 medium interval (Pro) →
- Mortgage (P&I)
- −$697
- Tax from tax record
- −$86 /mo · $1,027/yr
- Insurance
- −$55
- HOA
- −$0
- Lot rent
- −$0
- Vacancy / Maint / Mgmt
- −$236
- Net cashflow
- $47
Break-even live
Sensitivity live
| Price | -10% $123 | -5% $85 | +0% $47 | +5% $10 | +10% $-28 |
|---|---|---|---|---|---|
| Rent | -10% $-41 | -5% $3 | +0% $47 | +5% $92 | +10% $136 |
| Rate | -1.0pp $114 | -0.5pp $81 | base $47 | +0.5pp $13 | +1.0pp $-22 |
UW: 25.0% down · 7.5% · 30yr · 1.5% tax · 5.0% vac · 8.0% maint · 8.0% mgmt
Financing live
Cash to close
- Down payment
- $33,250
- Closing costs
- $3,990
- Reserves months
- —
- Total cash needed
- —
Loan-product check · same deal, 3 products live
Conventional
25% down · 7.5% · 30yr
- Down + closing
- —
- Monthly P&I
- —
- Monthly cashflow
- —
- DSCR
- —
- Eligible?
- —
Personal DTI + credit; lowest rate.
DSCR
20% down · 8.5% · 30yr
- Down + closing
- —
- Monthly P&I
- —
- Monthly cashflow
- —
- DSCR
- —
- Eligible?
- —
No personal income docs; deal must DSCR.
Hard money
10% down · 12.0% · 12mo
- Down + closing
- —
- Monthly P&I
- —
- Monthly cashflow
- —
- DSCR
- —
- Eligible?
- —
Short-term bridge; refi at stabilization.
Listing history 20 events
-
2026-06-23days on market $133,000 Active 33 DOM
-
2026-06-21days on market $133,000 Active 32 DOM
-
2026-06-18days on market $133,000 Active 29 DOM
-
2026-06-17days on market $133,000 Active 28 DOM
-
2026-06-16days on market $133,000 Active 27 DOM
-
2026-06-15statusdays on market $133,000 Active 26 DOM
-
2026-06-14days on market $133,000 Back on Market 24 DOM
-
2026-06-10days on market $133,000 Back on Market 21 DOM
-
2026-06-09days on market $133,000 Back on Market 20 DOM
-
2026-06-09status $133,000 Back on Market 19 DOM
-
2026-06-08days on market $133,000 Take Backups 19 DOM
-
2026-06-07days on market $133,000 Take Backups 18 DOM
-
2026-06-05days on market $133,000 Take Backups 15 DOM
-
2026-06-03days on market $133,000 Take Backups 14 DOM
-
2026-06-02days on market $133,000 Take Backups 13 DOM
-
2026-06-01days on market $133,000 Take Backups 12 DOM
-
2026-05-31days on market $133,000 Take Backups 11 DOM
-
2026-05-31statusdays on market $133,000 Take Backups 10 DOM
-
2026-05-18$133,000 New Listing
-
1994-09-01soldstatus $35,000
ⓘ Source: listings_history table (triggers on properties + properties_extension) + one-shot
backfill from property_details.listing_events for pre-trigger history.
Tax reassessment forecast AR · Resets to sale price
- Current annual tax
- $1,027 · $86/mo
- Projected year-2 tax
- $1,027 · $86/mo
- Expected delta
- $0/yr ($0/mo · 0.0%)
ⓘ Screening estimate from a state-policy table — verify with the county assessor before closing.
Climate risk First Street
- Flood 1/10 Low FEMA zone X (unshaded) · 0% chance over 30 yrs
- Wildfire 5/10 Major
- Heat 6/10 Major 7 d/yr ≥110°F today · 20 d/yr by 30 yrs out
- Wind 4/10 Moderate 17% chance of damaging wind over 30 yrs
- Air quality 1/10 Low 0 unhealthy d/yr today · 0 by 30 yrs out
Nearby sold comps map
Loading sold comps map…
Walkable amenities ~0.75 mi
Loading nearby amenities…
Taxation est. · year 1
- Rental income
- $13,458
- − Mortgage interest
- −$7,450
- − Property taxes
- −$1,027
- − Insurance
- −$665
- − Repairs & maintenance
- −$1,077
- − Management
- −$1,077
- − Depreciation
- −$3,869
- Taxable loss
- −$1,707
- Est. tax savings @ 24.0%
- +$410
- After-tax cash flow
- $979/yr
For passive investors: Depreciation is non-cash, so a rental often shows a tax loss while cash-flowing — sheltering income. Rental losses are passive: they offset passive income freely, and up to $25,000/yr can offset ordinary (W-2) income if you actively participate and your MAGI is under $100k (phasing out to $0 by $150k); unused losses carry forward. On sale, claimed depreciation is recaptured at up to 25%, and gains may owe capital-gains tax (a 1031 exchange can defer both). Figures are a year-1 estimate at your 24.0% rate — not tax advice; consult a CPA.
Schools (NCES district)
- District
- Sheridan School District
- NCES district ID
- 0500015
- Math proficiency
- 36% ▼ -16.00%
- Reading proficiency
- 38% ▼ -9.00%
- Median HH income
- $49,974
- Composite
- 32.0/100
- National rank
- #5831
- State rank
- #89 of 238 in AR
Livability — Sheridan
- Score
- 68/100
- State rank
- #85
- US rank
- #9469
Category grades
Schools grade is shown separately in the Schools card above.
Census & demographics
- Census place
- Sheridan, AR
- City population
- 12,476
- Population (ZIP)
- 12,476
Population outlook (Grant County) Hauer SSP2
- Today (2025)
- 18,477 people
- By 2030
- 18,551 · +0.4%
- By 2040
- 18,442 · -0.2%
- By 2050
- 17,901 · -3.1%
- By 2075
- 16,240 · -12.1%
- By 2100
- 13,761 · -25.5%
Race, ethnicity, and origin ACS 2023
- Neighborhood character
- Predominantly White (91%)
- Race & ethnicity
- White 91% Two or more races 5% Hispanic / Latino 3% Black 2%
- Common ancestry
- Lithuanian 1% Iranian 1% Serbian 1%
- Foreign-born
- 1% · Canada, China
- Languages at home
- 99% English-only · Spanish 1%
Political lean MEDSL · Grant
- 2024 margin
- Solid R (+68.9) · D 14.8% · R 83.6% · Other 1.6%
- 2008→2024 swing
- -17.9pp toward R · 2008: -51.0pp · 2024: -68.9pp
- All cycles
- 2024: R+68.9 2020: R+67.4 2016: R+54.7 2012: R+51.9 2008: R+51.0
Not yet ingested
- Civics
- —
Market trends
- HPI YoY
- ▼ -37.06%
- Current HPI
- 167.1638
- Rent YoY
- —
- Metro
- —
- State GDP YoY
- ▲ 3.80%
- F500 in state
- 10
Industry mix (Fortune 500 HQ in AR)
| Industry | F500 HQs | Revenue |
|---|---|---|
| Retail | 1 | $681B |
|
||
| Food / Agriculture | 1 | $53B |
|
||
| Retail / Energy | 1 | $22B |
|
||
| Transportation / Logistics | 1 | $12B |
|
||
| Energy | 1 | $4B |
|
||
Price history
+280.0% since first listed4 events — show timeline
- 2026-06-08 Relisted — CARMLS
- 2026-05-29 Contingent — CARMLS
- 2026-05-18 Listed $133,000 CARMLS
- 1994-09-01 Sold (Public Records) $35,000 Public Records
Property tax history
+5.3%/yrLatest (2025): $1,027 · +9.1% YoY. Source: county tax records.
Cash-flow waterfall
monthlySold comps — $/sqft
last 12 mo · ≤1 miLoading sold comps…