164 N Chinquapin Ln · Bland, VA
Flood risk 7/10 · Major
- FEMA flood zone
- X (unshaded)
- Chance of flooding over 30 yrs
- 0.77%
- Est. flood insurance / yr
- $507 – $1,088
Fire risk 7/10 · Major
- Est. fire insurance / yr
- $666 – $1,236
Heat risk 1/10 · Minimal
- Hot days now (above 91°F)
- 5 days/yr
- Hot days in 30 yrs
- 15 days/yr
Wind risk 2/10 · Minimal
- Chance of severe wind over 30 yrs
- —
Air-quality risk 1/10 · Minimal
- Unhealthy air days now
- 0 days/yr
- Unhealthy air days in 30 yrs
- 0 days/yr
Risk factors via First Street. Map © Google.
Why this score? — see what drove the D+ grade
The composite is a weighted blend of 9 inputs, each scored 0–100. Each bar is that input's sub-score; the figure is the points it added to the 100-point composite (weight × sub-score).
- Cash flow +11.1/30.0
- Appreciation +7.7/10.0
- ARV discount +7.5/15.0
- Schools +6.0/10.0
- Livability +3.6/5.0
- 1% rule +3.2/10.0
- DSCR +3.2/10.0
- Rent growth +2.5/5.0
- Condition / age +2.5/5.0
$100,000
🖨 Deal sheet (PDF) 📄 Offer letter ✓ Due diligence
Listing remarks
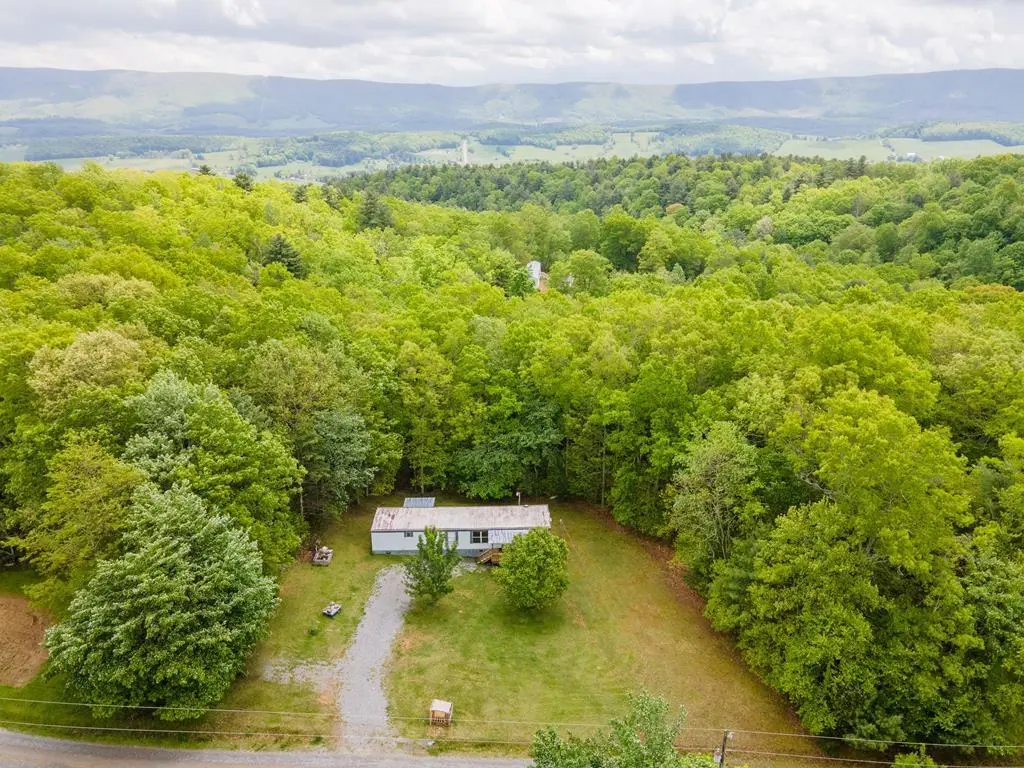
Affordable country living with room to breathe! Tucked away on a quiet dead-end street, this 2-bedroom, 1-bath home sits on 1.42 acres of both cleared and wooded land, offering the perfect blend of open space and privacy. Set on a permanent foundation and served by a private well and septic system, this property is ideal for those seeking a peaceful retreat without sacrificing convenience. Enjoy your morning coffee on the covered front porch and unwind in the evenings on the covered back porch overlooking the private backyard. The spacious lot provides plenty of room for gardening, outdoor recreation, pets, or simply enjoying the natural surroundings. Outdoor enthusiasts will appreciate the
Key facts
- Covered front porch
- Private backyard
- 1.42 acres
Tags
Property features AI
Exterior
- Utilities: Private well water; Septic tank
- Home design: Manufactured home; One story; Residential property in Paradise Haven subdivision; Zoned A1
- Construction: Aluminum siding; Metal roof
- Exterior features: Deck; Cleared and wooded lot
Interior
- Kitchen: Refrigerator
- Flooring: Carpet; Vinyl
- Bathrooms: One full bathroom
- Heating & cooling: Forced air heating; Wall/window cooling units
- Interior features: Refrigerator; Crawl space basement
Neighborhood map
What this means for you Summary
Snapshot
- This is a 2-bed/1.0-bath single-family listed at $100k.
Deal economics
- At list price, monthly cash flow is $-107 ($-1k/yr) — negative.
- To cash-flow at today's rent, offer at most $85k (15.5% below list).
- To meet the 1% rule (rent ≥ 1% of price), the offer needs to be $82k (17.6% below list).
- Recommended offer: $82k (17.6% below list) — sets the bar for 1% rule.
Location & tenants
- Location reads 72/100 on livability (#202 in VA) — a middle-class / working-renter tenant base. Strengths: cost of living A+, housing A+, health & safety A+; Watch: crime D+, employment D+, amenities F.
- Bland County Public School District (rural): math 62% / reading 80% proficiency, ranked #23 of 131 in VA (top 18%) — strong family-tenant draw, lease renewals of 3-5y typical.
- Zoned schools: Bland County Elementary (math 57% / reading 72%, grade B, #416 of 1,108 statewide, top 41%, 371 students, 67% FRL); Bland County High (math 62% / reading 87%, grade B+, #107 of 319 statewide, top 37%, 425 students, 68% FRL) — zoned schools average 67% FRL vs 32% district-wide (35 pts higher); higher-poverty schools than district average — tighter screening recommended.
- Market conditions: 21 active listings in the ZIP; 8 units permitted in Bland County in 2024 (0 in 5+ unit buildings).
Forward outlook
- In year one you build about $6k of equity ($691 loan paydown + $5k appreciation (5.3% local appreciation)).
- Bland County population projected at -20% by 2050 — secular population decline; favor cash flow + early exit over multi-decade hold.
- By year 6, paydown + projected appreciation supports a ~$32k cash-out refi (75% LTV) — recoverable capital for the next deal without selling this one.
Negotiation context
- Only 7 days on market — expect competitive offers; lowballing is unlikely to land.
Risks & watch-outs
- Watch-outs: flood insurance adds $66/mo.
- Climate carrying-cost: major flood risk; major wildfire risk — expect insurance premiums to compound above CPI over the hold.
Questions for the listing agent
- What do current leases actually rent for vs. the listed asking? Can we see a recent rent roll and the last 12 months of T-12 income?
- Built in 1979 — when were the roof, HVAC, electrical panel, plumbing, and water heater last replaced?
- What's the actual annual flood-insurance premium (NFIP or private), and is the property in a SFHA with mandatory coverage?
- Is there a deadline driving the sale (1031 exchange, divorce, estate, relocation)? That informs how much negotiation room exists.
- Schools are A-rated — typically a magnet for longer-tenancy family renters. What's the average tenant stay here, and is there a school-zone premium baked into asking?
- Crime grade is D in this area — have there been break-ins, vandalism, or insurance claims at this property in the last 3 years? What carrier currently insures it and at what premium?
- The area grade is low — what's the realistic commute time and amenity access for the typical tenant pool here? Any planned neighborhood developments (good or bad) we should know about?
- What's the average days-on-market for RENTAL listings here right now (not sales)? A rising rental-DOM trend means longer vacancies and softer asking-rent achievability than the comps imply.
- What's the recent tenant-quality profile in this submarket — average credit score on applications, eviction rate, late-payment / NSF rate, and stable-employment percentage? A property-management company in the area should have these aggregated.
- How much new for-sale + rental construction is in the pipeline within 1–3 miles? Heavy new supply typically softens prices + rents 12–24 months out; constrained supply supports both.
Investment metrics
- 1% rule
- 0.82% ✗
- Cap rate
- 5.81%
- Cash-on-cash
- -1.73%
- DSCR
- 0.92
- GRM
- 10.1
CMA / ARV
No comps found within radius.
Projected returns pro-forma
5.3% appreciation · 3.0% rent growth · sell at horizon
- IRR
- 9.9%
- Equity multiple
- 1.64×
- Total profit
- $18,043
- Equity at exit
- $58,525
- IRR
- 11.3%
- Equity multiple
- 3.13×
- Total profit
- $59,759
- Equity at exit
- $102,576
Cash invested: $28,000 (down + closing). Projections, not guarantees.
Landlord ↔ Tenant lean methodology
- Overall (STATE)
- 55 Moderately Landlord-Leaning
- State Virginia
- 55 Moderately Landlord-Leaning · D+2
- County
- — inherits STATE
- City
- — inherits STATE
ZIP-level market 24315
- Home prices YoY
- 3.3%
- Active inventory
- 21
- Price-to-rent
- 10.1×
Monthly cashflow live
- Estimated rent
- $824 medium interval (Pro) →
- Mortgage (P&I)
- −$524
- Tax est. 1.5%
- −$125 /mo · $1,500/yr
- Insurance
- −$42
- Flood insurance flood zone
- −$66 /mo · $798/yr
- HOA
- −$0
- Vacancy / Maint / Mgmt
- −$173
- Net cashflow
- $-107
Break-even live
Sensitivity live
| Price | -10% $-38 | -5% $-72 | +0% $-107 | +5% $-141 | +10% $-176 |
|---|---|---|---|---|---|
| Rent | -10% $-172 | -5% $-139 | +0% $-107 | +5% $-74 | +10% $-42 |
| Rate | -1.0pp $-56 | -0.5pp $-81 | base $-107 | +0.5pp $-133 | +1.0pp $-159 |
UW: 25.0% down · 7.5% · 30yr · 1.5% tax · 5.0% vac · 8.0% maint · 8.0% mgmt
Financing live
Cash to close
- Down payment
- $25,000
- Closing costs
- $3,000
- Reserves months
- —
- Total cash needed
- —
Loan-product check · same deal, 3 products live
Conventional
25% down · 7.5% · 30yr
- Down + closing
- —
- Monthly P&I
- —
- Monthly cashflow
- —
- DSCR
- —
- Eligible?
- —
Personal DTI + credit; lowest rate.
DSCR
20% down · 8.5% · 30yr
- Down + closing
- —
- Monthly P&I
- —
- Monthly cashflow
- —
- DSCR
- —
- Eligible?
- —
No personal income docs; deal must DSCR.
Hard money
10% down · 12.0% · 12mo
- Down + closing
- —
- Monthly P&I
- —
- Monthly cashflow
- —
- DSCR
- —
- Eligible?
- —
Short-term bridge; refi at stabilization.
Listing history 6 events
-
2026-06-09days on market $100,000 Active 7 DOM
-
2026-06-08days on market $100,000 Active 6 DOM
-
2026-06-07days on market $100,000 Active 5 DOM
-
2026-06-05days on market $100,000 Active 2 DOM
-
2026-06-03remarks 699-char remark
-
2026-06-03$100,000 Active 1 DOM
ⓘ Source: listings_history table (triggers on properties + properties_extension) + one-shot
backfill from property_details.listing_events for pre-trigger history.
Climate risk First Street
- Flood 7/10 Severe FEMA zone X (unshaded) · 77% chance over 30 yrs
- Wildfire 7/10 Severe
- Heat 1/10 Low 5 d/yr ≥91°F today · 15 d/yr by 30 yrs out
- Wind 2/10 Low
- Air quality 1/10 Low 0 unhealthy d/yr today · 0 by 30 yrs out
Nearby sold comps map
Loading sold comps map…
Walkable amenities ~0.75 mi
Loading nearby amenities…
Taxation est. · year 1
- Rental income
- $9,884
- − Mortgage interest
- −$5,602
- − Property taxes
- −$1,500
- − Insurance
- −$1,298
- − Repairs & maintenance
- −$791
- − Management
- −$791
- − Depreciation
- −$2,909
- Taxable loss
- −$3,006
- Est. tax savings @ 24.0%
- +$721
- After-tax cash flow
- $-561/yr
For passive investors: Depreciation is non-cash, so a rental often shows a tax loss while cash-flowing — sheltering income. Rental losses are passive: they offset passive income freely, and up to $25,000/yr can offset ordinary (W-2) income if you actively participate and your MAGI is under $100k (phasing out to $0 by $150k); unused losses carry forward. On sale, claimed depreciation is recaptured at up to 25%, and gains may owe capital-gains tax (a 1031 exchange can defer both). Figures are a year-1 estimate at your 24.0% rate — not tax advice; consult a CPA.
Schools (NCES district)
- District
- Bland County Public School District
- NCES district ID
- 5100390
- Math proficiency
- 62% ▼ -25.00%
- Reading proficiency
- 80% ▬ 0.00%
- Median HH income
- $44,048
- Composite
- 59.56/100
- National rank
- #917
- State rank
- #23 of 131 in VA
Livability — Bland
- Score
- 72/100
- State rank
- #202
- US rank
- #6245
Category grades
Schools grade is shown separately in the Schools card above.
Census & demographics
- Population (ZIP)
- 3,789
Population outlook (Bland County) Hauer SSP2
- Today (2025)
- 6,172 people
- By 2030
- 5,928 · -4.0%
- By 2040
- 5,402 · -12.5%
- By 2050
- 4,926 · -20.2%
- By 2075
- 4,051 · -34.4%
- By 2100
- 3,028 · -50.9%
Race, ethnicity, and origin ACS 2023
- Neighborhood character
- Predominantly White (91%)
- Race & ethnicity
- White 91% Black 6% Two or more races 2% Hispanic / Latino 1%
- Common ancestry
- Serbian 2% Slovak 1% Lithuanian 1%
- Foreign-born
- 0%
- Languages at home
- 97% English-only · Spanish 2%
Political lean MEDSL · Bland
- 2024 margin
- Solid R (+69.7) · D 14.8% · R 84.5%
- 2008→2024 swing
- -30.3pp toward R · 2008: -39.4pp · 2024: -69.7pp
- All cycles
- 2024: R+69.7 2020: R+68.2 2016: R+67.8 2012: R+48.0 2008: R+39.4
Not yet ingested
- Civics
- —
Market trends
- HPI YoY
- ▲ 5.30%
- Current HPI
- 166.2616
- Rent YoY
- —
- Metro
- —
- State GDP YoY
- ▲ 2.40%
- F500 in state
- 50
Industry mix (Fortune 500 HQ in VA)
| Industry | F500 HQs | Revenue |
|---|---|---|
| Aerospace / Defense | 4 | $236B |
|
||
| Technology / Defense | 3 | $32B |
|
||
| Financial Services | 2 | $176B |
|
||
| Utilities | 2 | $27B |
|
||
| Insurance | 2 | $25B |
|
||
| Technology | 2 | $15B |
|
||
Price history
1 event — show timeline
- 2026-06-02 Listed $100,000 SWVAR
Property tax history
-2.2%/yrLatest (2025): $101 · +0.0% YoY. Source: county tax records.
Cash-flow waterfall
monthlySold comps — $/sqft
last 12 mo · ≤1 miLoading sold comps…