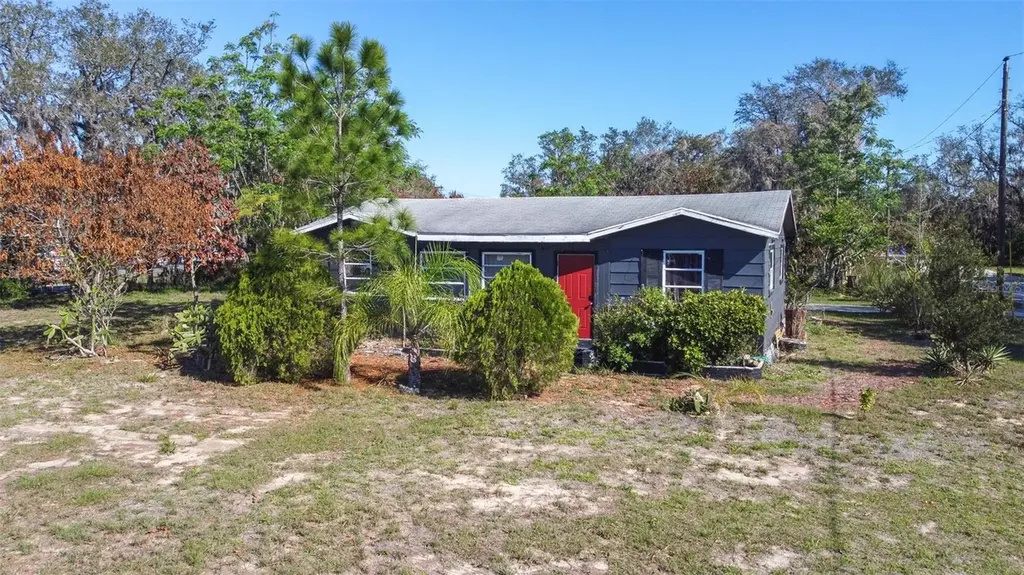
3726 Kenilworth Blvd · Sebring, FL
Flood risk 1/10 · Minimal
- FEMA flood zone
- X (unshaded)
- Chance of flooding over 30 yrs
- 0.0%
- Est. flood insurance / yr
- $507 – $1,088
Fire risk 4/10 · Minor
- Est. fire insurance / yr
- $947 – $1,759
Heat risk 9/10 · Severe
- Hot days now (above 108°F)
- 7 days/yr
- Hot days in 30 yrs
- 24 days/yr
Wind risk 9/10 · Severe
- Chance of severe wind over 30 yrs
- 99.0%
Air-quality risk 2/10 · Minimal
- Unhealthy air days now
- 1 days/yr
- Unhealthy air days in 30 yrs
- 1 days/yr
Risk factors via First Street. Map © Google.
Why this score? — see what drove the C- grade
The composite is a weighted blend of 9 inputs, each scored 0–100. Each bar is that input's sub-score; the figure is the points it added to the 100-point composite (weight × sub-score).
- Cash flow +25.8/30.0
- DSCR +8.6/10.0
- 1% rule +5.9/10.0
- Schools +3.6/10.0
- Livability +3.3/5.0
- Condition / age +2.5/5.0
- Rent growth +2.4/5.0
- ARV discount +0.0/15.0
- Appreciation +0.0/10.0
$140,000
🖨 Deal sheet (PDF) 📄 Offer letter ✓ Due diligence
Listing remarks
PRIME C1 COMMERCIAL OPPORTUNITY ON KENILWORTH BLVD! Stop paying rent and put your business on the map with this high-visibility property located directly on one of Sebring’s key corridors. Boasting 70 feet of road frontage and located just minutes from the Sebring Parkway, this versatile site is perfect for a professional office, boutique retail, or specialized service hub. The interior features a clean, professional canvas with vinyl flooring and modern fixtures already in place. The house is custom fitted with a smartlight system. The bones and location bring unbeatable equity potential within the Sebring City Limits. This is the ultimate "live-work" setup or strategic inv
Key facts
- New lvp flooring
- Modern fixtures
- Zoned c1 commercial
Tags
Property features AI
Finance
- Other:
- Financial info:
- HOA & community: No HOA/association
Exterior
- Parking:
- Security:
- Utilities: Public water; Public sewer; Electricity connected; Water connected; Sewer connected
- Home design: Single-family residence; One story; Faces south
- Construction: Vinyl siding; Shingle roof; Block foundation; Built on a 0.21 acre lot
- Exterior features: Enclosed rear porch/patio
Interior
- Kitchen: Microwave; Range; Refrigerator
- Bedrooms: 3 bedrooms
- Flooring: Vinyl flooring; Wood flooring
- Bathrooms: 1 full bathroom
- Heating & cooling: Central heating (electric); Central air conditioning
- Interior features: Living room and dining room combo; Thermostat; Decorative fireplace; 7 total rooms
- Laundry & utility: Washer hookup; Electric dryer hookup; Other laundry feature
Neighborhood map
What this means for you Summary
Snapshot
- This is a 3-bed/1.0-bath single-family listed at $140k.
Deal economics
- At list price, monthly cash flow is $338 ($4k/yr) — positive.
- The deal already cash-flows at list — no discount required.
- Meets the 1% rule at list price ($2k rent vs $140k).
- Recommended offer: $132k (6.0% below list) — sets the bar for market timing.
- Cap rate 9.2% vs local median 4.3% in Sebring — top-decile yield for the area; either an underpriced asset or a hidden risk that comps aren't pricing in. Stress-test before assuming the spread holds.
Location & tenants
- Location reads 66/100 on livability (#618 in FL) — a middle-class / working-renter tenant base. Strengths: cost of living A+, housing A+, health & safety A; Watch: amenities F, commute F, employment F.
- Highlands (other): math 45% / reading 43% proficiency, ranked #54 of 73 in FL (top 74%) — families likely to look elsewhere, expect single-tenant / working-renter base with shorter leases; 68% free/reduced lunch — lower-income household profile, screen leases tightly.
- Zoned schools: Fred Wild Elementary School (math 49% / reading 41%, grade D-, #1,271 of 2,144 statewide, top 60%, 563 students, 87% FRL); Sebring Middle School (math 52% / reading 40%, grade D+, #300 of 571 statewide, top 53%, 815 students, 64% FRL); Sebring High School (math 32% / reading 48%, grade F, #296 of 667 statewide, top 45%, 1,809 students, 56% FRL) — zoned schools at 69% FRL track the district average.
- Market conditions: Rents soft (-0.3%/yr); 481 active listings in the ZIP; 1 comparable units currently listed for rent nearby; 980 units permitted in Highlands County in 2024 (80 in 5+ unit buildings).
- This rent runs 37% of the median local income ($50k/yr) — at the standard rent-burdened threshold; future hikes will face affordability resistance.
Forward outlook
- Local home prices are declining (-3.0%/yr); year-one equity from $968 of loan paydown is wiped out by about $4k of value loss. Plan a longer hold.
Negotiation context
- It's been on market 71 days — a 6% lower offer ($132k) is reasonable based on typical stale-listing flexibility.
- Current owner paid $50k; list at $140k implies a 180% gain — meaningful room to come down on a strong offer.
Risks & watch-outs
- Climate carrying-cost: severe wind risk, 99% chance of damaging wind over 30y; extreme-heat days projected 7→24/yr by 2055 (HVAC capex compounding) — expect insurance premiums to compound above CPI over the hold.
Questions for the listing agent
- It's been on market 71 days. Have you received any prior offers? Is the seller open to a 6% concession, seller financing, or rate buy-down credit?
- Built in 1961 — when were the roof, HVAC, electrical panel, plumbing, and water heater last replaced?
- Why hasn't it sold? Are there any deal-killer items the seller is aware of (foundation, flood, title, zoning, code violations)?
- Is there a deadline driving the sale (1031 exchange, divorce, estate, relocation)? That informs how much negotiation room exists.
- Schools are D-rated, which usually means shorter tenancies and higher turnover. Who's the typical renter profile here, and what's been the actual vacancy rate?
- What's the average days-on-market for RENTAL listings here right now (not sales)? A rising rental-DOM trend means longer vacancies and softer asking-rent achievability than the comps imply.
- What's the recent tenant-quality profile in this submarket — average credit score on applications, eviction rate, late-payment / NSF rate, and stable-employment percentage? A property-management company in the area should have these aggregated.
- How much new for-sale + rental construction is in the pipeline within 1–3 miles? Heavy new supply typically softens prices + rents 12–24 months out; constrained supply supports both.
Investment metrics
- 1% rule
- 1.09% ✓
- Cap rate
- 9.19%
- Cash-on-cash
- 10.35%
- DSCR
- 1.46
- GRM
- 7.6
CMA / ARV
- ARV (on-the-fly)
- $119,600
- Comps found
- 12
Show comp detail 12 sales within ~0.75 mi
| Address | Dist | Beds/Ba | Sqft | Sold | Price | $/sf | Match |
|---|---|---|---|---|---|---|---|
| 616 Denise Ave | 0.35mi | 3/1.0 | 1,050 (+1%) | 8mo | $106,250 | $101 | 75 |
| 612 Denise Ave | 0.34mi | 3/1.0 | 1,050 (+1%) | 8mo | $106,250 | $101 | 75 |
| 618 Denise Ave | 0.35mi | 3/1.0 | 1,050 (+1%) | 10mo | $120,000 | $114 | 74 |
| 604 Denise Ave | 0.34mi | 3/1.0 | 1,050 (+1%) | 10mo | $107,000 | $102 | 74 |
| 4816 4th St | 0.70mi | 3/2.0 | 1,017 (-2%) | 4mo | $68,000 | $67 | 56 |
| 3112 Spinks Rd | 0.50mi | 2/2.0 (-1) | 1,089 (+5%) | 5mo | $185,000 | $170 | 56 |
| 4603 Howard St | 0.72mi | 3/2.0 | 1,056 (+2%) | 12mo | $205,000 | $194 | 50 |
| 1801 Colmar Ave | 0.37mi | 2/2.0 (-1) | 934 (-10%) | 9mo | $140,000 | $150 | 49 |
| 1816 Steiner Ave | 0.57mi | 2/1.5 (-1) | 1,134 (+9%) | 10mo | $130,000 | $115 | 43 |
| 1512 Sunkist Ave | 0.54mi | 2/1.5 (-1) | 930 (-11%) | 9mo | $185,000 | $199 | 43 |
| 4810 5th St | 0.71mi | 2/1.0 (-1) | 934 (-10%) | 3mo | $93,000 | $100 | 42 |
| 3135 Villa Rd | 0.45mi | 2/2.0 (-1) | 899 (-14%) | 12mo | $153,750 | $171 | 37 |
Match score weights: distance 35% · size 25% · config 20% · recency 20%. Top-matched comps best support the ARV.
Projected returns pro-forma
-3.0% appreciation · 0.0% rent growth · sell at horizon
- IRR
- -4.0%
- Equity multiple
- 0.86×
- Total profit
- $-5,664
- Equity at exit
- $20,874
- IRR
- 2.2%
- Equity multiple
- 1.14×
- Total profit
- $5,330
- Equity at exit
- $12,105
Cash invested: $39,200 (down + closing). Projections, not guarantees.
Landlord ↔ Tenant lean methodology
- Overall (STATE)
- 87 Strongly Landlord-Friendly
- State Florida
- 87 Strongly Landlord-Friendly · R+3
- County
- — inherits STATE
- City
- — inherits STATE
ZIP-level market 33870
- Home prices YoY
- -20.0%
- Rents YoY
- -0.3%
- Active inventory
- 481
- Price-to-rent
- 7.6×
Monthly cashflow live
- Estimated rent
- $1,530 medium interval (Pro) →
- Mortgage (P&I)
- −$734
- Tax from tax record
- −$78 /mo · $935/yr
- Insurance
- −$58
- HOA
- −$0
- Vacancy / Maint / Mgmt
- −$321
- Net cashflow
- $338
Break-even live
Sensitivity live
| Price | -10% $417 | -5% $378 | +0% $338 | +5% $299 | +10% $259 |
|---|---|---|---|---|---|
| Rent | -10% $217 | -5% $278 | +0% $338 | +5% $399 | +10% $459 |
| Rate | -1.0pp $409 | -0.5pp $374 | base $338 | +0.5pp $302 | +1.0pp $265 |
UW: 25.0% down · 7.5% · 30yr · 1.5% tax · 5.0% vac · 8.0% maint · 8.0% mgmt
Financing live
Cash to close
- Down payment
- $35,000
- Closing costs
- $4,200
- Reserves months
- —
- Total cash needed
- —
Loan-product check · same deal, 3 products live
Conventional
25% down · 7.5% · 30yr
- Down + closing
- —
- Monthly P&I
- —
- Monthly cashflow
- —
- DSCR
- —
- Eligible?
- —
Personal DTI + credit; lowest rate.
DSCR
20% down · 8.5% · 30yr
- Down + closing
- —
- Monthly P&I
- —
- Monthly cashflow
- —
- DSCR
- —
- Eligible?
- —
No personal income docs; deal must DSCR.
Hard money
10% down · 12.0% · 12mo
- Down + closing
- —
- Monthly P&I
- —
- Monthly cashflow
- —
- DSCR
- —
- Eligible?
- —
Short-term bridge; refi at stabilization.
Rent comps 1 comps
| Address | Beds | Baths | Sqft | Rent | $/sqft | DOM | Units | Dist |
|---|---|---|---|---|---|---|---|---|
| 8761 Watersound Cir Sebring, FL | 2.0–3.0 | 2.0 | 1090 | $1,600 | $1.47 | 22d | 1 | 0.53mi |
Listing history 18 events
-
2026-06-21days on market $140,000 Active 71 DOM
-
2026-06-19days on market $140,000 Active 69 DOM
-
2026-06-18days on market $140,000 Active 68 DOM
-
2026-06-17days on market $140,000 Active 67 DOM
-
2026-06-16days on market $140,000 Active 66 DOM
-
2026-06-15days on market $140,000 Active 65 DOM
-
2026-06-14days on market $140,000 Active 63 DOM
-
2026-06-10days on market $140,000 Active 60 DOM
-
2026-06-09days on market $140,000 Active 59 DOM
-
2026-06-08days on market $140,000 Active 58 DOM
-
2026-06-07days on market $140,000 Active 57 DOM
-
2026-06-02days on market $140,000 Active 52 DOM
-
2026-06-01days on market $140,000 Active 51 DOM
-
2026-05-31days on market $140,000 Active 50 DOM
-
2026-05-30days on market $140,000 Active 49 DOM
-
2026-04-12$140,000 Active
-
2008-06-23soldstatus $50,000
-
2004-10-01soldstatus $49,000
ⓘ Source: listings_history table (triggers on properties + properties_extension) + one-shot
backfill from property_details.listing_events for pre-trigger history.
Tax reassessment forecast FL · Resets to sale price
- Current annual tax
- $935 · $78/mo
- Projected year-2 tax
- $1,162 · $97/mo
- Expected delta
- +$227/yr (+$19/mo · 24.2%)
ⓘ Screening estimate from a state-policy table — verify with the county assessor before closing.
Climate risk First Street
- Flood 1/10 Low FEMA zone X (unshaded) · 0% chance over 30 yrs
- Wildfire 4/10 Moderate
- Heat 9/10 Extreme 7 d/yr ≥108°F today · 24 d/yr by 30 yrs out
- Wind 9/10 Extreme 99% chance of damaging wind over 30 yrs
- Air quality 2/10 Low 1 unhealthy d/yr today · 1 by 30 yrs out
Nearby sold comps map
Loading sold comps map…
Walkable amenities ~0.75 mi
Loading nearby amenities…
Taxation est. · year 1
- Rental income
- $18,360
- − Mortgage interest
- −$7,842
- − Property taxes
- −$935
- − Insurance
- −$700
- − Repairs & maintenance
- −$1,469
- − Management
- −$1,469
- − Depreciation
- −$4,073
- Taxable income
- $1,872
- Est. tax owed @ 24.0%
- −$449
- After-tax cash flow
- $3,609/yr
For passive investors: Depreciation is non-cash, so a rental often shows a tax loss while cash-flowing — sheltering income. Rental losses are passive: they offset passive income freely, and up to $25,000/yr can offset ordinary (W-2) income if you actively participate and your MAGI is under $100k (phasing out to $0 by $150k); unused losses carry forward. On sale, claimed depreciation is recaptured at up to 25%, and gains may owe capital-gains tax (a 1031 exchange can defer both). Figures are a year-1 estimate at your 24.0% rate — not tax advice; consult a CPA.
Schools (NCES district)
- District
- Highlands
- NCES district ID
- 1200840
- Math proficiency
- 45% ▼ -7.00%
- Reading proficiency
- 43% ▼ -3.00%
- Median HH income
- $35,276
- Composite
- 36.42/100
- National rank
- #4672
- State rank
- #54 of 73 in FL
Livability — Sebring
- Score
- 66/100
- State rank
- #618
- US rank
- #11992
Category grades
Schools grade is shown separately in the Schools card above.
Census & demographics
- Census place
- Sebring, FL
- County
- Highlands County · 98,898 people
- City population
- 50,797
- Metro
- Sebring-Avon Park, FL
- Population (ZIP)
- 25,195
- Household income
- $49,942
- Rent vs Own
- Severe rent burden
- 994.0
Population outlook (Highlands County) Hauer SSP2
- Today (2025)
- 99,674 people
- By 2030
- 99,615 · -0.1%
- By 2040
- 99,342 · -0.3%
- By 2050
- 98,242 · -1.4%
- By 2075
- 93,291 · -6.4%
- By 2100
- 79,894 · -19.8%
Race, ethnicity, and origin ACS 2023
- Neighborhood character
- Diverse neighborhood (Simpson 0.57)
- Race & ethnicity
- White 60% Hispanic / Latino 22% Black 13% Two or more races 10% Asian 1%
- Hispanic origin (detail)
- Mexican 8% Puerto Rican 7% Cuban 5%
- Common ancestry
- Slovak 2% Romanian 1% Lithuanian 1%
- Foreign-born
- 10% · Canada, Jamaica, China
- Languages at home
- 80% English-only · Spanish 16% Other Indo-European 1% French/Haitian/Cajun 1%
Political lean MEDSL · Highlands
- 2024 margin
- Solid R (+40.8) · D 29.3% · R 70.1%
- 2008→2024 swing
- -22.7pp toward R · 2008: -18.1pp · 2024: -40.8pp
- All cycles
- 2024: R+40.8 2020: R+34.4 2016: R+32.0 2012: R+23.0 2008: R+18.1
Not yet ingested
- Civics
- —
Market trends
- HPI YoY
- ▼ -68.68%
- Current HPI
- 273.9861
- Rent YoY
- ▼ -0.29%
- Metro
- Sebring-Avon Park, FL
- State GDP YoY
- ▲ 3.28%
- F500 in state
- 36
Industry mix (Fortune 500 HQ in FL)
| Industry | F500 HQs | Revenue |
|---|---|---|
| Industrial Technology | 2 | $29B |
|
||
| Insurance | 2 | $17B |
|
||
| Retail | 1 | $60B |
|
||
| Technology Distribution | 1 | $58B |
|
||
| Homebuilding | 1 | $35B |
|
||
| Technology Manufacturing | 1 | $35B |
|
||
Price history
+185.7% since first listed3 events — show timeline
- 2026-04-12 Listed $140,000 Stellar MLS as Distributed by MLS Grid
- 2008-06-23 Sold (Public Records) $50,000 Public Records
- 2004-10-01 Sold (Public Records) $49,000 Public Records
Property tax history
+0.0%/yrLatest (2025): $935 · +5.5% YoY. Source: county tax records.
Cash-flow waterfall
monthlySold comps — $/sqft
last 12 mo · ≤1 miLoading sold comps…