11511 113th St Unit 35E · Seminole, FL
Flood risk 1/10 · Minimal
- FEMA flood zone
- X (unshaded)
- Chance of flooding over 30 yrs
- 0.0%
- Est. flood insurance / yr
- $507 – $1,088
Fire risk 2/10 · Minimal
- Est. fire insurance / yr
- $947 – $1,759
Heat risk 10/10 · Severe
- Hot days now (above 107°F)
- 7 days/yr
- Hot days in 30 yrs
- 25 days/yr
Wind risk 10/10 · Severe
- Chance of severe wind over 30 yrs
- 99.0%
Air-quality risk 3/10 · Minor
- Unhealthy air days now
- 2 days/yr
- Unhealthy air days in 30 yrs
- 3 days/yr
Risk factors via First Street. Map © Google.
Why this score? — see what drove the D grade
The composite is a weighted blend of 9 inputs, each scored 0–100. Each bar is that input's sub-score; the figure is the points it added to the 100-point composite (weight × sub-score).
- Cash flow +10.7/30.0
- 1% rule +7.7/10.0
- ARV discount +7.5/15.0
- Livability +4.4/5.0
- Schools +4.3/10.0
- DSCR +3.1/10.0
- Rent growth +2.8/5.0
- Condition / age +2.5/5.0
- Appreciation +0.0/10.0
$159,000
🖨 Deal sheet (PDF) 📄 Offer letter ✓ Due diligence
Listing remarks
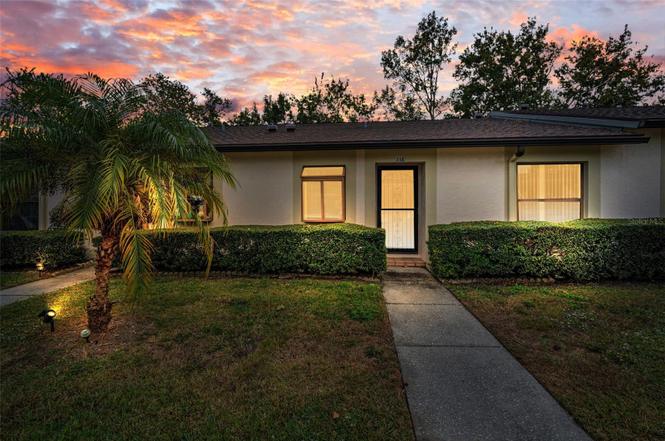
Under contract-accepting backup offers. PRICE REDUCED! SELLER IS MOTIVATED! Welcome Home to Your Low maintenance Condo in Deerwood Gardens! Step into this charming, one level, ground floor, all ages, pet friendly condo located in the highly desirable Deerwood Gardens community in Seminole—a true gem that promises comfort, convenience, and a touch of luxury. This unit offers 2 spacious bedrooms, 2 bathrooms, and a generous 930 sq ft of well-designed living space. As you enter, you’ll be greeted by an open and airy atmosphere, accentuated by soaring cathedral ceilings that enhance the sense of space. To your left, the kitchen beckons with ample cabinet space and a convenient break
Key facts
- Ground floor
- Cathedral ceilings
- Backyard space
Tags
Property features AI
Finance
- Financial info: Total annual association fees $6,495; Lease restrictions apply
- HOA & community: HOA managed by West Coast Management; Monthly HOA fee of $541.25 (includes cable TV, internet, pool, clubhouse, maintenance structure and grounds, pest control, sewer, trash, water, common area taxes, escrow reserves fund); Association approval required; Pets allowed (max 25 lbs); Community clubhouse and pool
Exterior
- Parking: Covered parking; Assigned carport (1 space); Guest parking available
- Utilities: Public water; Public sewer; Electricity connected; Cable connected; High-speed internet available; Sewer connected; Water connected
- Home design: Condominium; Residential property; Single-story; Entry on one level; Faces north
- Construction: Stucco construction; Shingle roof; Slab foundation; Built as part of Building 35
- Exterior features: Sliding doors; Storage
Interior
- Kitchen: Dishwasher; Disposal; Microwave; Range hood; Electric water heater
- Bedrooms: 2 bedrooms
- Flooring: Carpet; Ceramic tile; Laminate
- Bathrooms: 2 full bathrooms
- Heating & cooling: Heat pump heating; Central air conditioning
- Interior features: Cathedral ceilings; High ceilings; Open floorplan with living/dining combo; Solid surface counters; Thermostat; Walk-in closet(s); Blinds
- Laundry & utility: Washer; Dryer; Inside laundry in a laundry closet
Neighborhood map
What this means for you Summary
Snapshot
- This is a 2-bed/2.0-bath condo listed at $159k.
Deal economics
- At list price, monthly cash flow is $-74 ($-890/yr) — negative.
- To cash-flow at today's rent, offer at most $146k (8.2% below list).
- Meets the 1% rule at list price ($2k rent vs $159k).
- Recommended offer: $140k (12.0% below list) — sets the bar for market timing.
- Cap rate 5.7% vs local median 3.6% in Seminole — top-decile yield for the area; either an underpriced asset or a hidden risk that comps aren't pricing in. Stress-test before assuming the spread holds.
Location & tenants
- Location reads 88/100 on livability (#5 in FL, #174 nationally) — a professional / high-income tenant draw. Strengths: commute A+, housing A+, health & safety A+.
- Pinellas (suburban): math 51% / reading 51% proficiency, ranked #31 of 73 in FL (top 42%) — acceptable for families but not a draw, mixed tenant base, ~2y average lease.
- Zoned schools: Fuguitt Elementary School (math 48% / reading 50%, grade D, #1,134 of 2,144 statewide, top 54%, 479 students, 68% FRL); Osceola Middle School (math 48% / reading 45%, grade D+, #297 of 571 statewide, top 52%, 1,009 students, 52% FRL); Seminole High School (math 26% / reading 47%, grade F, #351 of 667 statewide, top 54%, 1,546 students, 39% FRL).
- Market conditions: Rents rising (+1.4%/yr); 140 active listings in the ZIP; 25 comparable units currently listed for rent nearby; rentals leasing fast (median 10d on market — plan ~1-2 weeks tenant-placement turnaround); 2,676 units permitted in Pinellas County in 2024 (1,422 in 5+ unit buildings).
- This rent runs 37% of the median local income ($65k/yr) — at the standard rent-burdened threshold; future hikes will face affordability resistance.
Forward outlook
- Local home prices are declining (-3.0%/yr); year-one equity from $1k of loan paydown is wiped out by about $5k of value loss. Plan a longer hold.
- Pinellas County population projected at +14% by 2050 — modest demand growth; plan on rents tracking national, not racing it.
Negotiation context
- It's been on market 150 days — a 12% lower offer ($140k) is reasonable based on typical stale-listing flexibility.
- 2 sale attempts; this cycle's ask has dropped $51k (24%) from the opening price — seller is motivated, your offer sets the floor, not the list.
- Current owner paid $54k; list at $159k implies a 195% gain — meaningful room to come down on a strong offer.
Risks & watch-outs
- Watch-outs: HOA is 27% of rent.
- Climate carrying-cost: severe wind risk, 99% chance of damaging wind over 30y; extreme-heat days projected 7→25/yr by 2055 (HVAC capex compounding) — expect insurance premiums to compound above CPI over the hold.
Questions for the listing agent
- What do current leases actually rent for vs. the listed asking? Can we see a recent rent roll and the last 12 months of T-12 income?
- It's been on market 150 days. Have you received any prior offers? Is the seller open to a 12% concession, seller financing, or rate buy-down credit?
- What does the HOA fee cover, when was the last increase, and are there any pending special assessments or reserve-fund shortfalls?
- Any open or pending special assessments — roof, HVAC, plumbing, elevator, façade? What's the per-unit balance and payoff schedule, and is the seller paying it off at close or rolling it to the buyer?
- Why hasn't it sold? Are there any deal-killer items the seller is aware of (foundation, flood, title, zoning, code violations)?
- Is there a deadline driving the sale (1031 exchange, divorce, estate, relocation)? That informs how much negotiation room exists.
- Schools are B-rated — typically a magnet for longer-tenancy family renters. What's the average tenant stay here, and is there a school-zone premium baked into asking?
- The area grade is low — what's the realistic commute time and amenity access for the typical tenant pool here? Any planned neighborhood developments (good or bad) we should know about?
- What's the average days-on-market for RENTAL listings here right now (not sales)? A rising rental-DOM trend means longer vacancies and softer asking-rent achievability than the comps imply.
- What's the recent tenant-quality profile in this submarket — average credit score on applications, eviction rate, late-payment / NSF rate, and stable-employment percentage? A property-management company in the area should have these aggregated.
- How much new apartment / multifamily construction is in the pipeline within 1–3 miles? Heavy new supply (>2% of stock underway) typically softens rents 12–24 months out; light construction supports rent growth.
Investment metrics
- 1% rule
- 1.27% ✓
- Cap rate
- 5.73%
- Cash-on-cash
- -2.00%
- DSCR
- 0.91
- GRM
- 6.6
CMA / ARV
No comps found within radius.
Projected returns pro-forma
-3.0% appreciation · 1.38% rent growth · sell at horizon
- IRR
- -22.2%
- Equity multiple
- 0.25×
- Total profit
- $-33,352
- Equity at exit
- $23,707
- IRR
- -23.1%
- Equity multiple
- -0.04×
- Total profit
- $-46,458
- Equity at exit
- $13,747
Cash invested: $44,520 (down + closing). Projections, not guarantees.
Landlord ↔ Tenant lean methodology
- Overall (STATE)
- 87 Strongly Landlord-Friendly
- State Florida
- 87 Strongly Landlord-Friendly · R+3
- County
- — inherits STATE
- City
- — inherits STATE
ZIP-level market 33778
- Rents YoY
- 1.4%
- Active inventory
- 140
- Price-to-rent
- 6.6×
Monthly cashflow live
- Estimated rent
- $2,022 high interval (Pro) →
- Mortgage (P&I)
- −$834
- Tax from tax record
- −$231 /mo · $2,766/yr
- Insurance
- −$66
- HOA
- −$541
- Vacancy / Maint / Mgmt
- −$425
- Net cashflow
- $-74
Break-even live
Sensitivity live
| Price | -10% $16 | -5% $-29 | +0% $-74 | +5% $-119 | +10% $-164 |
|---|---|---|---|---|---|
| Rent | -10% $-234 | -5% $-154 | +0% $-74 | +5% $6 | +10% $86 |
| Rate | -1.0pp $6 | -0.5pp $-34 | base $-74 | +0.5pp $-115 | +1.0pp $-157 |
UW: 25.0% down · 7.5% · 30yr · 1.5% tax · 5.0% vac · 8.0% maint · 8.0% mgmt
Financing live
Cash to close
- Down payment
- $39,750
- Closing costs
- $4,770
- Reserves months
- —
- Total cash needed
- —
Loan-product check · same deal, 3 products live
Conventional
25% down · 7.5% · 30yr
- Down + closing
- —
- Monthly P&I
- —
- Monthly cashflow
- —
- DSCR
- —
- Eligible?
- —
Personal DTI + credit; lowest rate.
DSCR
20% down · 8.5% · 30yr
- Down + closing
- —
- Monthly P&I
- —
- Monthly cashflow
- —
- DSCR
- —
- Eligible?
- —
No personal income docs; deal must DSCR.
Hard money
10% down · 12.0% · 12mo
- Down + closing
- —
- Monthly P&I
- —
- Monthly cashflow
- —
- DSCR
- —
- Eligible?
- —
Short-term bridge; refi at stabilization.
Rent comps 25 comps
| Address | Beds | Baths | Sqft | Rent | $/sqft | DOM | Units | Dist |
|---|---|---|---|---|---|---|---|---|
| 11290 109th Ln Largo, FL | 2.0 | 1.0 | 988 | $1,995 | $2.02 | 26d | 1 | 0.32mi |
| 12100 Seminole Blvd Largo, FL | 2.0 | 2.0 | 1050 | $1,750 | $1.67 | 26d | 1 | 0.43mi |
| 11201 122nd Ave Largo, FL | 1.0–2.0 | 1.0–2.0 | 867 | $2,150 | $2.48 | 0d | 2 | 0.52mi |
| 10568 117th Dr Largo, FL | 3.0 | 2.0 | 1118 | $2,400 | $2.15 | 0d | 1 | 0.60mi |
| 10580 112th Ave Largo, FL | 3.0 | 1.0 | 925 | $1,995 | $2.16 | 6d | 1 | 0.62mi |
| 10932 104th Ave Largo, FL | 2.0 | 1.0 | 962 | $1,950 | $2.03 | 26d | 1 | 0.74mi |
| 10932 104th Ave Largo, FL | 2.0 | 1.0 | 962 | $1,950 | $2.03 | 22d | 1 | 0.74mi |
| 11666 126th Ter Largo, FL | 3.0 | 1.0 | 1056 | $2,183 | $2.07 | 26d | 1 | 0.81mi |
| 10546 106th Ave N Unit a Largo, FL | 1.0 | 1.0 | 624 | $1,223 | $1.96 | 26d | 1 | 0.83mi |
| 10155 Sailwinds Blvd S #204 Largo, FL | 2.0 | 2.0 | 1018 | $1,695 | $1.67 | 0d | 1 | 1.01mi |
| 10160 Sailwinds Blvd S Largo, FL | 2.0 | 2.0 | 901 | $1,950 | $2.16 | 26d | 2 | 1.01mi |
| 12651 Seminole Blvd #44 Largo, FL | 2.0 | 1.5 | 1000 | $1,450 | $1.45 | 26d | 1 | 1.03mi |
| 10165 106th Ter Unit 1 Largo, FL | 1.0 | 1.0 | 624 | $1,325 | $2.12 | 26d | 1 | 1.06mi |
| 13001 120th St Largo, FL | 3.0 | 1.0 | 1044 | $1,950 | $1.87 | 9d | 1 | 1.14mi |
| 11013 Temple Ave Seminole, FL | 3.0 | 1.0 | 951 | $2,050 | $2.16 | 6d | 1 | 1.14mi |
| 13333 Ridge Rd Largo, FL | 1.0–2.0 | 1.0–1.5 | 860 | $1,765 | $2.05 | 9d | 1 | 1.17mi |
| 13250 Ridge Rd Largo, FL | 2.0–3.0 | 2.0 | 1167 | $1,975 | $1.69 | 0d | 2 | 1.21mi |
| 11960 133rd Ave Largo, FL | 3.0 | 1.0 | 936 | $2,150 | $2.30 | 9d | 1 | 1.31mi |
| 11960 133rd Ave Apt 1 Largo, FL | 3.0 | 1.0 | 936 | $2,150 | $2.30 | 0d | 1 | 1.31mi |
| 1448 Oak St Largo, FL | 2.0 | 2.0 | 1070 | $2,300 | $2.15 | 6d | 1 | 1.35mi |
| 1665 134th Ave Largo, FL | 3.0 | 1.0 | 1075 | $875 | $0.81 | 0d | 1 | 1.37mi |
| 10888 Temple Ave Seminole, FL | 2.0 | 2.0 | 1101 | $2,150 | $1.95 | 6d | 1 | 1.39mi |
| 1825 134th Ave Largo, FL | 3.0 | 2.0 | 1005 | $2,200 | $2.19 | 26d | 1 | 1.41mi |
| 2098 Seminole Blvd Largo, FL | 1.0–3.0 | 1.0–2.0 | 1018 | $2,395 | $2.35 | 4d | 23 | 1.44mi |
| 2131 Ridge Rd S #105 Largo, FL | 2.0 | 1.5 | 1035 | $1,850 | $1.79 | 26d | 1 | 1.44mi |
HOA detail condo
- Monthly dues
- $541 · $6,492/yr
- Assessments
- None detected in remarks — confirm with the listing agent.
Listing history 15 events
-
2026-05-04status Pending
-
2026-04-13price $159,000
-
2026-03-23price $169,000
-
2026-03-13price $179,900
-
2026-02-05price $189,900
-
2026-01-16price $199,900
-
2025-12-05$210,000 Active
-
2025-11-30historical
-
2025-11-10price $216,900
-
2025-08-27price $221,000
-
2025-07-09price $225,000
-
2025-06-18price $235,000
-
2025-05-01price $240,000
-
2025-04-22$250,000 Active
-
1989-03-20soldstatus $53,900
ⓘ Source: listings_history table (triggers on properties + properties_extension) + one-shot
backfill from property_details.listing_events for pre-trigger history.
Tax reassessment forecast FL · Resets to sale price
- Current annual tax
- $2,766 · $231/mo
- Projected year-2 tax
- $2,766 · $231/mo
- Expected delta
- $0/yr ($0/mo · 0.0%)
ⓘ Screening estimate from a state-policy table — verify with the county assessor before closing.
Climate risk First Street
- Flood 1/10 Low FEMA zone X (unshaded) · 0% chance over 30 yrs
- Wildfire 2/10 Low
- Heat 10/10 Extreme 7 d/yr ≥107°F today · 25 d/yr by 30 yrs out
- Wind 10/10 Extreme 99% chance of damaging wind over 30 yrs
- Air quality 3/10 Moderate 2 unhealthy d/yr today · 3 by 30 yrs out
Nearby sold comps map
Loading sold comps map…
Walkable amenities ~0.75 mi
Loading nearby amenities…
Taxation est. · year 1
- Rental income
- $24,264
- − Mortgage interest
- −$8,906
- − Property taxes
- −$2,766
- − Insurance
- −$795
- − Repairs & maintenance
- −$1,941
- − Management
- −$1,941
- − HOA
- −$6,492
- − Depreciation
- −$4,625
- Taxable loss
- −$3,203
- Est. tax savings @ 24.0%
- +$769
- After-tax cash flow
- $-122/yr
For passive investors: Depreciation is non-cash, so a rental often shows a tax loss while cash-flowing — sheltering income. Rental losses are passive: they offset passive income freely, and up to $25,000/yr can offset ordinary (W-2) income if you actively participate and your MAGI is under $100k (phasing out to $0 by $150k); unused losses carry forward. On sale, claimed depreciation is recaptured at up to 25%, and gains may owe capital-gains tax (a 1031 exchange can defer both). Figures are a year-1 estimate at your 24.0% rate — not tax advice; consult a CPA.
Schools (NCES district)
- District
- Pinellas
- NCES district ID
- 1201560
- Math proficiency
- 51% ▼ -5.00%
- Reading proficiency
- 51% ▼ -3.00%
- Median HH income
- $46,270
- Composite
- 43.27/100
- National rank
- #3046
- State rank
- #31 of 73 in FL
Livability — Seminole
- Score
- 88/100
- State rank
- #5
- US rank
- #174
Category grades
Schools grade is shown separately in the Schools card above.
Census & demographics
- County
- Pinellas County · 939,478 people
- City population
- 42,315
- Metro
- Tampa-St. Petersburg-Clearwater, FL
- Population (ZIP)
- 16,807
- Household income
- $65,355
- Rent vs Own
- Severe rent burden
- 261.0
Population outlook (Pinellas County) Hauer SSP2
- Today (2025)
- 1,027,532 people
- By 2030
- 1,063,586 · +3.5%
- By 2040
- 1,125,020 · +9.5%
- By 2050
- 1,168,637 · +13.7%
- By 2075
- 1,265,188 · +23.1%
- By 2100
- 1,260,357 · +22.7%
Race, ethnicity, and origin ACS 2023
- Neighborhood character
- Predominantly White (72%)
- Race & ethnicity
- White 72% Hispanic / Latino 15% Two or more races 11% Black 9% Asian 2%
- Hispanic origin (detail)
- Puerto Rican 3% Cuban 6%
- Common ancestry
- Romanian 3% Italian 3% Lithuanian 3%
- Foreign-born
- 13% · Canada, Vietnam, Jamaica
- Languages at home
- 85% English-only · Spanish 10% Vietnamese 1% French/Haitian/Cajun 1%
Political lean MEDSL · Pinellas
- 2024 margin
- Lean R (+5.2) · D 46.9% · R 52.1%
- 2008→2024 swing
- -13.5pp toward R · 2008: 8.3pp · 2024: -5.2pp
- All cycles
- 2024: R+5.2 2020: D+0.2 2016: R+1.1 2012: D+5.6 2008: D+8.3
Not yet ingested
- Civics
- —
Market trends
- HPI YoY
- ▼ -320.64%
- Current HPI
- 369.3008
- Rent YoY
- ▲ 1.38%
- Metro
- Tampa-St. Petersburg-Clearwater, FL
- State GDP YoY
- ▲ 3.28%
- F500 in state
- 36
Industry mix (Fortune 500 HQ in FL)
| Industry | F500 HQs | Revenue |
|---|---|---|
| Industrial Technology | 2 | $29B |
|
||
| Insurance | 2 | $17B |
|
||
| Retail | 1 | $60B |
|
||
| Technology Distribution | 1 | $58B |
|
||
| Homebuilding | 1 | $35B |
|
||
| Technology Manufacturing | 1 | $35B |
|
||
Price history
+195.0% since first listed15 events — show timeline
- 2026-05-04 Pending — Stellar MLS as Distributed by MLS Grid
- 2026-04-13 Price Changed $159,000 Stellar MLS as Distributed by MLS Grid
- 2026-03-23 Price Changed $169,000 Stellar MLS as Distributed by MLS Grid
- 2026-03-13 Price Changed $179,900 Stellar MLS as Distributed by MLS Grid
- 2026-02-05 Price Changed $189,900 Stellar MLS as Distributed by MLS Grid
- 2026-01-16 Price Changed $199,900 Stellar MLS as Distributed by MLS Grid
- 2025-12-05 Listed $210,000 Stellar MLS as Distributed by MLS Grid
- 2025-11-30 Listing Removed — Stellar MLS as Distributed by MLS Grid
- 2025-11-10 Price Changed $216,900 Stellar MLS as Distributed by MLS Grid
- 2025-08-27 Price Changed $221,000 Stellar MLS as Distributed by MLS Grid
- 2025-07-09 Price Changed $225,000 Stellar MLS as Distributed by MLS Grid
- 2025-06-18 Price Changed $235,000 Stellar MLS as Distributed by MLS Grid
- 2025-05-01 Price Changed $240,000 Stellar MLS as Distributed by MLS Grid
- 2025-04-22 Listed $250,000 Stellar MLS as Distributed by MLS Grid
- 1989-03-20 Sold (Public Records) $53,900 Public Records
Property tax history
+7.4%/yrLatest (2025): $2,766 · +8.1% YoY. Source: county tax records.
Cash-flow waterfall
monthlySold comps — $/sqft
last 12 mo · ≤1 miLoading sold comps…