1124 20th St · Columbus, GA
Flood risk No data
- FEMA flood zone
- —
- Chance of flooding over 30 yrs
- —
- Est. flood insurance / yr
- —
Fire risk No data
- Est. fire insurance / yr
- —
Heat risk No data
- Hot days now (above threshold)
- —
- Hot days in 30 yrs
- —
Wind risk No data
- Chance of severe wind over 30 yrs
- —
Air-quality risk No data
- Unhealthy air days now
- —
- Unhealthy air days in 30 yrs
- —
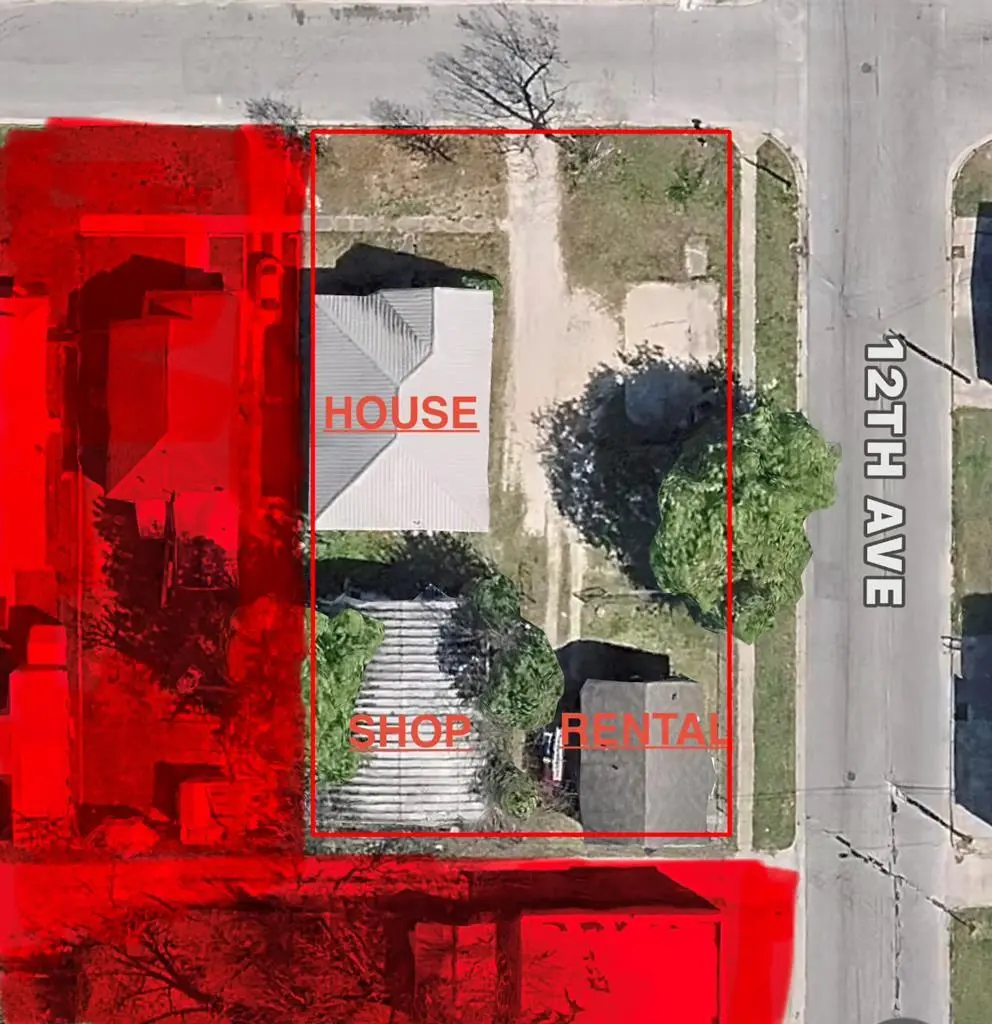
Risk factors via First Street. Map © Google.
Why this score? — see what drove the F grade
The composite is a weighted blend of 9 inputs, each scored 0–100. Each bar is that input's sub-score; the figure is the points it added to the 100-point composite (weight × sub-score).
- ARV discount +11.7/15.0
- Cash flow +8.1/30.0
- Livability +3.2/5.0
- Rent growth +2.8/5.0
- Condition / age +2.5/5.0
- DSCR +2.2/10.0
- Schools +2.2/10.0
- 1% rule +1.7/10.0
- Appreciation +0.0/10.0
$184,900
🖨 Deal sheet 📄 Offer letter ✓ Due diligence
Listing remarks
Rare commercial opportunity in a highly desirable area of Columbus. (We are willing to try and rezone it to residential for potential buyers. ) This two-lot property is sold together as one offering and features three commercial structures: a large workshop ideal for a variety of business uses, a secondary building offering flexible space for offices, storage, or light industrial use, and an additional structure ready for renovation or redevelopment. Positioned in a high-demand area with excellent potential for investors or owner-users seeking versatile commercial space and long-term value. Perfect for renovation, expansion, or future commercial development.
Key facts
- Flexible space
- Additional structure
- Two-lot property
Tags
Property features AI
Finance
- Other: Listing broker: 1st Class Real Estate Excellence; Listing agent: Matthew Smith — 706-573-3153; Listing broker contact: 706-237-8680
Exterior
- Home design: Single-family residence
- Exterior features: Lot approximately 0.33 acres
Interior
- Bathrooms: 2 full bathrooms
- Interior features: Located in the EAST HEIGHTS subdivision; Directions: Take I-85 S to I-185 S into Columbus; exit toward 20th Street and continue to 1130 20th Street
Neighborhood map
What this means for you Summary
Snapshot
- This is a 2-bed/2.0-bath single-family listed at $185k.
Deal economics
- At list price, monthly cash flow is $-178 ($-2k/yr) — negative.
- To cash-flow at today's rent, offer at most $153k (17.0% below list).
- To meet the 1% rule (rent ≥ 1% of price), the offer needs to be $123k (33.4% below list).
- Recommended offer: $123k (33.4% below list) — sets the bar for 1% rule.
Location & tenants
- Location reads 64/100 on livability (#254 in GA) — a middle-class / working-renter tenant base. Strengths: cost of living A+, housing A+, health & safety B; Watch: amenities D+, schools F, crime F.
- Muscogee County (urban): math 21% / reading 30% proficiency, ranked #120 of 174 in GA (top 69%) — low school quality limits family demand, transient renter base, plan for 1-2y turnover; 61% free/reduced lunch — lower-income household profile, screen leases tightly.
- Market conditions: Rents rising (+1.2%/yr); 60 active listings in the ZIP; 13 comparable units currently listed for rent nearby; rentals lingering (median 44d on market — plan ~5-8 weeks vacancy on turnover, expect pricing pressure); 62% of comp listings sitting > 30 days — soft ceiling on asking rent; 291 units permitted in Muscogee County in 2024 (30 in 5+ unit buildings).
Forward outlook
- Local home prices are declining (-3.0%/yr); year-one equity from $1k of loan paydown is wiped out by about $6k of value loss. Plan a longer hold.
- Muscogee County population projected at +15% by 2050 — modest demand growth; plan on rents tracking national, not racing it.
Negotiation context
- It's been on market 38 days — a 3% lower offer ($179k) is reasonable based on typical stale-listing flexibility.
- Current owner paid $80k; list at $185k implies a 131% gain — meaningful room to come down on a strong offer.
Risks & watch-outs
- Watch-outs: built in 1903 — expect roof / HVAC / electrical / plumbing capex.
Questions for the listing agent
- What do current leases actually rent for vs. the listed asking? Can we see a recent rent roll and the last 12 months of T-12 income?
- It's been on market 38 days. Have you received any prior offers? Is the seller open to a 33% concession, seller financing, or rate buy-down credit?
- Built in 1903 — when were the roof, HVAC, electrical panel, plumbing, and water heater last replaced?
- Is there a deadline driving the sale (1031 exchange, divorce, estate, relocation)? That informs how much negotiation room exists.
- Schools are F-rated, which usually means shorter tenancies and higher turnover. Who's the typical renter profile here, and what's been the actual vacancy rate?
- Crime grade is F in this area — have there been break-ins, vandalism, or insurance claims at this property in the last 3 years? What carrier currently insures it and at what premium?
- The area grade is low — what's the realistic commute time and amenity access for the typical tenant pool here? Any planned neighborhood developments (good or bad) we should know about?
- What's the average days-on-market for RENTAL listings here right now (not sales)? A rising rental-DOM trend means longer vacancies and softer asking-rent achievability than the comps imply.
- What's the recent tenant-quality profile in this submarket — average credit score on applications, eviction rate, late-payment / NSF rate, and stable-employment percentage? A property-management company in the area should have these aggregated.
- How much new for-sale + rental construction is in the pipeline within 1–3 miles? Heavy new supply typically softens prices + rents 12–24 months out; constrained supply supports both.
Investment metrics
- 1% rule
- 0.67% ✗
- Cap rate
- 5.14%
- Cash-on-cash
- -4.14%
- DSCR
- 0.82
- GRM
- 12.5
CMA / ARV
- ARV (median comp)
- $204,077
- List price
- $184,900
- Delta
- -9.40%
- Verdict
- FAIR
- Comps
- 20 within 1.0 mi
Show comp detail 12 sales within ~0.75 mi
| Address | Dist | Beds/Ba | Sqft | Sold | Price | $/sf | Match |
|---|---|---|---|---|---|---|---|
| 1301 20th St | 0.12mi | 3/2.0 (+1) | 1,711 (-1%) | 3mo | $120,000 | $70 | 86 |
| 1045 Linwood Blvd | 0.26mi | 3/2.0 (+1) | 1,630 (-5%) | 6mo | $58,000 | $36 | 69 |
| 1108 19th St | 0.08mi | 3/2.0 (+1) | 1,498 (-13%) | 2mo | $145,000 | $97 | 68 |
| 1447 21st St | 0.36mi | 3/2.0 (+1) | 1,836 (+7%) | 2mo | $201,900 | $110 | 65 |
| 1318 21st St | 0.18mi | 2/2.5 | 1,937 (+12%) | 6mo | $225,000 | $116 | 64 |
| 2718 10th Ave | 0.61mi | 3/2.0 (+1) | 1,656 (-4%) | 4mo | $175,000 | $106 | 57 |
| 2300 18th Ave | 0.65mi | 3/2.0 (+1) | 1,800 (+4%) | 2mo | $268,500 | $149 | 56 |
| 1927 18th Ave | 0.55mi | 2/1.0 | 1,574 (-9%) | 1mo | $229,900 | $146 | 55 |
| 1533 15th Ave | 0.51mi | 3/3.0 (+1) | 1,832 (+6%) | 3mo | $215,000 | $117 | 54 |
| 1403 19th Ave | 0.25mi | 3/1.0 (+1) | 1,950 (+13%) | 5mo | $74,000 | $38 | 53 |
| 1622 14th Ave | 0.40mi | 3/2.0 (+1) | 1,496 (-13%) | 5mo | $139,900 | $94 | 50 |
| 1504 17th Ave | 0.67mi | 3/2.0 (+1) | 1,906 (+11%) | 3mo | $300,000 | $157 | 43 |
Match score weights: distance 35% · size 25% · config 20% · recency 20%. Top-matched comps best support the ARV.
Projected returns pro-forma
-3.0% appreciation · 1.23% rent growth · sell at horizon
- IRR
- -25.1%
- Equity multiple
- 0.16×
- Total profit
- $-43,538
- Equity at exit
- $27,569
- IRR
- -26.7%
- Equity multiple
- -0.18×
- Total profit
- $-61,317
- Equity at exit
- $15,987
Cash invested: $51,772 (down + closing). Projections, not guarantees.
Landlord ↔ Tenant lean methodology
- Overall (STATE)
- 90 Strongly Landlord-Friendly
- State Georgia
- 90 Strongly Landlord-Friendly · R+3
- County
- — inherits STATE
- City
- — inherits STATE
ZIP-level market 31901
- Rents YoY
- 1.2%
- Active inventory
- 60
- Price-to-rent
- 12.5×
Monthly cashflow live
- Estimated rent
- $1,231 high interval (Pro) →
- Mortgage (P&I)
- −$970
- Tax from tax record
- −$104 /mo · $1,250/yr
- Insurance
- −$77
- HOA
- −$0
- Vacancy / Maint / Mgmt
- −$258
- Net cashflow
- $-178
Break-even live
UW: 25.0% down · 7.5% · 30yr · 1.5% tax · 5.0% vac · 8.0% maint · 8.0% mgmt
Financing live
Cash to close
- Down payment
- $46,225
- Closing costs
- $5,547
- Reserves months
- —
- Total cash needed
- —
Loan-product check · same deal, 3 products live
Conventional
25% down · 7.5% · 30yr
- Down + closing
- —
- Monthly P&I
- —
- Monthly cashflow
- —
- DSCR
- —
- Eligible?
- —
Personal DTI + credit; lowest rate.
DSCR
20% down · 8.5% · 30yr
- Down + closing
- —
- Monthly P&I
- —
- Monthly cashflow
- —
- DSCR
- —
- Eligible?
- —
No personal income docs; deal must DSCR.
Hard money
10% down · 12.0% · 12mo
- Down + closing
- —
- Monthly P&I
- —
- Monthly cashflow
- —
- DSCR
- —
- Eligible?
- —
Short-term bridge; refi at stabilization.
Rent comps 13 comps
| Address | Beds | Baths | Sqft | Rent | $/sqft | DOM | Units | Dist |
|---|---|---|---|---|---|---|---|---|
| 1503 11th Ave Columbus, GA | 3.0 | 2.0 | 1370 | $1,200 | $0.88 | 13d | 1 | 0.42mi |
| 1510 28th St Columbus, GA | 3.0 | 2.0 | 1050 | $800 | $0.76 | 43d | 1 | 0.66mi |
| 2922 Howard Ave Unit 3 Columbus, GA | 2.0 | 2.0 | 1100 | $795 | $0.72 | 43d | 1 | 0.68mi |
| 2908 10th Ave Columbus, GA | 3.0 | 2.0 | 2232 | $2,000 | $0.90 | 43d | 1 | 0.73mi |
| 707 28th St Columbus, GA | 3.0 | 1.0 | 1384 | $1,000 | $0.72 | 13d | 1 | 0.75mi |
| 1514 Forest Ave Columbus, GA | 2.0 | 1.5 | 1128 | $840 | $0.74 | 43d | 1 | 1.05mi |
| 1219 Eberhart Ave Unit 2 Columbus, GA | 2.0 | 1.0 | 1100 | $1,100 | $1.00 | 13d | 1 | 1.06mi |
| 1192 Munro Ave Columbus, GA | 3.0 | 2.0 | 1711 | $1,750 | $1.02 | 43d | 1 | 1.06mi |
| 1258 Cedar Ave Columbus, GA | 2.0 | 2.0 | 1220 | $1,400 | $1.15 | 43d | 1 | 1.08mi |
| 3822 Howard Ave Unit A Columbus, GA | 2.0 | 1.0 | 1241 | $1,150 | $0.93 | 43d | 1 | 1.36mi |
| 1521 Dixon Dr Columbus, GA | 2.0 | 2.0 | 1400 | $1,400 | $1.00 | 13d | 1 | 1.41mi |
| 1706 Wells Dr Columbus, GA | 3.0 | 2.0 | 1990 | $1,850 | $0.93 | 13d | 1 | 1.42mi |
| 1111 Henry Ave Columbus, GA | 3.0 | 2.0 | 1407 | $1,200 | $0.85 | 43d | 1 | 1.45mi |
Listing history 19 events
-
2026-06-18days on market $184,900 Active 38 DOM
-
2026-06-17days on market $184,900 Active 37 DOM
-
2026-06-16days on market $184,900 Active 36 DOM
-
2026-06-15days on market $184,900 Active 35 DOM
-
2026-06-14days on market $184,900 Active 33 DOM
-
2026-06-13days on market $184,900 Active 32 DOM
-
2026-06-10days on market $184,900 Active 30 DOM
-
2026-06-09days on market $184,900 Active 29 DOM
-
2026-06-08days on market $184,900 Active 28 DOM
-
2026-06-07days on market $184,900 Active 27 DOM
-
2026-06-05days on market $184,900 Active 24 DOM
-
2026-06-03days on market $184,900 Active 23 DOM
-
2026-06-02days on market $184,900 Active 22 DOM
-
2026-06-01days on market $184,900 Active 21 DOM
-
2026-05-31days on market $184,900 Active 20 DOM
-
2026-05-30days on market $184,900 Active 19 DOM
-
2026-04-16price $215,000
-
2026-01-17$215,000 Active 667-char remark
-
2012-10-12soldstatus $80,000
ⓘ Source: listings_history table (triggers on properties + properties_extension) + one-shot
backfill from property_details.listing_events for pre-trigger history.
Tax reassessment forecast GA · Resets to sale price
- Current annual tax
- $1,250 · $104/mo
- Projected year-2 tax
- $1,701 · $142/mo
- Expected delta
- +$451/yr (+$38/mo · 36.1%)
ⓘ Screening estimate from a state-policy table — verify with the county assessor before closing.
Nearby sold comps map
Loading sold comps map…
Walkable amenities ~0.75 mi
Loading nearby amenities…
Taxation est. · year 1
- Rental income
- $14,771
- − Mortgage interest
- −$10,357
- − Property taxes
- −$1,250
- − Insurance
- −$924
- − Repairs & maintenance
- −$1,182
- − Management
- −$1,182
- − Depreciation
- −$5,379
- Taxable loss
- −$5,503
- Est. tax savings @ 24.0%
- +$1,321
- After-tax cash flow
- $-820/yr
For passive investors: Depreciation is non-cash, so a rental often shows a tax loss while cash-flowing — sheltering income. Rental losses are passive: they offset passive income freely, and up to $25,000/yr can offset ordinary (W-2) income if you actively participate and your MAGI is under $100k (phasing out to $0 by $150k); unused losses carry forward. On sale, claimed depreciation is recaptured at up to 25%, and gains may owe capital-gains tax (a 1031 exchange can defer both). Figures are a year-1 estimate at your 24.0% rate — not tax advice; consult a CPA.
Schools (NCES district)
- District
- Muscogee County
- NCES district ID
- 1303870
- Math proficiency
- 21% ▼ -11.00%
- Reading proficiency
- 30% ▼ -7.00%
- Median HH income
- $41,176
- Composite
- 21.6/100
- National rank
- #8297
- State rank
- #120 of 174 in GA
Livability — Columbus
- Score
- 64/100
- State rank
- #254
- US rank
- #14102
Category grades
Schools grade is shown separately in the Schools card above.
Census & demographics
- Census place
- Columbus, GA
- County
- Muscogee County · 180,764 people
- City population
- 180,764
- Metro
- Columbus, GA-AL
- Population (ZIP)
- 5,841
- Household income
- $51,424
- Rent vs Own
- Severe rent burden
- 598.0
Population outlook (Muscogee County) Hauer SSP2
- Today (2025)
- 216,729 people
- By 2030
- 224,504 · +3.6%
- By 2040
- 238,318 · +10.0%
- By 2050
- 249,027 · +14.9%
- By 2075
- 264,862 · +22.2%
- By 2100
- 254,786 · +17.6%
Race, ethnicity, and origin ACS 2023
- Neighborhood character
- Diverse neighborhood (Simpson 0.62)
- Race & ethnicity
- White 53% Black 32% Two or more races 9% Hispanic / Latino 6% Asian 3%
- Hispanic origin (detail)
- Mexican 2% Puerto Rican 2%
- Common ancestry
- Slovak 2% Italian 1% Iranian 1%
- Foreign-born
- 4% · Canada
- Languages at home
- 92% English-only · Spanish 5% Other Asian/Pacific 2%
Political lean MEDSL · Muscogee
- 2024 margin
- Strong D (+23.4) · D 61.4% · R 38.0%
- 2008→2024 swing
- +3.7pp toward D · 2008: 19.7pp · 2024: 23.4pp
- All cycles
- 2024: D+23.4 2020: D+24.0 2016: D+18.6 2012: D+21.3 2008: D+19.7
Not yet ingested
- Civics
- —
Market trends
- HPI YoY
- ▼ -157.58%
- Current HPI
- 122.9139
- Rent YoY
- ▲ 1.23%
- Metro
- Columbus, GA-AL
- State GDP YoY
- ▲ 2.66%
- F500 in state
- 28
Industry mix (Fortune 500 HQ in GA)
| Industry | F500 HQs | Revenue |
|---|---|---|
| Paper / Packaging | 2 | $29B |
|
||
| Retail | 1 | $160B |
|
||
| Transportation / Logistics | 1 | $91B |
|
||
| Airlines | 1 | $62B |
|
||
| Consumer Goods | 1 | $47B |
|
||
| Utilities | 1 | $25B |
|
||
Price history
+131.1% since first listed4 events — show timeline
- 2026-05-27 Price Changed $184,900 CBOR
- 2026-04-16 Price Changed $215,000 CBOR
- 2026-01-17 Listed $215,000 CBOR
- 2012-10-12 Sold (Public Records) $80,000 Public Records
Property tax history
+3.4%/yrLatest (2025): $1,250 · +0.0% YoY. Source: county tax records.
Cash-flow waterfall
monthlySold comps — $/sqft
last 12 mo · ≤1 miLoading sold comps…