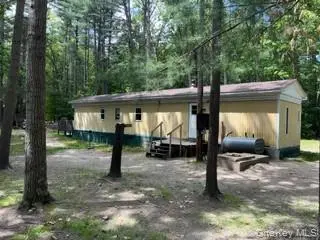
35 Grove St · Otisville, NY
Flood risk 7/10 · Major
- FEMA flood zone
- AE
- Chance of flooding over 30 yrs
- 0.76%
- Est. flood insurance / yr
- $1,737 – $8,500
Fire risk 3/10 · Minor
- Est. fire insurance / yr
- $691 – $1,283
Heat risk 4/10 · Minor
- Hot days now (above 96°F)
- 7 days/yr
- Hot days in 30 yrs
- 16 days/yr
Wind risk 3/10 · Minor
- Chance of severe wind over 30 yrs
- 7.0%
Air-quality risk 2/10 · Minimal
- Unhealthy air days now
- 1 days/yr
- Unhealthy air days in 30 yrs
- 2 days/yr
Risk factors via First Street. Map © Google.
Why this score? — see what drove the D+ grade
The composite is a weighted blend of 9 inputs, each scored 0–100. Each bar is that input's sub-score; the figure is the points it added to the 100-point composite (weight × sub-score).
- Cash flow +15.0/30.0
- ARV discount +7.5/15.0
- 1% rule +5.0/10.0
- DSCR +5.0/10.0
- Appreciation +5.0/10.0
- Schools +3.9/10.0
- Livability +3.5/5.0
- Rent growth +2.5/5.0
- Condition / age +2.5/5.0
$29,900
🖨 Deal sheet 📄 Offer letter ✓ Due diligence
Listing remarks
Being valued for land only with working well. Remove this mobile home and place your dream mobile home on this lot with current well. Double sized lot 100x100, Includes Carport. Only Full Priced offers will be considered. Rear yard construction materials belong to a separate lot.
Key facts
- Includes carport
- Double sized lot
- 0.23 acre lot
Tags
Property features AI
Exterior
- Parking: Two-space carport
- Utilities: No sewer information provided; No utilities listed
- Home design: Manufactured house; Mobile home on its own land
- Construction: Living area measured by appraiser
- Exterior features: Not on waterfront
Interior
- Kitchen: No appliances included
- Bedrooms: Bedroom on the first floor
- Bathrooms: One full bathroom
- Heating & cooling: Natural gas heating; Wall/window air conditioning
- Interior features: First-floor bedroom and first-floor full bath; No basement; No attic; Five total rooms
- Laundry & utility: No utility information provided
Neighborhood map
What this means for you Summary
Snapshot
- This is a 3-bed/1.0-bath manufactured listed at $30k.
Deal economics
- At list price, monthly cash flow is $1k ($15k/yr) — positive.
- The deal already cash-flows at list — no discount required.
- Meets the 1% rule at list price ($2k rent vs $30k).
- Recommended offer: $29k (1.5% below list) — sets the bar for market timing.
- Cap rate 73.0% vs local median 2.4% in Otisville — top-decile yield for the area; either an underpriced asset or a hidden risk that comps aren't pricing in. Stress-test before assuming the spread holds.
Location & tenants
- Location reads 70/100 on livability (#459 in NY) — a middle-class / working-renter tenant base. Strengths: employment A+, housing A+, crime A; Watch: amenities F, commute F.
- Port Jervis City School District (rural): math 43% / reading 50% proficiency, ranked #451 of 590 in NY (top 76%) — families likely to look elsewhere, expect single-tenant / working-renter base with shorter leases.
- Zoned schools: N A Hamilton Bicentennial School (math 42% / reading 62%, grade C-, #988 of 2,108 statewide, top 49%, 464 students, 54% FRL); Port Jervis Middle School (math 22% / reading 35%, grade F, #569 of 729 statewide, top 78%, 379 students, 59% FRL); Port Jervis Senior High School (math 87% / reading 95%, grade A+, #203 of 1,100 statewide, top 20%, 750 students, 55% FRL) — zoned schools at 56% FRL track the district average.
- Market conditions: 20 active listings in the ZIP; 1,746 units permitted in Orange County in 2024 (1,265 in 5+ unit buildings).
Forward outlook
- In year one you build about $226 of equity ($207 loan paydown + $19 appreciation (0.1% local appreciation)).
- At projected returns (0.1% appreciation + 3.0% rent growth), your $8k cash investment doubles in ~1 year — after that, you're playing with house money.
Negotiation context
- It's been on market 16 days — a 2% lower offer ($29k) is reasonable based on typical stale-listing flexibility.
- Current owner paid $13k; list at $30k implies a 125% gain — meaningful room to come down on a strong offer.
Risks & watch-outs
- Watch-outs: flood insurance adds $427/mo.
- Climate carrying-cost: in FEMA flood zone AE (mandatory federal flood insurance) — expect insurance premiums to compound above CPI over the hold.
Questions for the listing agent
- Built in 1973 — when were the roof, HVAC, electrical panel, plumbing, and water heater last replaced?
- What's the actual annual flood-insurance premium (NFIP or private), and is the property in a SFHA with mandatory coverage?
- Is there a deadline driving the sale (1031 exchange, divorce, estate, relocation)? That informs how much negotiation room exists.
- Schools are D-rated, which usually means shorter tenancies and higher turnover. Who's the typical renter profile here, and what's been the actual vacancy rate?
- The area grade is low — what's the realistic commute time and amenity access for the typical tenant pool here? Any planned neighborhood developments (good or bad) we should know about?
- What's the average days-on-market for RENTAL listings here right now (not sales)? A rising rental-DOM trend means longer vacancies and softer asking-rent achievability than the comps imply.
- What's the recent tenant-quality profile in this submarket — average credit score on applications, eviction rate, late-payment / NSF rate, and stable-employment percentage? A property-management company in the area should have these aggregated.
- How much new for-sale + rental construction is in the pipeline within 1–3 miles? Heavy new supply typically softens prices + rents 12–24 months out; constrained supply supports both.
Investment metrics
- 1% rule
- 7.91% ✓
- Cap rate
- 72.95%
- Cash-on-cash
- 238.07%
- DSCR
- 11.59
- GRM
- 1.1
CMA / ARV
No comps found within radius.
Projected returns pro-forma
0.06% appreciation · 3.0% rent growth · sell at horizon
- IRR
- —
- Equity multiple
- 10.33×
- Total profit
- $78,130
- Equity at exit
- $8,777
- IRR
- —
- Equity multiple
- 21.84×
- Total profit
- $174,500
- Equity at exit
- $10,627
Cash invested: $8,372 (down + closing). Projections, not guarantees.
Landlord ↔ Tenant lean methodology
- Overall (STATE)
- 15 Strongly Tenant-Friendly
- State New York
- 15 Strongly Tenant-Friendly · D+10
- County
- — inherits STATE
- City
- — inherits STATE
ZIP-level market 12729
- Home prices YoY
- 0.0%
- Active inventory
- 20
- Price-to-rent
- 1.1×
Monthly cashflow live
- Estimated rent
- $2,364 medium interval (Pro) →
- Mortgage (P&I)
- −$157
- Tax est. 1.5%
- −$37 /mo · $448/yr
- Insurance
- −$12
- Flood insurance flood zone
- −$427 /mo · $5,118/yr
- HOA
- −$0
- Vacancy / Maint / Mgmt
- −$496
- Net cashflow
- $1,234
Break-even live
UW: 25.0% down · 7.5% · 30yr · 1.5% tax · 5.0% vac · 8.0% maint · 8.0% mgmt
Financing live
Cash to close
- Down payment
- $7,475
- Closing costs
- $897
- Reserves months
- —
- Total cash needed
- —
Loan-product check · same deal, 3 products live
Conventional
25% down · 7.5% · 30yr
- Down + closing
- —
- Monthly P&I
- —
- Monthly cashflow
- —
- DSCR
- —
- Eligible?
- —
Personal DTI + credit; lowest rate.
DSCR
20% down · 8.5% · 30yr
- Down + closing
- —
- Monthly P&I
- —
- Monthly cashflow
- —
- DSCR
- —
- Eligible?
- —
No personal income docs; deal must DSCR.
Hard money
10% down · 12.0% · 12mo
- Down + closing
- —
- Monthly P&I
- —
- Monthly cashflow
- —
- DSCR
- —
- Eligible?
- —
Short-term bridge; refi at stabilization.
Listing history 12 events
-
2026-06-18days on market $29,900 Active 16 DOM
-
2026-06-17days on market $29,900 Active 15 DOM
-
2026-06-16days on market $29,900 Active 14 DOM
-
2026-06-15days on market $29,900 Active 13 DOM
-
2026-06-14days on market $29,900 Active 11 DOM
-
2026-06-13days on market $29,900 Active 10 DOM
-
2026-06-10days on market $29,900 Active 8 DOM
-
2026-06-09days on market $29,900 Active 7 DOM
-
2026-06-08days on market $29,900 Active 6 DOM
-
2026-06-07days on market $29,900 Active 5 DOM
-
2026-06-03remarks 280-char remark
-
2026-06-03$29,900 Active 1 DOM
ⓘ Source: listings_history table (triggers on properties + properties_extension) + one-shot
backfill from property_details.listing_events for pre-trigger history.
Climate risk First Street
- Flood 7/10 Severe FEMA zone AE · 76% chance over 30 yrs
- Wildfire 3/10 Moderate
- Heat 4/10 Moderate 7 d/yr ≥96°F today · 16 d/yr by 30 yrs out
- Wind 3/10 Moderate 7% chance of damaging wind over 30 yrs
- Air quality 2/10 Low 1 unhealthy d/yr today · 2 by 30 yrs out
Nearby sold comps map
Loading sold comps map…
Walkable amenities ~0.75 mi
Loading nearby amenities…
Taxation est. · year 1
- Rental income
- $28,368
- − Mortgage interest
- −$1,675
- − Property taxes
- −$448
- − Insurance
- −$5,268
- − Repairs & maintenance
- −$2,269
- − Management
- −$2,269
- − Depreciation
- −$870
- Taxable income
- $15,568
- Est. tax owed @ 24.0%
- −$3,736
- After-tax cash flow
- $11,076/yr
For passive investors: Depreciation is non-cash, so a rental often shows a tax loss while cash-flowing — sheltering income. Rental losses are passive: they offset passive income freely, and up to $25,000/yr can offset ordinary (W-2) income if you actively participate and your MAGI is under $100k (phasing out to $0 by $150k); unused losses carry forward. On sale, claimed depreciation is recaptured at up to 25%, and gains may owe capital-gains tax (a 1031 exchange can defer both). Figures are a year-1 estimate at your 24.0% rate — not tax advice; consult a CPA.
Schools (NCES district)
- District
- Port Jervis City School District
- NCES district ID
- 3623520
- Math proficiency
- 43% ▼ -7.00%
- Reading proficiency
- 50% ▲ 5.00%
- Median HH income
- $44,506
- Composite
- 39.33/100
- National rank
- #3984
- State rank
- #451 of 590 in NY
Livability — Otisville
- Score
- 70/100
- State rank
- #459
- US rank
- #7992
Category grades
Schools grade is shown separately in the Schools card above.
Census & demographics
- City population
- 3,940
- Population (ZIP)
- 1,307
Population outlook (Orange County) Hauer SSP2
- Today (2025)
- 379,830 people
- By 2030
- 378,955 · -0.2%
- By 2040
- 375,444 · -1.2%
- By 2050
- 369,311 · -2.8%
- By 2075
- 354,233 · -6.7%
- By 2100
- 318,150 · -16.2%
Race, ethnicity, and origin ACS 2023
- Neighborhood character
- Diverse neighborhood (Simpson 0.61)
- Race & ethnicity
- White 59% Black 14% Asian 12% Hispanic / Latino 9% Two or more races 6%
- Hispanic origin (detail)
- Puerto Rican 9%
- Common ancestry
- Hispanic 13% Romanian 6% Iranian 5%
- Foreign-born
- 16% · China
- Languages at home
- 80% English-only · Chinese 11% Spanish 4% French/Haitian/Cajun 3%
Political lean MEDSL · Orange
- 2024 margin
- Lean R (+8.4) · D 45.8% · R 54.2%
- 2008→2024 swing
- -12.5pp toward R · 2008: 4.1pp · 2024: -8.4pp
- All cycles
- 2024: R+8.4 2020: R+0.2 2016: R+6.5 2012: D+5.2 2008: D+4.1
Not yet ingested
- Civics
- —
Market trends
- HPI YoY
- ▲ 0.06%
- Current HPI
- 341.1758
- Rent YoY
- —
- Metro
- —
- State GDP YoY
- ▲ 2.60%
- F500 in state
- 92
Industry mix (Fortune 500 HQ in NY)
| Industry | F500 HQs | Revenue |
|---|---|---|
| Financial Services | 10 | $950B |
|
||
| Consumer Goods | 9 | $162B |
|
||
| Insurance | 4 | $225B |
|
||
| Telecommunications | 2 | $144B |
|
||
| Pharmaceuticals | 2 | $112B |
|
||
| Media / Entertainment | 2 | $69B |
|
||
Price history
+124.8% since first listed2 events — show timeline
- 2026-06-02 Listed $29,900 OneKey® MLS as Distributed by MLS Grid
- 2010-12-28 Sold (Public Records) $13,300 Public Records
Property tax history
-0.8%/yrLatest (2025): $1,654 · -1.0% YoY. Source: county tax records.
Cash-flow waterfall
monthlySold comps — $/sqft
last 12 mo · ≤1 miLoading sold comps…