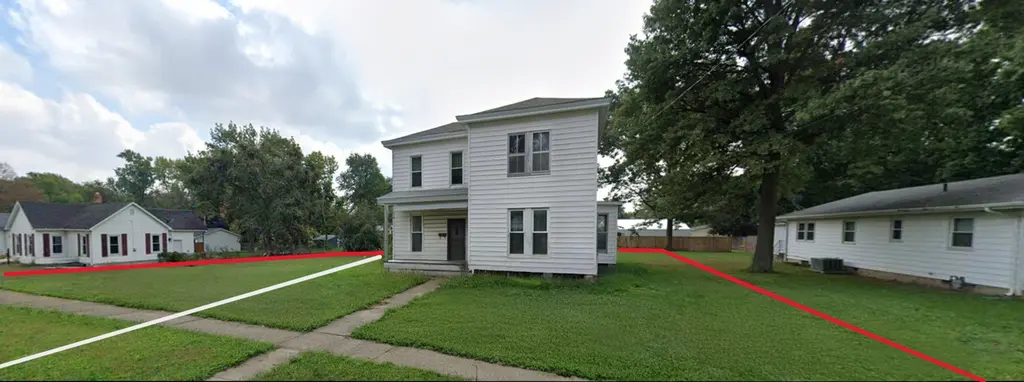
150 E Tanner St · Waverly, IL
Flood risk 1/10 · Minimal
- FEMA flood zone
- X (unshaded)
- Chance of flooding over 30 yrs
- 0.0%
- Est. flood insurance / yr
- $473 – $860
Fire risk 1/10 · Minimal
- Est. fire insurance / yr
- $804 – $1,492
Heat risk 4/10 · Minor
- Hot days now (above 105°F)
- 7 days/yr
- Hot days in 30 yrs
- 20 days/yr
Wind risk 2/10 · Minimal
- Chance of severe wind over 30 yrs
- 1.0%
Air-quality risk 2/10 · Minimal
- Unhealthy air days now
- 1 days/yr
- Unhealthy air days in 30 yrs
- 2 days/yr
Risk factors via First Street. Map © Google.
Why this score? — see what drove the B+ grade
The composite is a weighted blend of 9 inputs, each scored 0–100. Each bar is that input's sub-score; the figure is the points it added to the 100-point composite (weight × sub-score).
- Cash flow +30.0/30.0
- ARV discount +15.0/15.0
- 1% rule +10.0/10.0
- DSCR +10.0/10.0
- Livability +3.4/5.0
- Schools +2.7/10.0
- Rent growth +2.5/5.0
- Condition / age +2.5/5.0
- Appreciation +0.0/10.0
$54,900
🖨 Deal sheet 📄 Offer letter ✓ Due diligence
Listing remarks MLS
Submit Offers via Auction dot com or via Listing Agent. Sharp 3 Bedroom home with newer roof, full basement and jumbo size (2X) lot (that can be split) on a nice street. Very Nice place to live or great investment. Priced below the market. Curb Viewing only. Exterior Showing (curb viewing) Only. NO Inside Showings Available. No Inside Pictures Available. Great for Financial Investment or Owner Occupant. No Contingencies Will Be Accepted. As-Is, Cash Sale Only. No Survey or Keys Provided. Interior Access for Home Inspections Will Not Be Granted. Listing Information May Not Be Accurate. Buyers Must Do Their Own Due Diligence to Verify Number of Beds, Baths, Square Footage, Room Sizes, Lot Size & Any Other Property Details. Photos, Marketing Comments, and Due Diligence Items are Provided for Guidance Purposes Only. By Making an Offer on This Property, the Buyer Represents They Have Independently Verified All Information and Have Made the Decision to Make an Offer Based Upon Their Own Investigation.
Key facts
- 0.49 acre lot
- Built 1930
- Listed 70 days
Neighborhood map
What this means for you Summary
Snapshot
- This is a 3-bed/2.0-bath single-family listed at $55k.
Deal economics
- At list price, monthly cash flow is $346 ($4k/yr) — positive.
- The deal already cash-flows at list — no discount required.
- Meets the 1% rule at list price ($1k rent vs $55k).
- Recommended offer: $52k (6.0% below list) — sets the bar for market timing.
Location & tenants
- Location reads 67/100 on livability (#530 in IL) — a middle-class / working-renter tenant base. Strengths: crime A+, cost of living A+, housing A+; Watch: employment D, schools F, amenities F.
- Waverly CUSD 6 (rural): math 25% / reading 30% proficiency, ranked #546 of 919 in IL (top 59%) — low school quality limits family demand, transient renter base, plan for 1-2y turnover.
- Market conditions: 8 active listings in the ZIP; 3 units permitted in Morgan County in 2024 (0 in 5+ unit buildings).
Forward outlook
- Local home prices are declining (-3.0%/yr); year-one equity from $380 of loan paydown is wiped out by about $2k of value loss. Plan a longer hold.
- Morgan County population projected at -20% by 2050 — secular population decline; favor cash flow + early exit over multi-decade hold.
- At projected returns (-3.0% appreciation + 3.0% rent growth), your $15k cash investment doubles in ~5 years — after that, you're playing with house money.
Negotiation context
- It's been on market 71 days — a 6% lower offer ($52k) is reasonable based on typical stale-listing flexibility.
- 6 sale attempts with the ask held roughly flat each time — persistent listings suggest the price (not the market) is what's stuck; bring a comps-based counter.
Risks & watch-outs
- Watch-outs: property tax is 3.2% of price; built in 1930 — expect roof / HVAC / electrical / plumbing capex.
Questions for the listing agent
- It's been on market 71 days. Have you received any prior offers? Is the seller open to a 6% concession, seller financing, or rate buy-down credit?
- Built in 1930 — when were the roof, HVAC, electrical panel, plumbing, and water heater last replaced?
- Property tax is high relative to price — has the assessment been appealed recently, and will the sale trigger a re-assessment?
- Why hasn't it sold? Are there any deal-killer items the seller is aware of (foundation, flood, title, zoning, code violations)?
- Is there a deadline driving the sale (1031 exchange, divorce, estate, relocation)? That informs how much negotiation room exists.
- Schools are F-rated, which usually means shorter tenancies and higher turnover. Who's the typical renter profile here, and what's been the actual vacancy rate?
- What's the average days-on-market for RENTAL listings here right now (not sales)? A rising rental-DOM trend means longer vacancies and softer asking-rent achievability than the comps imply.
- What's the recent tenant-quality profile in this submarket — average credit score on applications, eviction rate, late-payment / NSF rate, and stable-employment percentage? A property-management company in the area should have these aggregated.
- How much new for-sale + rental construction is in the pipeline within 1–3 miles? Heavy new supply typically softens prices + rents 12–24 months out; constrained supply supports both.
Investment metrics
- 1% rule
- 1.85% ✓
- Cap rate
- 13.87%
- Cash-on-cash
- 27.05%
- DSCR
- 2.20
- GRM
- 4.5
CMA / ARV
- ARV (median comp)
- $99,751
- List price
- $54,900
- Delta
- -44.96%
- Verdict
- UNDERPRICED
- Comps
- 20 within 1.0 mi
Show comp detail 7 sales within ~0.75 mi
| Address | Dist | Beds/Ba | Sqft | Sold | Price | $/sf | Match |
|---|---|---|---|---|---|---|---|
| 475 S Pearl | 0.13mi | 3/1.0 | 1,100 (-1%) | 3mo | $24,900 | $23 | 86 |
| 322 S Prospect St | 0.12mi | 2/1.5 (-1) | 1,087 (-2%) | 9mo | $77,500 | $71 | 76 |
| 359 E Tremont St | 0.45mi | 3/2.0 | 1,186 (+7%) | 1mo | $128,500 | $108 | 67 |
| 352 W State St | 0.32mi | 2/1.0 (-1) | 1,100 (-1%) | 17mo | $20,000 | $18 | 60 |
| 396 E Tremont St | 0.43mi | 2/1.0 (-1) | 1,086 (-2%) | 15mo | $45,000 | $41 | 55 |
| 463 Morgan St | 0.57mi | 2/1.0 (-1) | 1,096 (-1%) | 19mo | $82,400 | $75 | 46 |
| 3440 By Pass Rd | 0.72mi | 3/1.0 | 1,228 (+10%) | 18mo | $169,000 | $138 | 30 |
Match score weights: distance 35% · size 25% · config 20% · recency 20%. Top-matched comps best support the ARV.
Projected returns pro-forma
-3.0% appreciation · 3.0% rent growth · sell at horizon
- IRR
- 21.1%
- Equity multiple
- 1.86×
- Total profit
- $13,236
- Equity at exit
- $8,186
- IRR
- 29.3%
- Equity multiple
- 3.62×
- Total profit
- $40,200
- Equity at exit
- $4,747
Cash invested: $15,372 (down + closing). Projections, not guarantees.
Landlord ↔ Tenant lean methodology
- Overall (STATE)
- 43 Moderately Tenant-Leaning
- State Illinois
- 43 Moderately Tenant-Leaning · D+7
- County
- — inherits STATE
- City
- — inherits STATE
ZIP-level market 62692
- Home prices YoY
- -29.3%
- Active inventory
- 8
- Price-to-rent
- 4.5×
Monthly cashflow live
- Estimated rent
- $1,018 medium interval (Pro) →
- Mortgage (P&I)
- −$288
- Tax from tax record
- −$147 /mo · $1,763/yr
- Insurance
- −$23
- HOA
- −$0
- Vacancy / Maint / Mgmt
- −$214
- Net cashflow
- $346
Break-even live
UW: 25.0% down · 7.5% · 30yr · 1.5% tax · 5.0% vac · 8.0% maint · 8.0% mgmt
Financing live
Cash to close
- Down payment
- $13,725
- Closing costs
- $1,647
- Reserves months
- —
- Total cash needed
- —
Loan-product check · same deal, 3 products live
Conventional
25% down · 7.5% · 30yr
- Down + closing
- —
- Monthly P&I
- —
- Monthly cashflow
- —
- DSCR
- —
- Eligible?
- —
Personal DTI + credit; lowest rate.
DSCR
20% down · 8.5% · 30yr
- Down + closing
- —
- Monthly P&I
- —
- Monthly cashflow
- —
- DSCR
- —
- Eligible?
- —
No personal income docs; deal must DSCR.
Hard money
10% down · 12.0% · 12mo
- Down + closing
- —
- Monthly P&I
- —
- Monthly cashflow
- —
- DSCR
- —
- Eligible?
- —
Short-term bridge; refi at stabilization.
Listing history 27 events
-
2026-06-18days on market $54,900 Active 71 DOM
-
2026-06-17days on market $54,900 Active 70 DOM
-
2026-06-16days on market $54,900 Active 69 DOM
-
2026-06-15days on market $54,900 Active 68 DOM
-
2026-06-13days on market $54,900 Active 66 DOM
-
2026-06-12days on market $54,900 Active 65 DOM
-
2026-06-09days on market $54,900 Active 62 DOM
-
2026-06-08days on market $54,900 Active 61 DOM
-
2026-06-07days on market $54,900 Active 60 DOM
-
2026-06-05days on market $54,900 Active 58 DOM
-
2026-06-04days on market $54,900 Active 56 DOM
-
2026-06-02days on market $54,900 Active 55 DOM
-
2026-06-01days on market $54,900 Active 54 DOM
-
2026-05-31days on market $54,900 Active 53 DOM
-
2026-05-31days on market $54,900 Active 52 DOM
-
2026-04-08$54,900 Active 1014-char remark
Show marketing remark (1014 chars)
Submit Offers via Auction dot com or via Listing Agent. Sharp 3 Bedroom home with newer roof, full basement and jumbo size (2X) lot (that can be split) on a nice street. Very Nice place to live or great investment. Priced below the market. Curb Viewing only. Exterior Showing (curb viewing) Only. NO Inside Showings Available. No Inside Pictures Available. Great for Financial Investment or Owner Occupant. No Contingencies Will Be Accepted. As-Is, Cash Sale Only. No Survey or Keys Provided. Interior Access for Home Inspections Will Not Be Granted. Listing Information May Not Be Accurate. Buyers Must Do Their Own Due Diligence to Verify Number of Beds, Baths, Square Footage, Room Sizes, Lot Size & Any Other Property Details. Photos, Marketing Comments, and Due Diligence Items are Provided for Guidance Purposes Only. By Making an Offer on This Property, the Buyer Represents They Have Independently Verified All Information and Have Made the Decision to Make an Offer Based Upon Their Own Investigation.
-
2026-04-08historical
Show marketing remark (1014 chars)
Submit Offers via Auction dot com or via Listing Agent. Sharp 3 Bedroom home with newer roof, full basement and jumbo size (2X) lot (that can be split) on a nice street. Very Nice place to live or great investment. Priced below the market. Curb Viewing only. Exterior Showing (curb viewing) Only. NO Inside Showings Available. No Inside Pictures Available. Great for Financial Investment or Owner Occupant. No Contingencies Will Be Accepted. As-Is, Cash Sale Only. No Survey or Keys Provided. Interior Access for Home Inspections Will Not Be Granted. Listing Information May Not Be Accurate. Buyers Must Do Their Own Due Diligence to Verify Number of Beds, Baths, Square Footage, Room Sizes, Lot Size & Any Other Property Details. Photos, Marketing Comments, and Due Diligence Items are Provided for Guidance Purposes Only. By Making an Offer on This Property, the Buyer Represents They Have Independently Verified All Information and Have Made the Decision to Make an Offer Based Upon Their Own Investigation.
-
2026-01-16historical
-
2026-01-16status Active
-
2026-01-14historical
-
2026-01-08status Active
-
2026-01-07historical
-
2026-01-07Active
-
2026-01-06historical
-
2026-01-06status Active
-
2026-01-05historical
-
2025-10-03Active
ⓘ Source: listings_history table (triggers on properties + properties_extension) + one-shot
backfill from property_details.listing_events for pre-trigger history.
Tax reassessment forecast IL · Partial reset (capped growth)
- Current annual tax
- $1,763 · $147/mo
- Projected year-2 tax
- $1,763 · $147/mo
- Expected delta
- $0/yr ($0/mo · 0.0%)
ⓘ Screening estimate from a state-policy table — verify with the county assessor before closing.
Climate risk First Street
- Flood 1/10 Low FEMA zone X (unshaded) · 0% chance over 30 yrs
- Wildfire 1/10 Low
- Heat 4/10 Moderate 7 d/yr ≥105°F today · 20 d/yr by 30 yrs out
- Wind 2/10 Low 100% chance of damaging wind over 30 yrs
- Air quality 2/10 Low 1 unhealthy d/yr today · 2 by 30 yrs out
Nearby sold comps map
Loading sold comps map…
Walkable amenities ~0.75 mi
Loading nearby amenities…
Taxation est. · year 1
- Rental income
- $12,215
- − Mortgage interest
- −$3,075
- − Property taxes
- −$1,763
- − Insurance
- −$274
- − Repairs & maintenance
- −$977
- − Management
- −$977
- − Depreciation
- −$1,597
- Taxable income
- $3,551
- Est. tax owed @ 24.0%
- −$852
- After-tax cash flow
- $3,306/yr
For passive investors: Depreciation is non-cash, so a rental often shows a tax loss while cash-flowing — sheltering income. Rental losses are passive: they offset passive income freely, and up to $25,000/yr can offset ordinary (W-2) income if you actively participate and your MAGI is under $100k (phasing out to $0 by $150k); unused losses carry forward. On sale, claimed depreciation is recaptured at up to 25%, and gains may owe capital-gains tax (a 1031 exchange can defer both). Figures are a year-1 estimate at your 24.0% rate — not tax advice; consult a CPA.
Schools (NCES district)
- District
- Waverly CUSD 6
- NCES district ID
- 1741280
- Math proficiency
- 25% ▲ 5.00%
- Reading proficiency
- 30% ▼ -5.00%
- Median HH income
- $47,724
- Composite
- 26.84/100
- National rank
- #12532
- State rank
- #546 of 919 in IL
Livability — Waverly
- Score
- 67/100
- State rank
- #530
- US rank
- #11013
Category grades
Schools grade is shown separately in the Schools card above.
Census & demographics
- Census place
- Waverly, IL
- Population (ZIP)
- 2,128
Population outlook (Morgan County) Hauer SSP2
- Today (2025)
- 32,874 people
- By 2030
- 31,698 · -3.6%
- By 2040
- 29,050 · -11.6%
- By 2050
- 26,381 · -19.8%
- By 2075
- 20,235 · -38.4%
- By 2100
- 14,324 · -56.4%
Race, ethnicity, and origin ACS 2023
- Neighborhood character
- Predominantly White (90%)
- Race & ethnicity
- White 90% Two or more races 7% Hispanic / Latino 6% Black 2%
- Hispanic origin (detail)
- Mexican 6%
- Common ancestry
- Portuguese 2% Iranian 1% Slovak 1%
- Foreign-born
- 1% · China, Canada
- Languages at home
- 99% English-only · Spanish 1%
Political lean MEDSL · Morgan
- 2024 margin
- Solid R (+32.5) · D 33.1% · R 65.6% · Other 1.3%
- 2008→2024 swing
- -31.7pp toward R · 2008: -0.8pp · 2024: -32.5pp
- All cycles
- 2024: R+32.5 2020: R+31.8 2016: R+29.9 2012: R+15.4 2008: R+0.8
Not yet ingested
- Civics
- —
Market trends
- HPI YoY
- ▼ -49.54%
- Current HPI
- 119.5709
- Rent YoY
- —
- Metro
- —
- State GDP YoY
- ▲ 1.59%
- F500 in state
- 60
Industry mix (Fortune 500 HQ in IL)
| Industry | F500 HQs | Revenue |
|---|---|---|
| Insurance | 4 | $201B |
|
||
| Consumer Goods | 4 | $87B |
|
||
| Industrial Machinery | 3 | $64B |
|
||
| Healthcare | 2 | $55B |
|
||
| Retail / Pharmacy | 1 | $148B |
|
||
| Agriculture / Food | 1 | $86B |
|
||
Price history
12 events — show timeline
- 2026-04-08 Listing Removed — MRED as Distributed by MLS Grid
- 2026-04-08 Listed $54,900 MRED as Distributed by MLS Grid
- 2026-01-16 Listing Removed — MRED as Distributed by MLS Grid
- 2026-01-16 Relisted — MRED as Distributed by MLS Grid
- 2026-01-14 Listing Removed — MRED as Distributed by MLS Grid
- 2026-01-08 Relisted — MRED as Distributed by MLS Grid
- 2026-01-07 Listing Removed — MRED as Distributed by MLS Grid
- 2026-01-07 Listed — MRED as Distributed by MLS Grid
- 2026-01-06 Listing Removed — RMLSA as Distributed by MLS Grid
- 2026-01-06 Relisted — MRED as Distributed by MLS Grid
- 2026-01-05 Listing Removed — MRED as Distributed by MLS Grid
- 2025-10-03 Listed — RMLSA as Distributed by MLS Grid
Property tax history
+3.0%/yrLatest (2024): $1,763 · +20.1% YoY. Source: county tax records.
Cash-flow waterfall
monthlySold comps — $/sqft
last 12 mo · ≤1 miLoading sold comps…