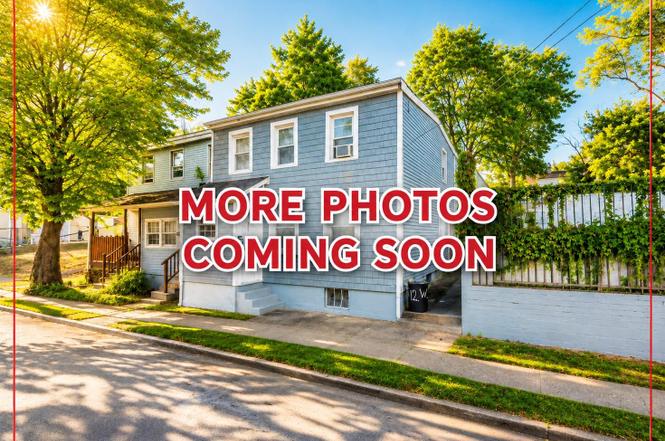
142 W Parmenter St #2 · Newburgh, NY
Flood risk 1/10 · Minimal
- FEMA flood zone
- X (unshaded)
- Chance of flooding over 30 yrs
- 0.0%
- Est. flood insurance / yr
- $473 – $860
Fire risk 1/10 · Minimal
- Est. fire insurance / yr
- $691 – $1,283
Heat risk 5/10 · Moderate
- Hot days now (above 100°F)
- 7 days/yr
- Hot days in 30 yrs
- 16 days/yr
Wind risk 4/10 · Minor
- Chance of severe wind over 30 yrs
- 12.0%
Air-quality risk 3/10 · Minor
- Unhealthy air days now
- 2 days/yr
- Unhealthy air days in 30 yrs
- 3 days/yr
Risk factors via First Street. Map © Google.
Why this score? — see what drove the D grade
The composite is a weighted blend of 9 inputs, each scored 0–100. Each bar is that input's sub-score; the figure is the points it added to the 100-point composite (weight × sub-score).
- ARV discount +13.6/15.0
- Cash flow +11.7/30.0
- 1% rule +4.3/10.0
- Schools +3.5/10.0
- DSCR +3.4/10.0
- Livability +3.1/5.0
- Rent growth +2.7/5.0
- Condition / age +2.5/5.0
- Appreciation +0.0/10.0
$285,000
🖨 Deal sheet (PDF) 📄 Offer letter ✓ Due diligence
Listing remarks MLS
IDEAL FOR INVESTOR. .ATTACHED HOME IS VERY NICECORPORATE OWNED SOLD IN AS IS CONDITION ELEC NOT ON BRING FLASHLIGHT
Key facts
- 2,500 sq ft lot
- Built 1900
Property features AI
Exterior
- Parking: Off-street parking; No carport
- Utilities: Public sewer; Cable available
- Home design: Single-family residence; Living area listed as 1324
- Construction: Frame construction
- Exterior features: Frame construction; Not waterfront
Interior
- Kitchen: Eat-in kitchen; No appliances listed
- Bedrooms: Total rooms: 7 (bedroom count not specified)
- Bathrooms: 1 full bathroom; 1 half bathroom
- Heating & cooling: Baseboard heating; Natural gas heating; Wall/window AC unit(s)
- Interior features: First-floor full bathroom; Eat-in kitchen; Unfinished basement
- Laundry & utility: Basement utility space
Neighborhood map
What this means for you Summary
Snapshot
- This is a 4-bed/1.5-bath single-family listed at $285k.
Deal economics
- At list price, monthly cash flow is $-83 ($-1k/yr) — negative.
- To cash-flow at today's rent, offer at most $270k (5.2% below list).
- To meet the 1% rule (rent ≥ 1% of price), the offer needs to be $266k (6.7% below list).
- Recommended offer: $266k (6.7% below list) — sets the bar for 1% rule.
- Cap rate 5.9% vs local median 4.4% in Newburgh — top-decile yield for the area; either an underpriced asset or a hidden risk that comps aren't pricing in. Stress-test before assuming the spread holds.
Location & tenants
- Location reads 62/100 on livability (#878 in NY) — a middle-class / working-renter tenant base. Strengths: health & safety A+, housing B+, cost of living B; Watch: employment D+, crime F, amenities F.
- Newburgh City School District (suburban): math 33% / reading 48% proficiency, ranked #500 of 590 in NY (top 85%) — families likely to look elsewhere, expect single-tenant / working-renter base with shorter leases; 61% free/reduced lunch — lower-income household profile, screen leases tightly.
- Zoned schools: Meadow Hill Global Explorations Magnet School (math 24% / reading 47%, grade F, #1,566 of 2,108 statewide, top 74%, 1,013 students, 58% FRL); Newburgh Free Academy (math 76% / reading 85%, grade A, #506 of 1,100 statewide, top 46%, 3,433 students, 56% FRL) — zoned schools at 57% FRL track the district average.
- Zoned-school proficiency averages 58% at this address vs 40% district-wide (+18 pts) — the actual schools serving this property are materially stronger than the Newburgh City School District average implies; a family-tenant draw the district grade alone would hide.
- Market conditions: Rents flat; 384 active listings in the ZIP; 14 comparable units currently listed for rent nearby; rentals lingering (median 46d on market — plan ~5-8 weeks vacancy on turnover, expect pricing pressure); 57% of comp listings sitting > 30 days — soft ceiling on asking rent; solid renter incomes; 1,746 units permitted in Orange County in 2024 (1,265 in 5+ unit buildings).
- This rent runs 37% of the median local income ($86k/yr) — at the standard rent-burdened threshold; future hikes will face affordability resistance.
Forward outlook
- Local home prices are declining (-3.0%/yr); year-one equity from $2k of loan paydown is wiped out by about $9k of value loss. Plan a longer hold.
Negotiation context
- Only 1 days on market — expect competitive offers; lowballing is unlikely to land.
- Current owner paid $190k; list at $285k implies a 50% gain — meaningful room to come down on a strong offer.
Risks & watch-outs
- Watch-outs: built in 1900 — expect roof / HVAC / electrical / plumbing capex.
- Climate carrying-cost: extreme-heat days projected 7→16/yr by 2055 (HVAC capex compounding) — expect insurance premiums to compound above CPI over the hold.
Questions for the listing agent
- What do current leases actually rent for vs. the listed asking? Can we see a recent rent roll and the last 12 months of T-12 income?
- Built in 1900 — when were the roof, HVAC, electrical panel, plumbing, and water heater last replaced?
- Is there a deadline driving the sale (1031 exchange, divorce, estate, relocation)? That informs how much negotiation room exists.
- Schools are D-rated, which usually means shorter tenancies and higher turnover. Who's the typical renter profile here, and what's been the actual vacancy rate?
- Crime grade is F in this area — have there been break-ins, vandalism, or insurance claims at this property in the last 3 years? What carrier currently insures it and at what premium?
- The area grade is low — what's the realistic commute time and amenity access for the typical tenant pool here? Any planned neighborhood developments (good or bad) we should know about?
- What's the average days-on-market for RENTAL listings here right now (not sales)? A rising rental-DOM trend means longer vacancies and softer asking-rent achievability than the comps imply.
- What's the recent tenant-quality profile in this submarket — average credit score on applications, eviction rate, late-payment / NSF rate, and stable-employment percentage? A property-management company in the area should have these aggregated.
- How much new for-sale + rental construction is in the pipeline within 1–3 miles? Heavy new supply typically softens prices + rents 12–24 months out; constrained supply supports both.
Investment metrics
- 1% rule
- 0.93% ✗
- Cap rate
- 5.94%
- Cash-on-cash
- -1.25%
- DSCR
- 0.94
- GRM
- 8.9
CMA / ARV
- ARV (on-the-fly)
- $329,676
- Comps found
- 12
Show comp detail 12 sales within ~0.75 mi
| Address | Dist | Beds/Ba | Sqft | Sold | Price | $/sf | Match |
|---|---|---|---|---|---|---|---|
| 75 Prospect St | 0.47mi | 3/1.0 (-1) | 1,408 (+6%) | 2mo | $345,000 | $245 | 59 |
| 77 Prospect St | 0.47mi | 3/2.0 (-1) | 1,442 (+9%) | 2mo | $387,500 | $269 | 54 |
| 197 Chambers St | 0.72mi | 3/1.0 (-1) | 1,272 (-4%) | 2mo | $130,000 | $102 | 51 |
| 80 Carter St | 0.39mi | 3/1.0 (-1) | 1,410 (+6%) | 16mo | $215,000 | $152 | 50 |
| 22 Fullerton Ave | 0.51mi | 4/2.5 | 1,472 (+11%) | 6mo | $365,000 | $248 | 49 |
| 17 Overlook Pl | 0.53mi | 3/1.0 (-1) | 1,232 (-7%) | 16mo | $425,000 | $345 | 44 |
| 19 E Parmenter St | 0.31mi | 3/1.0 (-1) | 1,140 (-14%) | 15mo | $192,000 | $168 | 43 |
| 375 3rd St | 0.61mi | 3/1.0 (-1) | 1,200 (-9%) | 8mo | $299,000 | $249 | 42 |
| 55 Henry Ave | 0.54mi | 3/2.0 (-1) | 1,474 (+11%) | 16mo | $370,000 | $251 | 36 |
| 112 Prospect St | 0.56mi | 3/1.5 (-1) | 1,519 (+15%) | 12mo | $379,900 | $250 | 34 |
| 61 Beacon St | 0.57mi | 3/2.0 (-1) | 1,501 (+13%) | 14mo | $350,449 | $233 | 32 |
| 419 3rd St | 0.70mi | 3/1.0 (-1) | 1,188 (-10%) | 14mo | $310,000 | $261 | 32 |
Match score weights: distance 35% · size 25% · config 20% · recency 20%. Top-matched comps best support the ARV.
Projected returns pro-forma
-3.0% appreciation · 0.63% rent growth · sell at horizon
- IRR
- -21.3%
- Equity multiple
- 0.28×
- Total profit
- $-57,510
- Equity at exit
- $42,494
- IRR
- -22.4%
- Equity multiple
- -0.01×
- Total profit
- $-80,450
- Equity at exit
- $24,642
Cash invested: $79,800 (down + closing). Projections, not guarantees.
Landlord ↔ Tenant lean methodology
- Overall (STATE)
- 15 Strongly Tenant-Friendly
- State New York
- 15 Strongly Tenant-Friendly · D+10
- County
- — inherits STATE
- City
- — inherits STATE
ZIP-level market 12550
- Home prices YoY
- -33.3%
- Rents YoY
- 0.6%
- Active inventory
- 384
- Price-to-rent
- 8.9×
Monthly cashflow live
- Estimated rent
- $2,659 high interval (Pro) →
- Mortgage (P&I)
- −$1,495
- Tax from tax record
- −$571 /mo · $6,847/yr
- Insurance
- −$119
- HOA
- −$0
- Vacancy / Maint / Mgmt
- −$558
- Net cashflow
- $-83
Break-even live
Sensitivity live
| Price | -10% $78 | -5% $-3 | +0% $-83 | +5% $-164 | +10% $-245 |
|---|---|---|---|---|---|
| Rent | -10% $-293 | -5% $-188 | +0% $-83 | +5% $22 | +10% $127 |
| Rate | -1.0pp $60 | -0.5pp $-11 | base $-83 | +0.5pp $-157 | +1.0pp $-232 |
UW: 25.0% down · 7.5% · 30yr · 1.5% tax · 5.0% vac · 8.0% maint · 8.0% mgmt
Financing live
Cash to close
- Down payment
- $71,250
- Closing costs
- $8,550
- Reserves months
- —
- Total cash needed
- —
Loan-product check · same deal, 3 products live
Conventional
25% down · 7.5% · 30yr
- Down + closing
- —
- Monthly P&I
- —
- Monthly cashflow
- —
- DSCR
- —
- Eligible?
- —
Personal DTI + credit; lowest rate.
DSCR
20% down · 8.5% · 30yr
- Down + closing
- —
- Monthly P&I
- —
- Monthly cashflow
- —
- DSCR
- —
- Eligible?
- —
No personal income docs; deal must DSCR.
Hard money
10% down · 12.0% · 12mo
- Down + closing
- —
- Monthly P&I
- —
- Monthly cashflow
- —
- DSCR
- —
- Eligible?
- —
Short-term bridge; refi at stabilization.
Rent comps 14 comps
| Address | Beds | Baths | Sqft | Rent | $/sqft | DOM | Units | Dist |
|---|---|---|---|---|---|---|---|---|
| 42 Hasbrouck St Newburgh, NY | 3.0 | 1.5 | 1008 | $2,550 | $2.53 | 45d | 1 | 0.03mi |
| 28 Hasbrouck St Newburgh, NY | 3.0 | 1.5 | 1188 | $2,700 | $2.27 | 45d | 1 | 0.04mi |
| 259 1st St Newburgh, NY | 3.0 | 2.0 | 883 | $2,000 | $2.27 | 45d | 1 | 0.32mi |
| 22 Benkard Ave Unit 1 Newburgh, NY | 3.0 | 1.0 | 1075 | $1,750 | $1.63 | 45d | 1 | 0.34mi |
| 52 S Miller St Newburgh, NY | 3.0 | 1.0 | 889 | $1,900 | $2.14 | 45d | 1 | 0.35mi |
| 4 Grand St Unit 3 Newburgh, NY | 4.0 | 2.0 | 1560 | $3,925 | $2.52 | 25d | 1 | 0.43mi |
| 81 Liberty Street Washington Hts Unit 2 Newburgh, NY | 3.0 | 1.0 | 1362 | $2,950 | $2.17 | 45d | 1 | 0.57mi |
| 160 N Miller St #1 Newburgh, NY | 4.0 | 1.0 | 1600 | $2,500 | $1.56 | 45d | 1 | 0.62mi |
| 457 1st St Newburgh, NY | 3.0 | 1.0 | 1680 | $2,950 | $1.76 | 45d | 1 | 0.63mi |
| 193 South St Unit 2 Newburgh, NY | 3.0 | 1.5 | 1200 | $2,415 | $2.01 | 15d | 1 | 0.65mi |
| 9 Arlington Pl Newburgh, NY | 3.0 | 1.0 | 950 | $2,300 | $2.42 | 15d | 1 | 0.75mi |
| 268 Carpenter Ave Unit 1 Newburgh, NY | 3.0 | 2.0 | 950 | $2,600 | $2.74 | 25d | 1 | 0.87mi |
| 171 West St Newburgh, NY | 3.0 | 1.5 | 1299 | $2,800 | $2.16 | 25d | 1 | 0.92mi |
| 62 Poplar St Newburgh, NY | 3.0 | 1.5 | 1272 | $3,000 | $2.36 | 25d | 1 | 1.45mi |
Listing history 2 events
-
2026-06-17remarks 693-char remark
-
2026-06-17$285,000 Coming Soon 1 DOM
ⓘ Source: listings_history table (triggers on properties + properties_extension) + one-shot
backfill from property_details.listing_events for pre-trigger history.
Tax reassessment forecast NY · Partial reset (capped growth)
- Current annual tax
- $6,847 · $571/mo
- Projected year-2 tax
- $6,847 · $571/mo
- Expected delta
- $0/yr ($0/mo · 0.0%)
ⓘ Screening estimate from a state-policy table — verify with the county assessor before closing.
Climate risk First Street
- Flood 1/10 Low FEMA zone X (unshaded) · 0% chance over 30 yrs
- Wildfire 1/10 Low
- Heat 5/10 Major 7 d/yr ≥100°F today · 16 d/yr by 30 yrs out
- Wind 4/10 Moderate 12% chance of damaging wind over 30 yrs
- Air quality 3/10 Moderate 2 unhealthy d/yr today · 3 by 30 yrs out
Nearby sold comps map
Loading sold comps map…
Walkable amenities ~0.75 mi
Loading nearby amenities…
Taxation est. · year 1
- Rental income
- $31,908
- − Mortgage interest
- −$15,964
- − Property taxes
- −$6,847
- − Insurance
- −$1,425
- − Repairs & maintenance
- −$2,553
- − Management
- −$2,553
- − Depreciation
- −$8,291
- Taxable loss
- −$5,725
- Est. tax savings @ 24.0%
- +$1,374
- After-tax cash flow
- $374/yr
For passive investors: Depreciation is non-cash, so a rental often shows a tax loss while cash-flowing — sheltering income. Rental losses are passive: they offset passive income freely, and up to $25,000/yr can offset ordinary (W-2) income if you actively participate and your MAGI is under $100k (phasing out to $0 by $150k); unused losses carry forward. On sale, claimed depreciation is recaptured at up to 25%, and gains may owe capital-gains tax (a 1031 exchange can defer both). Figures are a year-1 estimate at your 24.0% rate — not tax advice; consult a CPA.
Schools (NCES district)
- District
- Newburgh City School District
- NCES district ID
- 3620700
- Math proficiency
- 33% ▼ -8.00%
- Reading proficiency
- 48% ▲ 10.00%
- Median HH income
- $56,387
- Composite
- 35.46/100
- National rank
- #4927
- State rank
- #500 of 590 in NY
Livability — Newburgh
- Score
- 62/100
- State rank
- #878
- US rank
- #17021
Category grades
Schools grade is shown separately in the Schools card above.
Census & demographics
- Census place
- Newburgh, NY
- County
- Orange County · 267,004 people
- City population
- 55,152
- Metro
- Poughkeepsie-Newburgh-Middletown, NY
- Population (ZIP)
- 55,152
- Household income
- $85,697
- Rent vs Own
- Severe rent burden
- 2412.0
Population outlook (Orange County) Hauer SSP2
- Today (2025)
- 379,830 people
- By 2030
- 378,955 · -0.2%
- By 2040
- 375,444 · -1.2%
- By 2050
- 369,311 · -2.8%
- By 2075
- 354,233 · -6.7%
- By 2100
- 318,150 · -16.2%
Race, ethnicity, and origin ACS 2023
- Neighborhood character
- Diverse neighborhood (Simpson 0.68)
- Race & ethnicity
- Hispanic / Latino 39% White 36% Black 20% Two or more races 12% Asian 2%
- Hispanic origin (detail)
- Mexican 14% Puerto Rican 10% Dominican 2%
- Common ancestry
- Romanian 2% Hispanic 1% Lithuanian 1%
- Foreign-born
- 18% · Canada, Dominican Republic
- Languages at home
- 64% English-only · Spanish 30% French/Haitian/Cajun 1% Other Indo-European 1%
Political lean MEDSL · Orange
- 2024 margin
- Lean R (+8.4) · D 45.8% · R 54.2%
- 2008→2024 swing
- -12.5pp toward R · 2008: 4.1pp · 2024: -8.4pp
- All cycles
- 2024: R+8.4 2020: R+0.2 2016: R+6.5 2012: D+5.2 2008: D+4.1
Not yet ingested
- Civics
- —
Market trends
- HPI YoY
- ▼ -151.93%
- Current HPI
- 304.1046
- Rent YoY
- ▲ 0.63%
- Metro
- Poughkeepsie-Newburgh-Middletown, NY
- State GDP YoY
- ▲ 2.60%
- F500 in state
- 92
Industry mix (Fortune 500 HQ in NY)
| Industry | F500 HQs | Revenue |
|---|---|---|
| Financial Services | 10 | $950B |
|
||
| Consumer Goods | 9 | $162B |
|
||
| Insurance | 4 | $225B |
|
||
| Telecommunications | 2 | $144B |
|
||
| Pharmaceuticals | 2 | $112B |
|
||
| Media / Entertainment | 2 | $69B |
|
||
Price history
+630.8% since first listed8 events — show timeline
- 2026-06-17 Coming Soon $285,000 OneKey® MLS as Distributed by MLS Grid
- 2024-10-07 Sold (Public Records) $220,000 Public Records
- 2024-10-07 Sold (Public Records) $190,000 Public Records
- 1999-02-22 Sold (MLS) $15,000 HGMLS
- 1999-01-27 Price Changed $24,900 HGMLS
- 1999-01-27 Delisted — HGMLS
- 1999-01-17 Listed $15,000 HGMLS
- 1988-05-26 Sold (Public Records) $39,000 Public Records
Property tax history
+5.1%/yrLatest (2025): $6,847 · -3.3% YoY. Source: county tax records.
Cash-flow waterfall
monthlySold comps — $/sqft
last 12 mo · ≤1 miLoading sold comps…