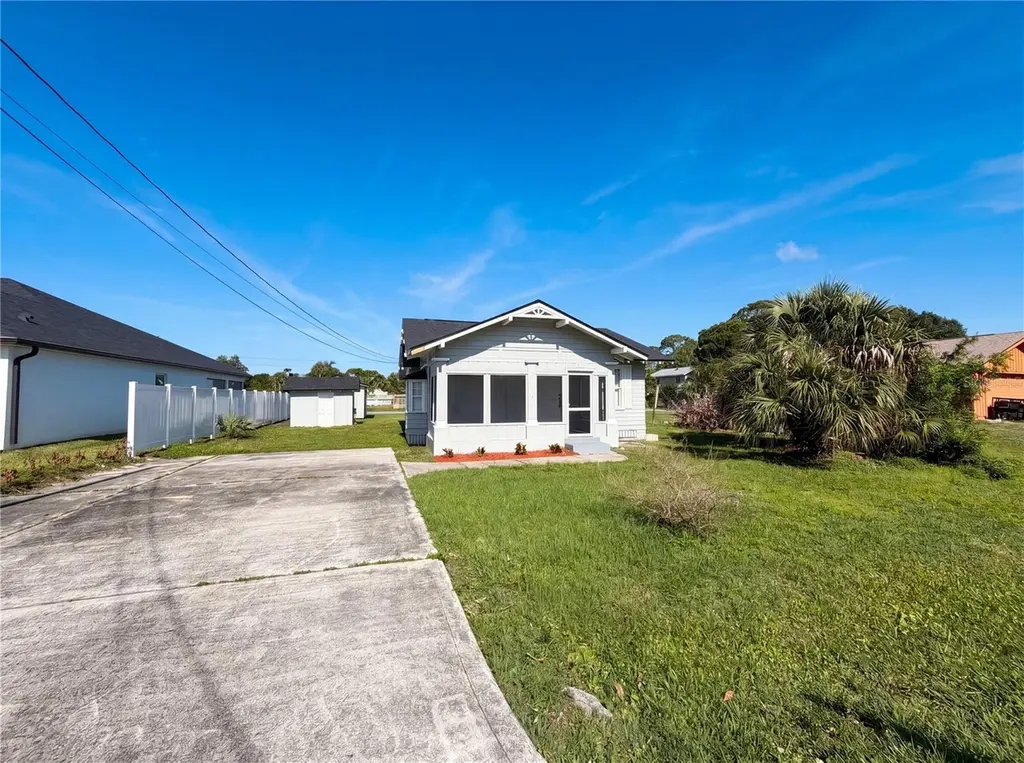
535 Palmetto Dr · Melbourne, FL
Flood risk 1/10 · Minimal
- FEMA flood zone
- X (unshaded)
- Chance of flooding over 30 yrs
- 0.0%
- Est. flood insurance / yr
- $507 – $1,088
Fire risk 1/10 · Minimal
- Est. fire insurance / yr
- $947 – $1,759
Heat risk 10/10 · Severe
- Hot days now (above 105°F)
- 7 days/yr
- Hot days in 30 yrs
- 23 days/yr
Wind risk 10/10 · Severe
- Chance of severe wind over 30 yrs
- 99.0%
Air-quality risk 1/10 · Minimal
- Unhealthy air days now
- 0 days/yr
- Unhealthy air days in 30 yrs
- 0 days/yr
Risk factors via First Street. Map © Google.
Why this score? — see what drove the D- grade
The composite is a weighted blend of 9 inputs, each scored 0–100. Each bar is that input's sub-score; the figure is the points it added to the 100-point composite (weight × sub-score).
- Cash flow +12.9/30.0
- ARV discount +7.5/15.0
- Schools +4.7/10.0
- DSCR +3.8/10.0
- 1% rule +2.6/10.0
- Rent growth +2.6/5.0
- Livability +2.5/5.0
- Condition / age +2.5/5.0
- Appreciation +0.0/10.0
$231,000
🖨 Deal sheet (PDF) 📄 Offer letter ✓ Due diligence
Listing remarks MLS
You will love this one! Doll house located in the middle of Melbourne. Home was built in 1943 but appears to have been updated throughout in recent years. Character remains, but with newer fixtures. Home has 3 bedrooms, 2 full baths, living room, dining room and indoor laundry/utility room.
Key facts
- Fresh interior paint
- Fresh exterior paint
- New roof
Tags
Property features AI
Finance
- Other: Property zoned RU-1-11; Total living area about 1457 square feet
- Financial info: Lease restrictions apply
- HOA & community: No community association fees; No community features listed
Exterior
- Parking: Driveway
- Security: Owned security system
- Utilities: Well water available; Public sewer and septic tank; Electricity available; Water available
- Home design: Single-family residence; One-story; Faces east
- Construction: Wood siding exterior; Metal roof; Slab foundation; Built on a lot of about 0.22 acres
- Exterior features: Other exterior features
Interior
- Kitchen: Range; Range hood
- Bedrooms: 3 bedrooms
- Flooring: Laminate; Tile; Wood
- Bathrooms: 2 full bathrooms
- Heating & cooling: Central heating; Central air conditioning
- Interior features: Living room and dining room combined; Electric water heater; Range; Range hood; Other kitchen appliance(s) indicated
- Laundry & utility: Dedicated laundry room; Other laundry feature(s)
Neighborhood map
What this means for you Summary
Snapshot
- This is a 2-bed/2.0-bath single-family listed at $231k.
Deal economics
- At list price, monthly cash flow is $-19 ($-223/yr) — negative.
- To cash-flow at today's rent, offer at most $228k (1.4% below list).
- To meet the 1% rule (rent ≥ 1% of price), the offer needs to be $176k (23.9% below list).
- Recommended offer: $176k (23.9% below list) — sets the bar for 1% rule.
Location & tenants
- Location reads: area grade D — affects rentability + tenant quality, not the cash-flow math above.
- Brevard (suburban): math 53% / reading 57% proficiency, ranked #19 of 73 in FL (top 26%) — acceptable for families but not a draw, mixed tenant base, ~2y average lease.
- Zoned schools: Dr. W.J. Creel Elementary School (math 38% / reading 42%, grade F, #1,491 of 2,144 statewide, top 70%, 626 students, 72% FRL); Lyndon B. Johnson Middle School (math 40% / reading 42%, grade F, #353 of 571 statewide, top 63%, 610 students, 61% FRL); Eau Gallie High School (math 20% / reading 49%, grade F, #386 of 667 statewide, top 59%, 1,586 students, 55% FRL) — zoned schools average 63% FRL vs 43% district-wide (20 pts higher); higher-poverty schools than district average — tighter screening recommended.
- Zoned-school proficiency averages 38% at this address vs 55% district-wide (-16 pts) — the specific schools serving this property underperform the Brevard average; the district grade overstates school quality for this exact location.
- Market conditions: Rents flat; 335 active listings in the ZIP; 40 comparable units currently listed for rent nearby; rentals at typical pace (median 25d on market — plan ~3-4 weeks tenant-placement turnaround); 4,602 units permitted in Brevard County in 2024 (702 in 5+ unit buildings).
- This rent runs 33% of the median local income ($65k/yr) — at the standard rent-burdened threshold; future hikes will face affordability resistance.
Forward outlook
- Local home prices are declining (-3.0%/yr); year-one equity from $2k of loan paydown is wiped out by about $7k of value loss. Plan a longer hold.
- Brevard County population projected at +15% by 2050 — modest demand growth; plan on rents tracking national, not racing it.
Negotiation context
- Only 12 days on market — expect competitive offers; lowballing is unlikely to land.
- 2 sale attempts since 15y ago with the ask held roughly flat each time — persistent listings suggest the price (not the market) is what's stuck; bring a comps-based counter.
Risks & watch-outs
- Watch-outs: built in 1943 — expect roof / HVAC / electrical / plumbing capex.
- Climate carrying-cost: severe wind risk, 99% chance of damaging wind over 30y; extreme-heat days projected 7→23/yr by 2055 (HVAC capex compounding) — expect insurance premiums to compound above CPI over the hold.
Questions for the listing agent
- What do current leases actually rent for vs. the listed asking? Can we see a recent rent roll and the last 12 months of T-12 income?
- Built in 1943 — when were the roof, HVAC, electrical panel, plumbing, and water heater last replaced?
- Is there a deadline driving the sale (1031 exchange, divorce, estate, relocation)? That informs how much negotiation room exists.
- The area grade is low — what's the realistic commute time and amenity access for the typical tenant pool here? Any planned neighborhood developments (good or bad) we should know about?
- What's the average days-on-market for RENTAL listings here right now (not sales)? A rising rental-DOM trend means longer vacancies and softer asking-rent achievability than the comps imply.
- What's the recent tenant-quality profile in this submarket — average credit score on applications, eviction rate, late-payment / NSF rate, and stable-employment percentage? A property-management company in the area should have these aggregated.
- How much new for-sale + rental construction is in the pipeline within 1–3 miles? Heavy new supply typically softens prices + rents 12–24 months out; constrained supply supports both.
Investment metrics
- 1% rule
- 0.76% ✗
- Cap rate
- 6.20%
- Cash-on-cash
- -0.35%
- DSCR
- 0.98
- GRM
- 11.0
CMA / ARV
No comps found within radius.
Projected returns pro-forma
-3.0% appreciation · 0.53% rent growth · sell at horizon
- IRR
- -19.4%
- Equity multiple
- 0.34×
- Total profit
- $-42,970
- Equity at exit
- $34,443
- IRR
- -17.5%
- Equity multiple
- 0.13×
- Total profit
- $-55,958
- Equity at exit
- $19,973
Cash invested: $64,680 (down + closing). Projections, not guarantees.
Landlord ↔ Tenant lean methodology
- Overall (STATE)
- 87 Strongly Landlord-Friendly
- State Florida
- 87 Strongly Landlord-Friendly · R+3
- County
- — inherits STATE
- City
- — inherits STATE
ZIP-level market 32935
- Rents YoY
- 0.5%
- Active inventory
- 335
- Price-to-rent
- 11.0×
Monthly cashflow live
- Estimated rent
- $1,758 high interval (Pro) →
- Mortgage (P&I)
- −$1,211
- Tax from tax record
- −$100 /mo · $1,195/yr
- Insurance
- −$96
- HOA
- −$0
- Vacancy / Maint / Mgmt
- −$369
- Net cashflow
- $-19
Break-even live
Sensitivity live
| Price | -10% $112 | -5% $47 | +0% $-19 | +5% $-84 | +10% $-149 |
|---|---|---|---|---|---|
| Rent | -10% $-157 | -5% $-88 | +0% $-19 | +5% $51 | +10% $120 |
| Rate | -1.0pp $98 | -0.5pp $40 | base $-19 | +0.5pp $-78 | +1.0pp $-139 |
UW: 25.0% down · 7.5% · 30yr · 1.5% tax · 5.0% vac · 8.0% maint · 8.0% mgmt
Financing live
Cash to close
- Down payment
- $57,750
- Closing costs
- $6,930
- Reserves months
- —
- Total cash needed
- —
Loan-product check · same deal, 3 products live
Conventional
25% down · 7.5% · 30yr
- Down + closing
- —
- Monthly P&I
- —
- Monthly cashflow
- —
- DSCR
- —
- Eligible?
- —
Personal DTI + credit; lowest rate.
DSCR
20% down · 8.5% · 30yr
- Down + closing
- —
- Monthly P&I
- —
- Monthly cashflow
- —
- DSCR
- —
- Eligible?
- —
No personal income docs; deal must DSCR.
Hard money
10% down · 12.0% · 12mo
- Down + closing
- —
- Monthly P&I
- —
- Monthly cashflow
- —
- DSCR
- —
- Eligible?
- —
Short-term bridge; refi at stabilization.
Rent comps 40 comps
| Address | Beds | Baths | Sqft | Rent | $/sqft | DOM | Units | Dist |
|---|---|---|---|---|---|---|---|---|
| 109 San Juan Cir Melbourne, FL | 2.0 | 1.0 | 955 | $1,400 | $1.47 | 23d | 1 | 0.26mi |
| 2173 Stewart Rd Melbourne, FL | 2.0 | 1.5 | 1450 | $1,700 | $1.17 | 16d | 1 | 0.31mi |
| 196 San Juan Cir Melbourne, FL | 2.0 | 1.0 | 955 | $1,400 | $1.47 | 25d | 1 | 0.34mi |
| 2082 Foxwood Dr Melbourne, FL | 2.0 | 2.0 | 975 | $1,600 | $1.64 | 16d | 1 | 0.39mi |
| 1909 Oakwood Dr Melbourne, FL | 3.0 | 2.0 | 1351 | $2,400 | $1.78 | 16d | 1 | 0.40mi |
| 2153 Royal Poinciana Blvd Melbourne, FL | 3.0 | 2.5 | 1732 | $2,600 | $1.50 | 25d | 1 | 0.43mi |
| 1430 Isabella Dr #102 Melbourne, FL | 3.0 | 2.5 | 1510 | $2,250 | $1.49 | 25d | 1 | 0.50mi |
| 1455 Isabella Dr #101 Melbourne, FL | 3.0 | 2.5 | 1606 | $2,275 | $1.42 | 25d | 1 | 0.52mi |
| 2146 Sandalwood Dr Melbourne, FL | 3.0 | 2.0 | 1320 | $1,910 | $1.45 | 25d | 1 | 0.54mi |
| 2242 Flower Tree Cir Melbourne, FL | 2.0 | 2.0 | 879 | $1,300 | $1.48 | 25d | 1 | 0.56mi |
| 1252 Ridgewood Dr Melbourne, FL | 3.0 | 2.0 | 1114 | $1,785 | $1.60 | 21d | 1 | 0.62mi |
| 1795 Kole Pl #109 Melbourne, FL | 3.0 | 2.5 | 1472 | $1,950 | $1.32 | 25d | 1 | 0.62mi |
| 2414 Summerset Dr Melbourne, FL | 2.0 | 2.0 | 1065 | $1,450 | $1.36 | 25d | 1 | 0.64mi |
| 188 Berkshire Ln Melbourne, FL | 3.0 | 2.0 | 1094 | $1,750 | $1.60 | 21d | 1 | 0.73mi |
| 2745 Revolution St #101 Melbourne, FL | 3.0 | 2.5 | 1694 | $2,500 | $1.48 | 25d | 1 | 0.74mi |
| 177 Ulster Ln Melbourne, FL | 2.0 | 2.0 | 890 | $1,300 | $1.46 | 25d | 1 | 0.77mi |
| 181 Ulster Ln Melbourne, FL | 2.0 | 2.0 | 890 | $1,400 | $1.57 | 25d | 1 | 0.77mi |
| 254 Ulster Ln Melbourne, FL | 3.0 | 2.0 | 1094 | $1,600 | $1.46 | 15d | 1 | 0.82mi |
| 280 Ulster Ln Melbourne, FL | 3.0 | 2.0 | 1094 | $1,600 | $1.46 | 25d | 1 | 0.83mi |
| 217 Bristol Ln Melbourne, FL | 2.0 | 2.0 | 890 | $1,395 | $1.57 | 25d | 1 | 0.84mi |
| 189 Cambridge Ln Melbourne, FL | 3.0 | 2.0 | 1094 | $1,600 | $1.46 | 25d | 1 | 0.85mi |
| 2660 Revolution St #106 Melbourne, FL | 3.0 | 2.5 | 1694 | $1,950 | $1.15 | 25d | 1 | 0.88mi |
| 2420 Central Park Dr Melbourne, FL | 1.0–3.0 | 1.0–2.0 | 1045 | $1,799 | $1.72 | 15d | 11 | 0.89mi |
| 2504 Bogey Ln Apt C Melbourne, FL | 2.0 | 2.0 | 1002 | $1,500 | $1.50 | 25d | 1 | 0.96mi |
| 2700 Croton Rd Melbourne, FL | 1.0–2.0 | 1.0–2.0 | 870 | $1,675 | $1.93 | 16d | 1 | 0.99mi |
| 2362 Pineapple Ave Unit 1520582P Melbourne, FL | 3.0 | 2.0 | 1194 | $5,629 | $4.71 | 16d | 1 | 1.06mi |
| 2323 Golf Lake Cir #1111 Melbourne, FL | 2.0 | 2.0 | 1140 | $1,600 | $1.40 | 21d | 1 | 1.11mi |
| 2201 Hampton Greens Blvd Melbourne, FL | 1.0–3.0 | 1.0–2.0 | 900 | $1,742 | $1.94 | 15d | 10 | 1.12mi |
| 1688 Eisenhower Ave Melbourne, FL | 3.0 | 1.5 | 988 | $1,700 | $1.72 | 25d | 1 | 1.13mi |
| 1727 Avocado Ave Unit 6 Melbourne, FL | 2.0 | 1.0 | 900 | $1,425 | $1.58 | 25d | 1 | 1.16mi |
| 1727 Avocado Ave #8 Melbourne, FL | 2.0 | 1.0 | 900 | $1,475 | $1.64 | 25d | 1 | 1.16mi |
| 1805 Guava Ave Melbourne, FL | 2.0 | 1.0 | 896 | $1,600 | $1.79 | 16d | 1 | 1.16mi |
| 1032 Hidden Harbour Dr Melbourne, FL | 1.0 | 1.0 | 921 | $1,249 | $1.36 | 25d | 1 | 1.19mi |
| 1821 Highland Ave Melbourne, FL | 2.0 | 1.0 | 900 | $1,650 | $1.83 | 25d | 1 | 1.21mi |
| 1811 Highland Ave Melbourne, FL | 2.0 | 1.0 | 900 | $1,650 | $1.83 | 25d | 1 | 1.22mi |
| 1868 Pineapple Ave Melbourne, FL | 2.0 | 1.0 | 1000 | $1,750 | $1.75 | 25d | 1 | 1.23mi |
| 1809 Highland Ave Melbourne, FL | 2.0 | 1.0 | 900 | $1,650 | $1.83 | 25d | 1 | 1.23mi |
| 693 Law St Unit B Melbourne, FL | 3.0 | 1.0 | 1200 | $1,950 | $1.62 | 25d | 1 | 1.28mi |
| 2137 Laden Rd Melbourne, FL | 3.0 | 2.0 | 1248 | $2,100 | $1.68 | 25d | 1 | 1.32mi |
| 3051 Savannah Way Melbourne, FL | 1.0–2.0 | 1.0–2.0 | 927 | $1,689 | $1.82 | 15d | 26 | 1.32mi |
Listing history 8 events
-
2026-05-19status Pending
-
2026-05-07$231,000 Active
-
2026-04-03soldstatus $202,700
-
2011-11-07soldstatus $60,000 291-char remark
Show marketing remark (291 chars)
You will love this one! Doll house located in the middle of Melbourne. Home was built in 1943 but appears to have been updated throughout in recent years. Character remains, but with newer fixtures. Home has 3 bedrooms, 2 full baths, living room, dining room and indoor laundry/utility room.
-
2011-09-02$54,900 291-char remark
Show marketing remark (291 chars)
You will love this one! Doll house located in the middle of Melbourne. Home was built in 1943 but appears to have been updated throughout in recent years. Character remains, but with newer fixtures. Home has 3 bedrooms, 2 full baths, living room, dining room and indoor laundry/utility room.
-
1994-04-01soldstatus $34,000
-
1986-01-01soldstatus $40,000
-
1978-10-01soldstatus $24,500
ⓘ Source: listings_history table (triggers on properties + properties_extension) + one-shot
backfill from property_details.listing_events for pre-trigger history.
Tax reassessment forecast FL · Resets to sale price
- Current annual tax
- $1,195 · $100/mo
- Projected year-2 tax
- $1,917 · $160/mo
- Expected delta
- +$723/yr (+$60/mo · 60.5%)
ⓘ Screening estimate from a state-policy table — verify with the county assessor before closing.
Climate risk First Street
- Flood 1/10 Low FEMA zone X (unshaded) · 0% chance over 30 yrs
- Wildfire 1/10 Low
- Heat 10/10 Extreme 7 d/yr ≥105°F today · 23 d/yr by 30 yrs out
- Wind 10/10 Extreme 99% chance of damaging wind over 30 yrs
- Air quality 1/10 Low 0 unhealthy d/yr today · 0 by 30 yrs out
Nearby sold comps map
Loading sold comps map…
Walkable amenities ~0.75 mi
Loading nearby amenities…
Taxation est. · year 1
- Rental income
- $21,092
- − Mortgage interest
- −$12,940
- − Property taxes
- −$1,195
- − Insurance
- −$1,155
- − Repairs & maintenance
- −$1,687
- − Management
- −$1,687
- − Depreciation
- −$6,720
- Taxable loss
- −$4,292
- Est. tax savings @ 24.0%
- +$1,030
- After-tax cash flow
- $807/yr
For passive investors: Depreciation is non-cash, so a rental often shows a tax loss while cash-flowing — sheltering income. Rental losses are passive: they offset passive income freely, and up to $25,000/yr can offset ordinary (W-2) income if you actively participate and your MAGI is under $100k (phasing out to $0 by $150k); unused losses carry forward. On sale, claimed depreciation is recaptured at up to 25%, and gains may owe capital-gains tax (a 1031 exchange can defer both). Figures are a year-1 estimate at your 24.0% rate — not tax advice; consult a CPA.
Schools (NCES district)
- District
- Brevard
- NCES district ID
- 1200150
- Math proficiency
- 53% ▼ -9.00%
- Reading proficiency
- 57% ▼ -4.00%
- Median HH income
- $49,426
- Composite
- 46.86/100
- National rank
- #2370
- State rank
- #19 of 73 in FL
Livability — Melbourne
No livability data for this city. (Only ~50 U.S. cities are tracked.)
Census & demographics
- County
- Brevard County · 602,871 people
- City population
- 178,420
- Metro
- Palm Bay-Melbourne-Titusville, FL
- Population (ZIP)
- 41,965
- Household income
- $64,588
- Rent vs Own
- Severe rent burden
- 1747.0
Population outlook (Brevard County) Hauer SSP2
- Today (2025)
- 623,254 people
- By 2030
- 648,420 · +4.0%
- By 2040
- 690,009 · +10.7%
- By 2050
- 715,669 · +14.8%
- By 2075
- 775,744 · +24.5%
- By 2100
- 776,687 · +24.6%
Race, ethnicity, and origin ACS 2023
- Neighborhood character
- Predominantly White (74%)
- Race & ethnicity
- White 74% Hispanic / Latino 13% Two or more races 9% Black 5% Asian 2%
- Hispanic origin (detail)
- Mexican 3% Puerto Rican 5%
- Common ancestry
- Slovak 2% Romanian 2% Lithuanian 2%
- Foreign-born
- 9% · Canada, Vietnam, Jamaica
- Languages at home
- 88% English-only · Spanish 8% Other Indo-European 1% Tagalog/Filipino 1%
Political lean MEDSL · Brevard
- 2024 margin
- Strong R (+20.8) · D 39.1% · R 59.9% · Other 1.0%
- 2008→2024 swing
- -10.4pp toward R · 2008: -10.4pp · 2024: -20.8pp
- All cycles
- 2024: R+20.8 2020: R+16.4 2016: R+19.8 2012: R+12.7 2008: R+10.4
Not yet ingested
- Civics
- —
Market trends
- HPI YoY
- ▼ -185.48%
- Current HPI
- 308.7443
- Rent YoY
- ▲ 0.53%
- Metro
- Palm Bay-Melbourne-Titusville, FL
- State GDP YoY
- ▲ 3.28%
- F500 in state
- 36
Industry mix (Fortune 500 HQ in FL)
| Industry | F500 HQs | Revenue |
|---|---|---|
| Industrial Technology | 2 | $29B |
|
||
| Insurance | 2 | $17B |
|
||
| Retail | 1 | $60B |
|
||
| Technology Distribution | 1 | $58B |
|
||
| Homebuilding | 1 | $35B |
|
||
| Technology Manufacturing | 1 | $35B |
|
||
Price history
+842.9% since first listed8 events — show timeline
- 2026-05-19 Pending — Stellar MLS as Distributed by MLS Grid
- 2026-05-07 Listed $231,000 Stellar MLS as Distributed by MLS Grid
- 2026-04-03 Sold (Public Records) $202,700 Public Records
- 2011-11-07 Sold (MLS) $60,000 SCMLS
- 2011-09-02 Listed $54,900 SCMLS
- 1994-04-01 Sold (Public Records) $34,000 Public Records
- 1986-01-01 Sold (Public Records) $40,000 Public Records
- 1978-10-01 Sold (Public Records) $24,500 Public Records
Property tax history
+2.9%/yrLatest (2025): $1,195 · +12.0% YoY. Source: county tax records.
Cash-flow waterfall
monthlySold comps — $/sqft
last 12 mo · ≤1 miLoading sold comps…