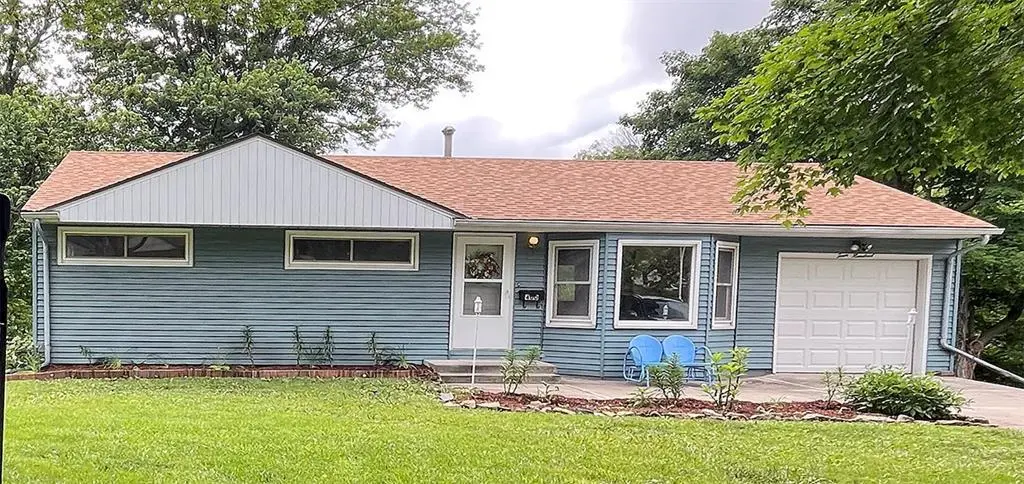
400 Lacy Ln · Belton, MO
Flood risk 1/10 · Minimal
- FEMA flood zone
- X (unshaded)
- Chance of flooding over 30 yrs
- 0.0%
- Est. flood insurance / yr
- $473 – $860
Fire risk 2/10 · Minimal
- Est. fire insurance / yr
- $1,054 – $1,958
Heat risk 3/10 · Minor
- Hot days now (above 107°F)
- 7 days/yr
- Hot days in 30 yrs
- 16 days/yr
Wind risk 2/10 · Minimal
- Chance of severe wind over 30 yrs
- —
Air-quality risk 2/10 · Minimal
- Unhealthy air days now
- 2 days/yr
- Unhealthy air days in 30 yrs
- 2 days/yr
Risk factors via First Street. Map © Google.
Why this score? — see what drove the C+ grade
The composite is a weighted blend of 9 inputs, each scored 0–100. Each bar is that input's sub-score; the figure is the points it added to the 100-point composite (weight × sub-score).
- Cash flow +21.1/30.0
- ARV discount +15.0/15.0
- DSCR +6.7/10.0
- 1% rule +4.7/10.0
- Rent growth +3.8/5.0
- Livability +3.8/5.0
- Schools +3.0/10.0
- Condition / age +2.5/5.0
- Appreciation +0.0/10.0
$205,000
🖨 Deal sheet 📄 Offer letter ✓ Due diligence
Listing remarks MLS
One Owner, Exceptionally well maintained. Steel Siding, Thermal Windows, Updated Kitchen & Bath. Has a large non-conforming 3rd bedroom in the basement. Main level study off Living Room. Walkout basement. Seller added inside stairway to access the finished basement, w/ family room, full bath as well as n/c bedroom. Freshly painted interior. Ready to move right in. Backs up to the woods for privacy. Great for 1st time home buyers or empty nesters. Get in on the tax credit incentive.
Key facts
- 8,668 sq ft lot
- Garage
- Built 1958
Property features AI
Finance
- Other: Seller provides home warranty through A B May
Exterior
- Parking: Attached garage facing front; 1-car garage
- Utilities: Public water; Public sewer
- Home design: Single-family residential; Ranch floor plan; Living area approximately 1,300 square feet; Above-grade and below-grade finished living space (public/agent sources)
- Construction: Metal siding; Composition roof; Basement: finished, concrete, walk-out access, basement bedroom, sump pump; Age: 51–75 years
- Exterior features: Patio; Outbuilding; Corner lot adjoining greenspace
Interior
- Kitchen: Dishwasher; Disposal; Microwave; Refrigerator; Electric range; Under-cabinet appliances; Pantry (kitchen/dining combo)
- Bedrooms: Main floor primary bedroom; Bedroom 1 on main level with wood flooring; Bedroom 2 on main level with wood flooring; Bedroom 3 on lower level
- Flooring: Wood flooring in main-level bedrooms; Concrete flooring; Vinyl in bathrooms
- Bathrooms: Two full bathrooms; Main level bathroom with vinyl flooring; Lower level bathroom with vinyl flooring
- Heating & cooling: Forced air heating; Electric cooling (central)
- Interior features: Ceiling fans; Pantry; Window coverings; Thermal windows; Storm door(s)
- Laundry & utility: Washer; Dryer; Laundry room in basement; Humidifier
Neighborhood map
What this means for you Summary
Snapshot
- This is a 3-bed/2.0-bath single-family listed at $205k.
Deal economics
- At list price, monthly cash flow is $293 ($4k/yr) — positive.
- The deal already cash-flows at list — no discount required.
- To meet the 1% rule (rent ≥ 1% of price), the offer needs to be $199k (2.8% below list).
- Recommended offer: $199k (2.8% below list) — sets the bar for 1% rule.
- Cap rate 8.0% vs local median 4.7% in Belton — top-decile yield for the area; either an underpriced asset or a hidden risk that comps aren't pricing in. Stress-test before assuming the spread holds.
Location & tenants
- Location reads 76/100 on livability (#52 in MO, #3,782 nationally) — a middle-class / working-renter tenant base. Strengths: cost of living A+, housing A+, health & safety A+; Watch: crime C-, commute F.
- Belton 124 (suburban): math 28% / reading 39% proficiency, ranked #216 of 324 in MO (top 67%) — families likely to look elsewhere, expect single-tenant / working-renter base with shorter leases.
- Zoned schools: Wilckens Steam Acad @Hillcrest (math 44% / reading 47%, grade D-, #405 of 1,115 statewide, top 37%, 474 students, 37% FRL); Belton High (math 27% / reading 59%, grade F, #211 of 521 statewide, top 41%, 1,374 students, 42% FRL).
- Market conditions: Rents rising fast (+5.2%/yr); 204 active listings in the ZIP; 15 comparable units currently listed for rent nearby; rentals leasing fast (median 12d on market — plan ~1-2 weeks tenant-placement turnaround); 588 units permitted in Cass County in 2024 (0 in 5+ unit buildings).
- This rent runs 33% of the median local income ($72k/yr) — at the standard rent-burdened threshold; future hikes will face affordability resistance.
Forward outlook
- Local home prices are declining (-3.0%/yr); year-one equity from $1k of loan paydown is wiped out by about $6k of value loss. Plan a longer hold.
- Cass County population projected to shrink 3% by 2050 — rents likely to lag national; underwrite the cash flow, not the appreciation.
Negotiation context
- Only 2 days on market — expect competitive offers; lowballing is unlikely to land.
Risks & watch-outs
- Watch-outs: built in 1958 — expect roof / HVAC / electrical / plumbing capex.
Questions for the listing agent
- Built in 1958 — when were the roof, HVAC, electrical panel, plumbing, and water heater last replaced?
- Is there a deadline driving the sale (1031 exchange, divorce, estate, relocation)? That informs how much negotiation room exists.
- Schools are D-rated, which usually means shorter tenancies and higher turnover. Who's the typical renter profile here, and what's been the actual vacancy rate?
- What's the average days-on-market for RENTAL listings here right now (not sales)? A rising rental-DOM trend means longer vacancies and softer asking-rent achievability than the comps imply.
- What's the recent tenant-quality profile in this submarket — average credit score on applications, eviction rate, late-payment / NSF rate, and stable-employment percentage? A property-management company in the area should have these aggregated.
- How much new for-sale + rental construction is in the pipeline within 1–3 miles? Heavy new supply typically softens prices + rents 12–24 months out; constrained supply supports both.
Investment metrics
- 1% rule
- 0.97% ✗
- Cap rate
- 8.01%
- Cash-on-cash
- 6.12%
- DSCR
- 1.27
- GRM
- 8.6
CMA / ARV
- ARV (on-the-fly)
- $278,832
- Comps found
- 12
Show comp detail 12 sales within ~0.75 mi
| Address | Dist | Beds/Ba | Sqft | Sold | Price | $/sf | Match |
|---|---|---|---|---|---|---|---|
| 506 Mill Ct | 0.31mi | 3/2.0 | 1,756 (-1%) | 3mo | $275,000 | $157 | 82 |
| 118 Mill St | 0.30mi | 3/1.5 | 1,698 (-4%) | 3mo | $225,000 | $133 | 74 |
| 303 W Sunrise Dr | 0.19mi | 3/3.0 | 1,682 (-5%) | 6mo | $235,000 | $140 | 73 |
| 613 Colbern St | 0.42mi | 3/2.0 | 1,686 (-5%) | 8mo | $175,000 | $104 | 65 |
| 522 Hargis Ln | 0.74mi | 3/2.0 | 1,776 (0%) | 4mo | $265,000 | $149 | 62 |
| 500 Stacey Dr | 0.57mi | 3/2.0 | 1,613 (-9%) | 3mo | $290,000 | $180 | 56 |
| 301 Hargis Ln | 0.70mi | 4/2.0 (+1) | 1,704 (-4%) | 1mo | $295,000 | $173 | 54 |
| 404 Hillcrest Cir | 0.50mi | 4/2.5 (+1) | 1,920 (+8%) | 4mo | $330,000 | $172 | 53 |
| 515 2nd St | 0.56mi | 3/2.0 | 1,550 (-13%) | 7mo | $210,000 | $135 | 47 |
| 517 Stacey Dr | 0.59mi | 4/3.0 (+1) | 1,982 (+12%) | 1mo | $315,000 | $159 | 43 |
| 414 W 179th Ter | 0.68mi | 3/3.0 | 2,000 (+13%) | 2mo | $360,000 | $180 | 42 |
| 203 Monroe Ave | 0.73mi | 4/3.0 (+1) | 2,040 (+15%) | 6mo | $310,000 | $152 | 27 |
Match score weights: distance 35% · size 25% · config 20% · recency 20%. Top-matched comps best support the ARV.
Projected returns pro-forma
-3.0% appreciation · 5.17% rent growth · sell at horizon
- IRR
- -4.7%
- Equity multiple
- 0.82×
- Total profit
- $-10,194
- Equity at exit
- $30,566
- IRR
- 7.2%
- Equity multiple
- 1.59×
- Total profit
- $33,963
- Equity at exit
- $17,725
Cash invested: $57,400 (down + closing). Projections, not guarantees.
Landlord ↔ Tenant lean methodology
- Overall (STATE)
- 81 Strongly Landlord-Friendly
- State Missouri
- 81 Strongly Landlord-Friendly · R+10
- County
- — inherits STATE
- City
- — inherits STATE
ZIP-level market 64012
- Rents YoY
- 5.2%
- Active inventory
- 204
- Price-to-rent
- 8.6×
Monthly cashflow live
- Estimated rent
- $1,992 high interval (Pro) →
- Mortgage (P&I)
- −$1,075
- Tax from tax record
- −$121 /mo · $1,446/yr
- Insurance
- −$85
- HOA
- −$0
- Vacancy / Maint / Mgmt
- −$418
- Net cashflow
- $293
Break-even live
UW: 25.0% down · 7.5% · 30yr · 1.5% tax · 5.0% vac · 8.0% maint · 8.0% mgmt
Financing live
Cash to close
- Down payment
- $51,250
- Closing costs
- $6,150
- Reserves months
- —
- Total cash needed
- —
Loan-product check · same deal, 3 products live
Conventional
25% down · 7.5% · 30yr
- Down + closing
- —
- Monthly P&I
- —
- Monthly cashflow
- —
- DSCR
- —
- Eligible?
- —
Personal DTI + credit; lowest rate.
DSCR
20% down · 8.5% · 30yr
- Down + closing
- —
- Monthly P&I
- —
- Monthly cashflow
- —
- DSCR
- —
- Eligible?
- —
No personal income docs; deal must DSCR.
Hard money
10% down · 12.0% · 12mo
- Down + closing
- —
- Monthly P&I
- —
- Monthly cashflow
- —
- DSCR
- —
- Eligible?
- —
Short-term bridge; refi at stabilization.
Rent comps 15 comps
| Address | Beds | Baths | Sqft | Rent | $/sqft | DOM | Units | Dist |
|---|---|---|---|---|---|---|---|---|
| 401 Lacy Ln Belton, MO | 4.0 | 2.0 | 1225 | $1,750 | $1.43 | 7d | 1 | 0.04mi |
| 214 Lacy Ln Belton, MO | 3.0 | 2.5 | 2562 | $2,455 | $0.96 | 21d | 1 | 0.13mi |
| 412 Colbern St Belton, MO | 2.0 | 1.0 | 1516 | $1,395 | $0.92 | 23d | 1 | 0.26mi |
| 611 W Sunrise Dr Belton, MO | 3.0 | 2.5 | 1496 | $1,990 | $1.33 | 7d | 1 | 0.33mi |
| 117 Monroe Ave Belton, MO | 3.0 | 2.5 | 1972 | $1,950 | $0.99 | 7d | 1 | 0.69mi |
| 909 Ridge Dr Belton, MO | 3.0 | 2.0 | 1539 | $1,756 | $1.14 | 20d | 1 | 0.74mi |
| 161 Rainbow Dr Belton, MO | 3.0 | 2.0 | 1624 | $1,478 | $0.91 | 23d | 1 | 1.06mi |
| 805 Emerson Dr Belton, MO | 4.0 | 3.0 | 1942 | $2,355 | $1.21 | 12d | 1 | 1.10mi |
| 17417 Montgall Dr Belton, MO | 4.0 | 2.0 | 2105 | $2,115 | $1.00 | 23d | 1 | 1.28mi |
| 211 Apple Blossom Ln Belton, MO | 4.0 | 2.5 | 1414 | $2,066 | $1.46 | 1d | 1 | 1.32mi |
| 610 Winter Dr Belton, MO | 4.0 | 3.0 | 1959 | $2,673 | $1.36 | 23d | 1 | 1.32mi |
| 307 Dauphine St Belton, MO | 3.0 | 2.0 | 1225 | $1,495 | $1.22 | 23d | 1 | 1.38mi |
| 209 W 162nd Ter Belton, MO | 3.0 | 2.5 | 1325 | $1,565 | $1.18 | 2d | 1 | 1.39mi |
| 834 Autumn Woods Dr VLG LOCH LOYD, MO | 3.0 | 2.5 | 1325 | $1,730 | $1.31 | 1d | 4 | 1.45mi |
| 301 Towne Center Dr Belton, MO | 1.0–2.0 | 1.0–2.0 | 1069 | $1,799 | $1.68 | 1d | 9 | 1.48mi |
Listing history 5 events
-
2026-05-31status $205,000 Pending 2 DOM
-
2026-05-23historical $205,000
-
2010-03-10soldstatus 542-char remark
Show marketing remark (542 chars)
One Owner, Exceptionally well maintained. Steel Siding, Thermal Windows, Updated Kitchen & Bath. Has a large non-conforming 3rd bedroom in the basement. Main level study off Living Room. Walkout basement. Seller added inside stairway to access the finished basement, w/ family room, full bath as well as n/c bedroom. Freshly painted interior. Ready to move right in. Backs up to the woods for privacy. Great for 1st time home buyers or empty nesters. Get in on the tax credit incentive.
-
2010-03-10soldstatus
Show marketing remark (542 chars)
One Owner, Exceptionally well maintained. Steel Siding, Thermal Windows, Updated Kitchen & Bath. Has a large non-conforming 3rd bedroom in the basement. Main level study off Living Room. Walkout basement. Seller added inside stairway to access the finished basement, w/ family room, full bath as well as n/c bedroom. Freshly painted interior. Ready to move right in. Backs up to the woods for privacy. Great for 1st time home buyers or empty nesters. Get in on the tax credit incentive.
-
2010-01-25$97,500 542-char remark
Show marketing remark (542 chars)
One Owner, Exceptionally well maintained. Steel Siding, Thermal Windows, Updated Kitchen & Bath. Has a large non-conforming 3rd bedroom in the basement. Main level study off Living Room. Walkout basement. Seller added inside stairway to access the finished basement, w/ family room, full bath as well as n/c bedroom. Freshly painted interior. Ready to move right in. Backs up to the woods for privacy. Great for 1st time home buyers or empty nesters. Get in on the tax credit incentive.
ⓘ Source: listings_history table (triggers on properties + properties_extension) + one-shot
backfill from property_details.listing_events for pre-trigger history.
Tax reassessment forecast MO · Resets to sale price
- Current annual tax
- $1,446 · $121/mo
- Projected year-2 tax
- $1,988 · $166/mo
- Expected delta
- +$542/yr (+$45/mo · 37.5%)
ⓘ Screening estimate from a state-policy table — verify with the county assessor before closing.
Climate risk First Street
- Flood 1/10 Low FEMA zone X (unshaded) · 0% chance over 30 yrs
- Wildfire 2/10 Low
- Heat 3/10 Moderate 7 d/yr ≥107°F today · 16 d/yr by 30 yrs out
- Wind 2/10 Low
- Air quality 2/10 Low 2 unhealthy d/yr today · 2 by 30 yrs out
Nearby sold comps map
Loading sold comps map…
Walkable amenities ~0.75 mi
Loading nearby amenities…
Taxation est. · year 1
- Rental income
- $23,903
- − Mortgage interest
- −$11,483
- − Property taxes
- −$1,446
- − Insurance
- −$1,025
- − Repairs & maintenance
- −$1,912
- − Management
- −$1,912
- − Depreciation
- −$5,964
- Taxable income
- $160
- Est. tax owed @ 24.0%
- −$38
- After-tax cash flow
- $3,473/yr
For passive investors: Depreciation is non-cash, so a rental often shows a tax loss while cash-flowing — sheltering income. Rental losses are passive: they offset passive income freely, and up to $25,000/yr can offset ordinary (W-2) income if you actively participate and your MAGI is under $100k (phasing out to $0 by $150k); unused losses carry forward. On sale, claimed depreciation is recaptured at up to 25%, and gains may owe capital-gains tax (a 1031 exchange can defer both). Figures are a year-1 estimate at your 24.0% rate — not tax advice; consult a CPA.
Schools (NCES district)
- District
- Belton 124
- NCES district ID
- 2904620
- Math proficiency
- 28% ▼ -9.00%
- Reading proficiency
- 39% ▼ -9.00%
- Median HH income
- $56,946
- Composite
- 29.73/100
- National rank
- #6446
- State rank
- #216 of 324 in MO
Livability — Belton
- Score
- 76/100
- State rank
- #52
- US rank
- #3782
Category grades
Schools grade is shown separately in the Schools card above.
Census & demographics
- Census place
- Belton, MO
- County
- Cass County · 65,358 people
- City population
- 29,304
- Metro
- Kansas City, MO-KS
- Population (ZIP)
- 29,304
- Household income
- $71,814
- Rent vs Own
- Severe rent burden
- 1081.0
Population outlook (Cass County) Hauer SSP2
- Today (2025)
- 105,292 people
- By 2030
- 106,109 · +0.8%
- By 2040
- 105,786 · +0.5%
- By 2050
- 102,062 · -3.1%
- By 2075
- 88,569 · -15.9%
- By 2100
- 68,293 · -35.1%
Race, ethnicity, and origin ACS 2023
- Neighborhood character
- Predominantly White (80%)
- Race & ethnicity
- White 80% Two or more races 7% Hispanic / Latino 7% Black 6% Asian 1%
- Hispanic origin (detail)
- Mexican 5%
- Common ancestry
- Italian 2% Lithuanian 2% Portuguese 2%
- Foreign-born
- 2% · Canada
- Languages at home
- 96% English-only · Spanish 2% German/W. Germanic 1% Other Asian/Pacific 1%
Political lean MEDSL · Cass
- 2024 margin
- Solid R (+32.1) · D 33.3% · R 65.4% · Other 1.3%
- 2008→2024 swing
- -12.5pp toward R · 2008: -19.6pp · 2024: -32.1pp
- All cycles
- 2024: R+32.1 2020: R+31.6 2016: R+35.9 2012: R+28.4 2008: R+19.6
Not yet ingested
- Civics
- —
Market trends
- HPI YoY
- ▼ -244.76%
- Current HPI
- 214.6157
- Rent YoY
- ▲ 5.17%
- Metro
- Kansas City, MO-KS
- State GDP YoY
- ▲ 1.84%
- F500 in state
- 20
Industry mix (Fortune 500 HQ in MO)
| Industry | F500 HQs | Revenue |
|---|---|---|
| Healthcare | 1 | $163B |
|
||
| Insurance | 1 | $21B |
|
||
| Industrial Technology | 1 | $17B |
|
||
| Retail | 1 | $16B |
|
||
| Industrial Distribution | 1 | $10B |
|
||
| Utilities | 1 | $9B |
|
||
Price history
+110.3% since first listed4 events — show timeline
- 2026-05-23 Coming Soon $205,000 Heartland MLS as Distributed by MLS Grid
- 2010-03-10 Sold (Public Records) — Public Records
- 2010-03-10 Sold (MLS) — Heartland MLS as Distributed by MLS Grid
- 2010-01-25 Listed $97,500 Heartland MLS as Distributed by MLS Grid
Property tax history
+4.1%/yrLatest (2025): $1,446 · +10.8% YoY. Source: county tax records.
Cash-flow waterfall
monthlySold comps — $/sqft
last 12 mo · ≤1 miLoading sold comps…