329 S Market St · Amsterdam, OH
Flood risk 1/10 · Minimal
- FEMA flood zone
- X (unshaded)
- Chance of flooding over 30 yrs
- 0.0%
- Est. flood insurance / yr
- $473 – $860
Fire risk 3/10 · Minor
- Est. fire insurance / yr
- $713 – $1,323
Heat risk 3/10 · Minor
- Hot days now (above 96°F)
- 7 days/yr
- Hot days in 30 yrs
- 18 days/yr
Wind risk 1/10 · Minimal
- Chance of severe wind over 30 yrs
- —
Air-quality risk 2/10 · Minimal
- Unhealthy air days now
- 0 days/yr
- Unhealthy air days in 30 yrs
- 1 days/yr
Risk factors via First Street. Map © Google.
Why this score? — see what drove the B grade
The composite is a weighted blend of 9 inputs, each scored 0–100. Each bar is that input's sub-score; the figure is the points it added to the 100-point composite (weight × sub-score).
- Cash flow +24.0/30.0
- ARV discount +11.6/15.0
- Appreciation +9.3/10.0
- DSCR +7.7/10.0
- 1% rule +6.2/10.0
- Schools +5.0/10.0
- Livability +2.8/5.0
- Rent growth +2.5/5.0
- Condition / age +1.0/5.0
$109,000
🖨 Deal sheet (PDF) 📄 Offer letter ✓ Due diligence
Listing remarks MLS
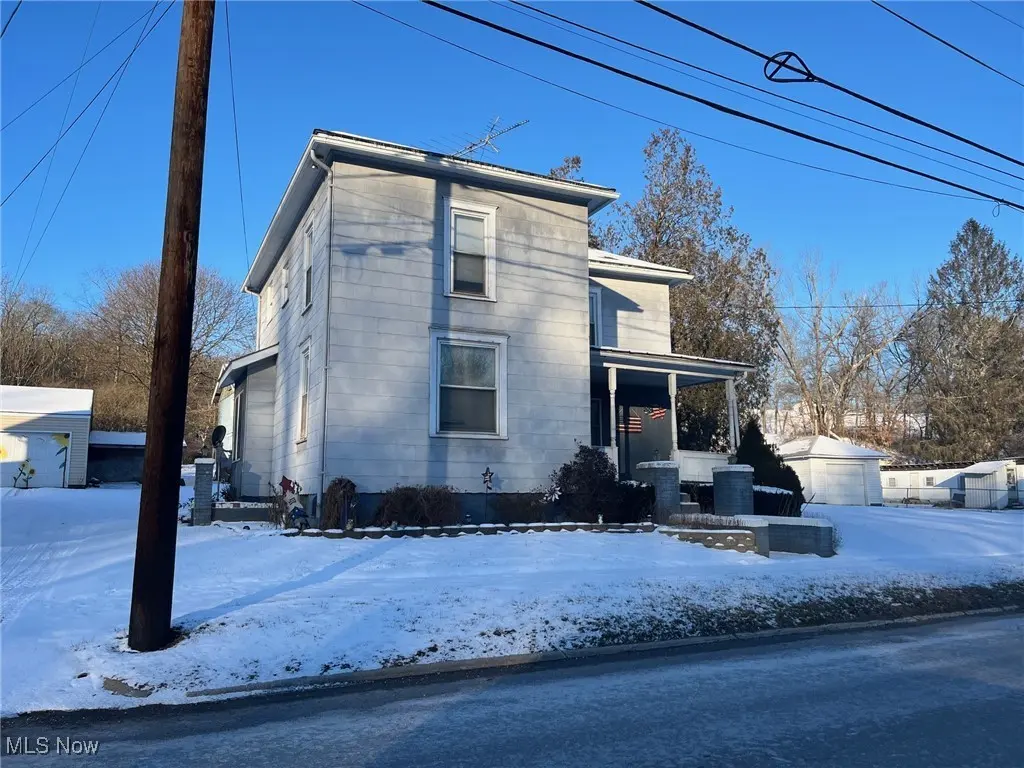
Two story, 3 bedroom, 1 bath home on level 120 X 120 lot. Two detached garages, one is a 2 story detached the other is a one story detached
Key facts
- 0.32 acre lot
- 4 garage spots
- Built 1900
Neighborhood map
What this means for you Summary
Snapshot
- This is a 3-bed/1.0-bath single-family listed at $109k. Condition is rated poor.
Deal economics
- At list price, monthly cash flow is $214 ($3k/yr) — positive.
- The deal already cash-flows at list — no discount required.
- Meets the 1% rule at list price ($1k rent vs $109k).
- Recommended offer: $96k (12.0% below list) — sets the bar for market timing.
Location & tenants
- Location reads 55/100 on livability (#1,126 in OH) — a working-class tenant base; expect higher turnover. Strengths: cost of living A+, housing A+; Watch: schools F, crime D-, amenities F.
- Edison Local (rural): math 52% / reading 66% proficiency, ranked #312 of 656 in OH (top 48%) — acceptable for families but not a draw, mixed tenant base, ~2y average lease.
- Market conditions: 9 active listings in the ZIP; 2 units permitted in Jefferson County in 2024 (0 in 5+ unit buildings).
Forward outlook
- In year one you build about $10k of equity ($754 loan paydown + $9k appreciation (8.5% local appreciation)).
- Jefferson County population projected at -19% by 2050 — secular population decline; favor cash flow + early exit over multi-decade hold.
- At projected returns (8.5% appreciation + 3.0% rent growth), your $31k cash investment doubles in ~3 years — after that, you're playing with house money.
- By year 4, paydown + projected appreciation supports a ~$35k cash-out refi (75% LTV) — recoverable capital for the next deal without selling this one.
Negotiation context
- It's been on market 152 days — a 12% lower offer ($96k) is reasonable based on typical stale-listing flexibility.
Risks & watch-outs
- Watch-outs: built in 1900 — expect roof / HVAC / electrical / plumbing capex.
Questions for the listing agent
- It's been on market 152 days. Have you received any prior offers? Is the seller open to a 12% concession, seller financing, or rate buy-down credit?
- Have any recent inspections been done? Can we get a copy of the seller's disclosures and any deferred-maintenance estimates?
- Built in 1900 — when were the roof, HVAC, electrical panel, plumbing, and water heater last replaced?
- Why hasn't it sold? Are there any deal-killer items the seller is aware of (foundation, flood, title, zoning, code violations)?
- Is there a deadline driving the sale (1031 exchange, divorce, estate, relocation)? That informs how much negotiation room exists.
- Schools are F-rated, which usually means shorter tenancies and higher turnover. Who's the typical renter profile here, and what's been the actual vacancy rate?
- Crime grade is D in this area — have there been break-ins, vandalism, or insurance claims at this property in the last 3 years? What carrier currently insures it and at what premium?
- What's the average days-on-market for RENTAL listings here right now (not sales)? A rising rental-DOM trend means longer vacancies and softer asking-rent achievability than the comps imply.
- What's the recent tenant-quality profile in this submarket — average credit score on applications, eviction rate, late-payment / NSF rate, and stable-employment percentage? A property-management company in the area should have these aggregated.
- How much new for-sale + rental construction is in the pipeline within 1–3 miles? Heavy new supply typically softens prices + rents 12–24 months out; constrained supply supports both.
Investment metrics
- 1% rule
- 1.12% ✓
- Cap rate
- 8.65%
- Cash-on-cash
- 8.40%
- DSCR
- 1.37
- GRM
- 7.4
CMA / ARV
- ARV (median comp)
- $119,842
- List price
- $109,000
- Delta
- -9.05%
- Verdict
- FAIR
- Comps
- 17 within 1.0 mi
Show comp detail 4 sales within ~0.75 mi
| Address | Dist | Beds/Ba | Sqft | Sold | Price | $/sf | Match |
|---|---|---|---|---|---|---|---|
| 504 S Main St | 0.15mi | 3/1.5 | 1,632 (+4%) | 14mo | $129,900 | $80 | 72 |
| 331 S Main | 0.01mi | 2/2.0 (-1) | 1,672 (+7%) | 20mo | $100,000 | $60 | 63 |
| 6080 Hill St SE | 0.69mi | 4/1.0 (+1) | 1,560 (-0%) | 12mo | $50,000 | $32 | 52 |
| 399 N Main St | 0.68mi | 4/1.5 (+1) | 1,792 (+14%) | 11mo | $85,000 | $47 | 29 |
Match score weights: distance 35% · size 25% · config 20% · recency 20%. Top-matched comps best support the ARV.
Projected returns pro-forma
8.5% appreciation · 3.0% rent growth · sell at horizon
- IRR
- 27.5%
- Equity multiple
- 3.03×
- Total profit
- $62,080
- Equity at exit
- $86,584
- IRR
- 24.5%
- Equity multiple
- 6.58×
- Total profit
- $170,296
- Equity at exit
- $175,597
Cash invested: $30,520 (down + closing). Projections, not guarantees.
Landlord ↔ Tenant lean methodology
- Overall (STATE)
- 73 Landlord-Friendly
- State Ohio
- 73 Landlord-Friendly · R+6
- County
- — inherits STATE
- City
- — inherits STATE
ZIP-level market 43903
- Home prices YoY
- 3.2%
- Active inventory
- 9
- Price-to-rent
- 7.4×
Monthly cashflow live
- Estimated rent
- $1,224 medium interval (Pro) →
- Mortgage (P&I)
- −$572
- Tax est. 1.5%
- −$136 /mo · $1,635/yr
- Insurance
- −$45
- HOA
- −$0
- Vacancy / Maint / Mgmt
- −$257
- Net cashflow
- $214
Break-even live
Sensitivity live
| Price | -10% $289 | -5% $251 | +0% $214 | +5% $176 | +10% $138 |
|---|---|---|---|---|---|
| Rent | -10% $117 | -5% $165 | +0% $214 | +5% $262 | +10% $310 |
| Rate | -1.0pp $269 | -0.5pp $241 | base $214 | +0.5pp $185 | +1.0pp $157 |
UW: 25.0% down · 7.5% · 30yr · 1.5% tax · 5.0% vac · 8.0% maint · 8.0% mgmt
Financing live
Cash to close
- Down payment
- $27,250
- Closing costs
- $3,270
- Reserves months
- —
- Total cash needed
- —
Loan-product check · same deal, 3 products live
Conventional
25% down · 7.5% · 30yr
- Down + closing
- —
- Monthly P&I
- —
- Monthly cashflow
- —
- DSCR
- —
- Eligible?
- —
Personal DTI + credit; lowest rate.
DSCR
20% down · 8.5% · 30yr
- Down + closing
- —
- Monthly P&I
- —
- Monthly cashflow
- —
- DSCR
- —
- Eligible?
- —
No personal income docs; deal must DSCR.
Hard money
10% down · 12.0% · 12mo
- Down + closing
- —
- Monthly P&I
- —
- Monthly cashflow
- —
- DSCR
- —
- Eligible?
- —
Short-term bridge; refi at stabilization.
Listing history 18 events
-
2026-06-21days on market $109,000 Active 152 DOM
-
2026-06-19days on market $109,000 Active 150 DOM
-
2026-06-18days on market $109,000 Active 149 DOM
-
2026-06-17days on market $109,000 Active 148 DOM
-
2026-06-16days on market $109,000 Active 147 DOM
-
2026-06-15days on market $109,000 Active 146 DOM
-
2026-06-14days on market $109,000 Active 144 DOM
-
2026-06-12days on market $109,000 Active 143 DOM
-
2026-06-09days on market $109,000 Active 140 DOM
-
2026-06-08days on market $109,000 Active 139 DOM
-
2026-06-07days on market $109,000 Active 138 DOM
-
2026-06-07days on market $109,000 Active 137 DOM
-
2026-06-04days on market $109,000 Active 134 DOM
-
2026-06-02days on market $109,000 Active 133 DOM
-
2026-06-01days on market $109,000 Active 132 DOM
-
2026-05-31days on market $109,000 Active 131 DOM
-
2026-05-31days on market $109,000 Active 130 DOM
-
2026-01-20$140,000 Active 139-char remark
Show marketing remark (139 chars)
Two story, 3 bedroom, 1 bath home on level 120 X 120 lot. Two detached garages, one is a 2 story detached the other is a one story detached
ⓘ Source: listings_history table (triggers on properties + properties_extension) + one-shot
backfill from property_details.listing_events for pre-trigger history.
Climate risk First Street
- Flood 1/10 Low FEMA zone X (unshaded) · 0% chance over 30 yrs
- Wildfire 3/10 Moderate
- Heat 3/10 Moderate 7 d/yr ≥96°F today · 18 d/yr by 30 yrs out
- Wind 1/10 Low
- Air quality 2/10 Low 0 unhealthy d/yr today · 1 by 30 yrs out
Nearby sold comps map
Loading sold comps map…
Walkable amenities ~0.75 mi
Loading nearby amenities…
Taxation est. · year 1
- Rental income
- $14,689
- − Mortgage interest
- −$6,106
- − Property taxes
- −$1,635
- − Insurance
- −$545
- − Repairs & maintenance
- −$1,175
- − Management
- −$1,175
- − Depreciation
- −$3,171
- Taxable income
- $882
- Est. tax owed @ 24.0%
- −$212
- After-tax cash flow
- $2,353/yr
For passive investors: Depreciation is non-cash, so a rental often shows a tax loss while cash-flowing — sheltering income. Rental losses are passive: they offset passive income freely, and up to $25,000/yr can offset ordinary (W-2) income if you actively participate and your MAGI is under $100k (phasing out to $0 by $150k); unused losses carry forward. On sale, claimed depreciation is recaptured at up to 25%, and gains may owe capital-gains tax (a 1031 exchange can defer both). Figures are a year-1 estimate at your 24.0% rate — not tax advice; consult a CPA.
Condition & rehab AI · 6 photos
This two-story home requires extensive repairs and maintenance, including a new roof, exterior siding repair, driveway repair, and foundation repair. These improvements will significantly increase its resale value.
Repairs flagged
- Major roof — The satellite image shows visible damage and missing shingles.
- Major exterior siding — The satellite image shows peeling paint and siding damage.
- Major concrete driveway — The satellite image shows a concrete driveway with visible cracks.
- Major concrete foundation — The satellite image shows a concrete foundation with visible cracks.
- Major interior walls — The listing photo shows exposed brick walls and a worn wooden floor.
Value-add opportunities
- Resale roof replacement — A new roof will significantly improve the home's curb appeal and increase its resale value.
- Resale exterior siding repair/painting — Repairing and repainting the siding will improve the home's appearance and increase its resale value.
- Resale driveway repair — Repairing the driveway will improve the home's curb appeal and increase its resale value.
- Resale foundation repair — Repairing the foundation will improve the home's structural integrity and increase its resale value.
- Resale interior wall repair — Repairing the interior walls will improve the home's appearance and increase its resale value.
Renovation cost estimate screening
| Repair item | Severity | Est. cost |
|---|---|---|
| roof · The satellite image shows visible damage and missing shingles. | Major | $15,000–50,000 |
| exterior siding · The satellite image shows peeling paint and siding damage. | Major | $15,000–50,000 |
| concrete driveway · The satellite image shows a concrete driveway with visible cracks. | Major | $15,000–50,000 |
| concrete foundation · The satellite image shows a concrete foundation with visible cracks. | Major | $15,000–50,000 |
| interior walls · The listing photo shows exposed brick walls and a worn wooden floor. | Major | $15,000–50,000 |
| Total estimated repair cost · 5 items | $75,000–250,000 |
Value-add ROI direction
- Resale roof replacement — A new roof will significantly improve the home's curb appeal and increase its resale value. ↑
- Resale exterior siding repair/painting — Repairing and repainting the siding will improve the home's appearance and increase its resale value. ↑
- Resale driveway repair — Repairing the driveway will improve the home's curb appeal and increase its resale value. ↑
- Resale foundation repair — Repairing the foundation will improve the home's structural integrity and increase its resale value. ↑
- Resale interior wall repair — Repairing the interior walls will improve the home's appearance and increase its resale value. ↑
ⓘ Cost ranges are severity-bucket heuristics (US national rule-of-thumb). Get contractor quotes + a written scope before underwriting a rehab budget.
Schools (NCES district)
- District
- Edison Local
- NCES district ID
- 3904779
- Math proficiency
- 52% ▼ -13.00%
- Reading proficiency
- 66% ▼ -7.00%
- Median HH income
- $45,717
- Composite
- 49.79/100
- National rank
- #1959
- State rank
- #312 of 656 in OH
Livability — Amsterdam
- Score
- 55/100
- State rank
- #1126
- US rank
- #23116
Category grades
Schools grade is shown separately in the Schools card above.
Census & demographics
- Census place
- Amsterdam, OH
- County
- Carroll · 27,595 people
- Metro
- Canton-Massillon, OH
- Population (ZIP)
- 2,241
- Household income
- $64,659
- Rent vs Own
- Severe rent burden
- 1.7
Population outlook (Jefferson County) Hauer SSP2
- Today (2025)
- 63,481 people
- By 2030
- 61,067 · -3.8%
- By 2040
- 55,860 · -12.0%
- By 2050
- 51,236 · -19.3%
- By 2075
- 41,804 · -34.1%
- By 2100
- 32,344 · -49.0%
Race, ethnicity, and origin ACS 2023
- Neighborhood character
- Predominantly White (95%)
- Race & ethnicity
- White 95% Two or more races 5%
- Common ancestry
- Romanian 11% Italian 2% Polish 2%
- Foreign-born
- 0% · Canada
- Languages at home
- 94% English-only · German/W. Germanic 6%
Political lean MEDSL · Jefferson
- 2024 margin
- Solid R (+43.9) · D 27.5% · R 71.4% · Other 1.1%
- 2008→2024 swing
- -44.1pp toward R · 2008: 0.2pp · 2024: -43.9pp
- All cycles
- 2024: R+43.9 2020: R+38.4 2016: R+35.7 2012: R+5.5 2008: D+0.2
Not yet ingested
- Civics
- —
Market trends
- HPI YoY
- ▲ 8.50%
- Current HPI
- 277.405
- Rent YoY
- —
- Metro
- —
- State GDP YoY
- ▲ 1.98%
- F500 in state
- 48
Industry mix (Fortune 500 HQ in OH)
| Industry | F500 HQs | Revenue |
|---|---|---|
| Insurance | 3 | $145B |
|
||
| Industrial Machinery | 3 | $49B |
|
||
| Financial Services | 3 | $24B |
|
||
| Consumer Goods | 2 | $93B |
|
||
| Aerospace / Defense | 2 | $47B |
|
||
| Utilities | 2 | $33B |
|
||
Price history
1 event — show timeline
- 2026-01-20 Listed $140,000 MLSNOW
Cash-flow waterfall
monthlySold comps — $/sqft
last 12 mo · ≤1 miLoading sold comps…