 Duplex
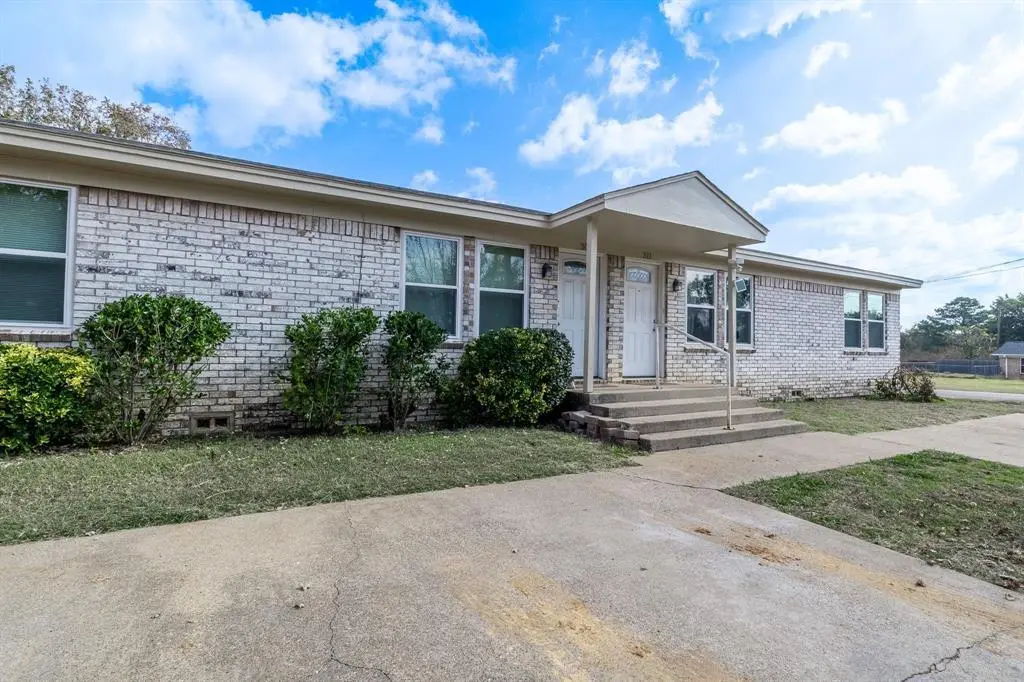
309-311 Lilac Dr · Granbury, TX
Flood risk 1/10 · Minimal
- FEMA flood zone
- X (unshaded)
- Chance of flooding over 30 yrs
- 0.0%
- Est. flood insurance / yr
- $507 – $1,088
Fire risk 5/10 · Moderate
- Est. fire insurance / yr
- $1,222 – $2,270
Heat risk 7/10 · Major
- Hot days now (above 108°F)
- 7 days/yr
- Hot days in 30 yrs
- 23 days/yr
Wind risk 6/10 · Moderate
- Chance of severe wind over 30 yrs
- 27.0%
Air-quality risk 2/10 · Minimal
- Unhealthy air days now
- 1 days/yr
- Unhealthy air days in 30 yrs
- 2 days/yr
Risk factors via First Street. Map © Google.
Why this score? — see what drove the B- grade
The composite is a weighted blend of 9 inputs, each scored 0–100. Each bar is that input's sub-score; the figure is the points it added to the 100-point composite (weight × sub-score).
- Cash flow +28.3/30.0
- DSCR +10.0/10.0
- ARV discount +8.2/15.0
- 1% rule +7.1/10.0
- Schools +4.0/10.0
- Rent growth +3.8/5.0
- Livability +3.3/5.0
- Condition / age +2.5/5.0
- Appreciation +0.0/10.0
$255,000
🖨 Deal sheet 📄 Offer letter ✓ Due diligence
Multi-family units
County records classify this as Multi-Family (2-4 Unit). Listing-text estimate: 2 units. confirmed
Listing remarks
Calling all investors! * * BRAND NEW ROOF INSTALLED, ALL 8 WINDOWS IN THE FRONT REPLACED, NEW FLOORING INSTALLED IN THE LIVING AREAS * * This income-producing duplex is ready to generate returns from day one. Each unit offers 2 bedrooms and 1 bathroom, featuring an open floor plan that maximizes space and comfort. You can enjoy a fenced backyard, perfect for outdoor activities. Conveniently located close to shopping, dining, and entertainment, this property sits on the desirable Fort Worth side of town—ideal for commuters with easy access to the metroplex. Since a new roof was installed, it will provide added peace of mind and value for years to come. Don’t miss this opportu
Key facts
- New hvac installed
- Brand new roof
- Fenced backyard
Tags
Property features AI
Finance
- Other: Tenancy terms: Over 9 months; Possession at closing/funding
- Financial info: Property listed as residential income with 2 units; 1 building containing 2 units; 100% occupancy; Gross annual income reported at $24,900; Net operating income reported at $24,900; Cap rate: 9.76%; Listing terms include Cash, Conventional, FHA, and VA loan
- HOA & community: No association
Exterior
- Parking: Open common parking; Concrete surfaces; Total 4 parking spaces
- Utilities: Co-op electric; Private water; Septic system; No city services; All-weather road access
- Home design: Duplex (residential income); One-level; Built in 1986; Composition roof; Pillar/post/pier foundation; Complex name: 309 - 311 Lilac; Subdivision: Eastwood Village; Country: United States; County: Hood
- Construction: Brick construction
- Exterior features: Corner lot; Large backyard with grass; Chain link fencing; Fenced; Some areas with no fencing
Interior
- Kitchen: Dishwasher; Electric oven; Electric range; Refrigerator
- Bedrooms: 4 bedrooms
- Flooring: Vinyl flooring
- Bathrooms: 2 bathrooms
- Heating & cooling: Central heating (electric); Central air; Ceiling fan(s)
- Interior features: Cable TV available; Decorative lighting; Eat-in kitchen; High speed internet available
- Laundry & utility: Appliances contribute to energy efficiency
Neighborhood map
What this means for you Summary
Snapshot
- This is a 2 × 2-bed/1.0-bath units multifamily listed at $255k.
Deal economics
- At list price, monthly cash flow is $819 ($10k/yr) — positive. Per door: $409/mo.
- The deal already cash-flows at list — no discount required.
- Meets the 1% rule at list price ($3k rent vs $255k).
- Cap rate 10.1% vs local median 3.8% in Granbury — top-decile yield for the area; either an underpriced asset or a hidden risk that comps aren't pricing in. Stress-test before assuming the spread holds.
Location & tenants
- Location reads 66/100 on livability (#628 in TX) — a middle-class / working-renter tenant base. Strengths: cost of living A+, housing A+, health & safety A+; Watch: employment C-, crime D+, amenities F.
- Granbury ISD (town): math 46% / reading 46% proficiency, ranked #237 of 826 in TX (top 29%) — families likely to look elsewhere, expect single-tenant / working-renter base with shorter leases.
- Zoned schools: Acton El (math 52% / reading 46%, grade D, #926 of 4,322 statewide, top 22%, 814 students, 48% FRL).
- Market conditions: Rents rising fast (+5.2%/yr); 690 active listings in the ZIP; 19 comparable units currently listed for rent nearby; rentals lingering (median 44d on market — plan ~5-8 weeks vacancy on turnover, expect pricing pressure); 53% of comp listings sitting > 30 days — soft ceiling on asking rent; solid renter incomes; 125 units permitted in Hood County in 2024 (0 in 5+ unit buildings).
- This rent runs 35% of the median local income ($105k/yr) — at the standard rent-burdened threshold; future hikes will face affordability resistance.
Forward outlook
- Local home prices are declining (-3.0%/yr); year-one equity from $2k of loan paydown is wiped out by about $8k of value loss. Plan a longer hold.
- Hood County population projected at +29% by 2050 — long-run rental-demand tailwind backs the buy-and-hold thesis.
- At projected returns (-3.0% appreciation + 5.2% rent growth), your $71k cash investment doubles in ~8 years — after that, you're playing with house money.
Negotiation context
- Only 13 days on market — expect competitive offers; lowballing is unlikely to land.
- 8 sale attempts since 18y ago with the ask held roughly flat each time — persistent listings suggest the price (not the market) is what's stuck; bring a comps-based counter.
Risks & watch-outs
- Climate carrying-cost: major wind risk, 27% chance of damaging wind over 30y; moderate wildfire risk; extreme-heat days projected 7→23/yr by 2055 (HVAC capex compounding) — expect insurance premiums to compound above CPI over the hold.
Questions for the listing agent
- Can we see the unit-by-unit rent roll, current vacancy, and any below-market leases? What's the average tenancy length?
- What capital expenditures (roof, boiler, parking lot, exteriors) have been made in the last 5 years, and what's planned in the next 2?
- Is there a deadline driving the sale (1031 exchange, divorce, estate, relocation)? That informs how much negotiation room exists.
- Schools are D-rated, which usually means shorter tenancies and higher turnover. Who's the typical renter profile here, and what's been the actual vacancy rate?
- Crime grade is D in this area — have there been break-ins, vandalism, or insurance claims at this property in the last 3 years? What carrier currently insures it and at what premium?
- What's the average days-on-market for RENTAL listings here right now (not sales)? A rising rental-DOM trend means longer vacancies and softer asking-rent achievability than the comps imply.
- What's the recent tenant-quality profile in this submarket — average credit score on applications, eviction rate, late-payment / NSF rate, and stable-employment percentage? A property-management company in the area should have these aggregated.
- How much new apartment / multifamily construction is in the pipeline within 1–3 miles? Heavy new supply (>2% of stock underway) typically softens rents 12–24 months out; light construction supports rent growth.
Investment metrics
- 1% rule
- 1.21% ✓
- Cap rate
- 10.15%
- Cash-on-cash
- 13.76%
- DSCR
- 1.61
- GRM
- 6.9
CMA / ARV
- ARV (on-the-fly)
- $259,308
- Comps found
- 1
Show comp detail 1 sale within ~0.75 mi
| Address | Dist | Beds/Ba | Sqft | Sold | Price | $/sf | Match |
|---|---|---|---|---|---|---|---|
| 4504-4506 Eastview Ct | 0.02mi | 4/2.0 | 1,764 (0%) | 9mo | $260,000 | $147 | 92 |
Match score weights: distance 35% · size 25% · config 20% · recency 20%. Top-matched comps best support the ARV.
Projected returns pro-forma
-3.0% appreciation · 5.2% rent growth · sell at horizon
- IRR
- 6.2%
- Equity multiple
- 1.25×
- Total profit
- $17,761
- Equity at exit
- $38,021
- IRR
- 17.4%
- Equity multiple
- 2.57×
- Total profit
- $112,373
- Equity at exit
- $22,048
Cash invested: $71,400 (down + closing). Projections, not guarantees.
Landlord ↔ Tenant lean methodology
- Overall (STATE)
- 87 Strongly Landlord-Friendly
- State Texas
- 87 Strongly Landlord-Friendly · R+5
- County
- — inherits STATE
- City
- — inherits STATE
ZIP-level market 76049
- Home prices YoY
- -26.8%
- Rents YoY
- 5.2%
- Active inventory
- 690
- Price-to-rent
- 13.8×
Monthly cashflow live
- Estimated rent
- $3,082 high interval (Pro) →
- Mortgage (P&I)
- −$1,337
- Tax from tax record
- −$172 /mo · $2,069/yr
- Insurance
- −$106
- HOA
- −$0
- Vacancy / Maint / Mgmt
- −$647
- Net cashflow
- $819
Break-even live
2-unit breakdown (identical units grouped — click to expand)
| Units | Beds | Baths | Est. rent |
|---|---|---|---|
| 2× units | 2 | 1 | $3,082 |
| #1 | 2 | 1 | $1,541 |
| #2 | 2 | 1 | $1,541 |
| Total (2 units) | $3,082 | ||
UW: 25.0% down · 7.5% · 30yr · 1.5% tax · 5.0% vac · 8.0% maint · 8.0% mgmt
Financing live
Cash to close
- Down payment
- $63,750
- Closing costs
- $7,650
- Reserves months
- —
- Total cash needed
- —
Loan-product check · same deal, 3 products live
Conventional
25% down · 7.5% · 30yr
- Down + closing
- —
- Monthly P&I
- —
- Monthly cashflow
- —
- DSCR
- —
- Eligible?
- —
Personal DTI + credit; lowest rate.
DSCR
20% down · 8.5% · 30yr
- Down + closing
- —
- Monthly P&I
- —
- Monthly cashflow
- —
- DSCR
- —
- Eligible?
- —
No personal income docs; deal must DSCR.
Hard money
10% down · 12.0% · 12mo
- Down + closing
- —
- Monthly P&I
- —
- Monthly cashflow
- —
- DSCR
- —
- Eligible?
- —
Short-term bridge; refi at stabilization.
Rent comps 19 comps
| Address | Beds | Baths | Sqft | Rent | $/sqft | DOM | Units | Dist |
|---|---|---|---|---|---|---|---|---|
| 4606 Francis Ct Granbury, TX | 3.0 | 2.0 | 1300 | $2,100 | $1.62 | 43d | 1 | 0.20mi |
| 213 Dean Ct Granbury, TX | 3.0 | 2.0 | 1372 | $1,609 | $1.17 | 2d | 1 | 0.49mi |
| 208 Bobbie Ann Ct Granbury, TX | 3.0 | 2.0 | 1645 | $1,675 | $1.02 | 43d | 1 | 0.50mi |
| 4411 Bobbie Ann Dr Granbury, TX | 3.0 | 2.0 | 1645 | $1,650 | $1.00 | 43d | 1 | 0.57mi |
| 107 Donna Cir Granbury, TX | 3.0 | 2.0 | 1735 | $2,400 | $1.38 | 43d | 1 | 0.59mi |
| 4000 Sapphire Ln Granbury, TX | 3.0 | 2.0 | 1635 | $1,789 | $1.09 | 2d | 1 | 0.77mi |
| 4700 Topaz Ln Granbury, TX | 4.0 | 2.0 | 2022 | $2,350 | $1.16 | 7d | 1 | 0.82mi |
| 700 Rolling Terrace Cir Granbury, TX | 3.0 | 2.0 | 1612 | $1,774 | $1.10 | 7d | 1 | 0.82mi |
| 100 Cardinal Woods Ct Granbury, TX | 3.0 | 2.5 | 1980 | $3,850 | $1.94 | 43d | 1 | 0.83mi |
| 104 Cardinal Woods Ct Granbury, TX | 3.0 | 2.5 | 1890 | $3,850 | $2.04 | 43d | 1 | 0.84mi |
| 110 Cardinal Woods Ct Granbury, TX | 3.0 | 2.5 | 1980 | $3,850 | $1.94 | 43d | 1 | 0.87mi |
| 112 Cardinal Woods Ct Granbury, TX | 3.0 | 2.5 | 1890 | $3,850 | $2.04 | 43d | 1 | 0.88mi |
| 211 S Cardinal Ct Granbury, TX | 3.0 | 2.5 | 1980 | $3,850 | $1.94 | 43d | 1 | 0.89mi |
| 4720 Topaz Ln Granbury, TX | 4.0 | 2.0 | 1903 | $2,400 | $1.26 | 24d | 1 | 0.89mi |
| 316 Sardius Blvd Granbury, TX | 3.0 | 2.0 | 1686 | $1,950 | $1.16 | 7d | 1 | 0.90mi |
| 4816 Sapphire Ln Granbury, TX | 4.0 | 2.0 | 1878 | $2,400 | $1.28 | 43d | 1 | 1.06mi |
| 2700 James Rd Granbury, TX | 3.0 | 2.0 | 1295 | $1,800 | $1.39 | 24d | 1 | 1.18mi |
| 2705 Acton School Rd Granbury, TX | 4.0 | 2.0 | 1390 | $1,700 | $1.22 | 16d | 1 | 1.27mi |
| 2705 Acton School Rd Granbury, TX | 4.0 | 2.0 | 1390 | $1,700 | $1.22 | 24d | 1 | 1.27mi |
Listing history 9 events
-
2026-06-18days on market $255,000 Active 13 DOM
-
2026-06-17days on market $255,000 Active 12 DOM
-
2026-06-16days on market $255,000 Active 11 DOM
-
2026-06-15days on market $255,000 Active 10 DOM
-
2026-06-13days on market $255,000 Active 8 DOM
-
2026-06-09days on market $255,000 Active 4 DOM
-
2026-06-08days on market $255,000 Active 3 DOM
-
2026-06-07remarks 687-char remark
-
2026-06-07$255,000 Active 2 DOM
ⓘ Source: listings_history table (triggers on properties + properties_extension) + one-shot
backfill from property_details.listing_events for pre-trigger history.
Tax reassessment forecast TX · Resets to sale price
- Current annual tax
- $2,069 · $172/mo
- Projected year-2 tax
- $4,666 · $389/mo
- Expected delta
- +$2,598/yr (+$216/mo · 125.5%)
ⓘ Screening estimate from a state-policy table — verify with the county assessor before closing.
Climate risk First Street
- Flood 1/10 Low FEMA zone X (unshaded) · 0% chance over 30 yrs
- Wildfire 5/10 Major
- Heat 7/10 Severe 7 d/yr ≥108°F today · 23 d/yr by 30 yrs out
- Wind 6/10 Major 27% chance of damaging wind over 30 yrs
- Air quality 2/10 Low 1 unhealthy d/yr today · 2 by 30 yrs out
Nearby sold comps map
Loading sold comps map…
Walkable amenities ~0.75 mi
Loading nearby amenities…
Taxation est. · year 1
- Rental income
- $36,984
- − Mortgage interest
- −$14,284
- − Property taxes
- −$2,069
- − Insurance
- −$1,275
- − Repairs & maintenance
- −$2,959
- − Management
- −$2,959
- − Depreciation
- −$7,418
- Taxable income
- $6,020
- Est. tax owed @ 24.0%
- −$1,445
- After-tax cash flow
- $8,381/yr
For passive investors: Depreciation is non-cash, so a rental often shows a tax loss while cash-flowing — sheltering income. Rental losses are passive: they offset passive income freely, and up to $25,000/yr can offset ordinary (W-2) income if you actively participate and your MAGI is under $100k (phasing out to $0 by $150k); unused losses carry forward. On sale, claimed depreciation is recaptured at up to 25%, and gains may owe capital-gains tax (a 1031 exchange can defer both). Figures are a year-1 estimate at your 24.0% rate — not tax advice; consult a CPA.
Schools (NCES district)
- District
- Granbury ISD
- NCES district ID
- 4821390
- Math proficiency
- 46% ▬ 0.00%
- Reading proficiency
- 46% ▲ 4.00%
- Median HH income
- $55,856
- Composite
- 40.04/100
- National rank
- #3820
- State rank
- #237 of 826 in TX
Livability — Granbury
- Score
- 66/100
- State rank
- #628
- US rank
- #11998
Category grades
Schools grade is shown separately in the Schools card above.
Census & demographics
- County
- Hood County · 58,506 people
- City population
- 58,506
- Metro
- Granbury, TX
- Population (ZIP)
- 31,506
- Household income
- $104,967
- Rent vs Own
- Severe rent burden
- 235.0
Population outlook (Hood County) Hauer SSP2
- Today (2025)
- 63,502 people
- By 2030
- 67,459 · +6.2%
- By 2040
- 74,958 · +18.0%
- By 2050
- 81,922 · +29.0%
- By 2075
- 98,872 · +55.7%
- By 2100
- 107,796 · +69.8%
Race, ethnicity, and origin ACS 2023
- Neighborhood character
- Predominantly White (82%)
- Race & ethnicity
- White 82% Hispanic / Latino 14% Two or more races 9%
- Hispanic origin (detail)
- Mexican 11%
- Common ancestry
- Slovak 3% Serbian 2% Italian 2%
- Foreign-born
- 5% · Canada
- Languages at home
- 91% English-only · Spanish 8%
Political lean MEDSL · Hood
- 2024 margin
- Solid R (+66.0) · D 16.6% · R 82.6%
- 2008→2024 swing
- -11.9pp toward R · 2008: -54.0pp · 2024: -66.0pp
- All cycles
- 2024: R+66.0 2020: R+64.1 2016: R+66.5 2012: R+64.7 2008: R+54.0
Not yet ingested
- Civics
- —
Market trends
- HPI YoY
- ▼ -100.09%
- Current HPI
- 273.1293
- Rent YoY
- ▲ 5.20%
- Metro
- Granbury, TX
- State GDP YoY
- ▲ 3.95%
- F500 in state
- 110
Industry mix (Fortune 500 HQ in TX)
| Industry | F500 HQs | Revenue |
|---|---|---|
| Energy | 16 | $1,198B |
|
||
| Technology | 5 | $198B |
|
||
| Engineering / Construction | 4 | $72B |
|
||
| Energy Services | 3 | $60B |
|
||
| Utilities | 3 | $41B |
|
||
| Healthcare | 2 | $330B |
|
||
Price history
+140.6% since first listed19 events — show timeline
- 2026-06-04 Listed $255,000 NTREIS
- 2026-04-15 Listing Removed — NTREIS
- 2026-01-06 Price Changed $258,000 NTREIS
- 2025-12-09 Relisted — NTREIS
- 2025-12-03 Contingent — NTREIS
- 2025-11-28 Price Changed $259,999 NTREIS
- 2025-11-20 Listed $260,000 NTREIS
- 2025-10-16 Listing Removed — NTREIS
- 2025-10-01 Relisted — NTREIS
- 2025-09-25 Contingent — NTREIS
- 2025-09-15 Relisted — NTREIS
- 2025-09-08 Contingent — NTREIS
- 2025-08-25 Relisted — NTREIS
- 2025-08-19 Contingent — NTREIS
- 2025-08-05 Listed $260,000 NTREIS
- 2009-01-07 Sold (MLS) — NTREIS
- 2009-01-06 Listing Removed — NTREIS
- 2008-01-22 Listed $106,000 NTREIS
- 2005-03-14 Sold (Public Records) — Public Records
Property tax history
+2.8%/yrLatest (2025): $2,069 · -0.5% YoY. Source: county tax records.
Cash-flow waterfall
monthlySold comps — $/sqft
last 12 mo · ≤1 miLoading sold comps…