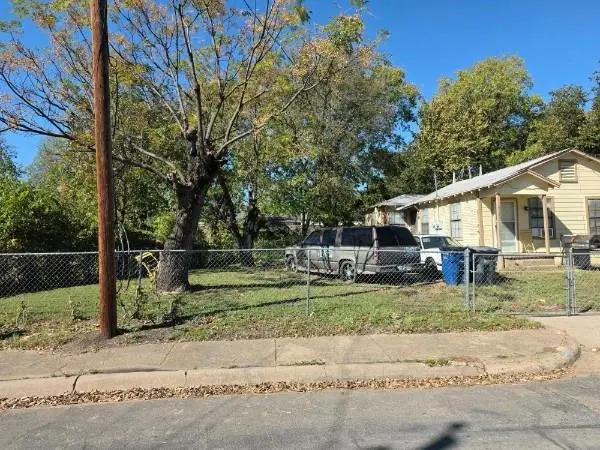
4525 Canal St · Dallas, TX
Flood risk 5/10 · Moderate
- FEMA flood zone
- X (unshaded)
- Chance of flooding over 30 yrs
- 0.47%
- Est. flood insurance / yr
- $507 – $1,088
Fire risk 3/10 · Minor
- Est. fire insurance / yr
- $1,222 – $2,270
Heat risk 7/10 · Major
- Hot days now (above 109°F)
- 7 days/yr
- Hot days in 30 yrs
- 25 days/yr
Wind risk 6/10 · Moderate
- Chance of severe wind over 30 yrs
- 27.0%
Air-quality risk 2/10 · Minimal
- Unhealthy air days now
- 2 days/yr
- Unhealthy air days in 30 yrs
- 2 days/yr
Risk factors via First Street. Map © Google.
Why this score? — see what drove the C- grade
The composite is a weighted blend of 9 inputs, each scored 0–100. Each bar is that input's sub-score; the figure is the points it added to the 100-point composite (weight × sub-score).
- Cash flow +15.7/30.0
- ARV discount +9.3/15.0
- Appreciation +5.5/10.0
- DSCR +4.8/10.0
- 1% rule +4.5/10.0
- Livability +4.0/5.0
- Schools +2.8/10.0
- Rent growth +2.5/5.0
- Condition / age +2.5/5.0
$145,000
🖨 Deal sheet 📄 Offer letter ✓ Due diligence
Listing remarks MLS
Great investment opportunity, duplex 1 bedroom 1 bathroom on both sides with long-term tenants. Bonus, the seller is selling the adjacent lot (4521 Canal St) 0.0633 of an acre as a package.
Key facts
- Long term tenants
- Adjacent lot
- Duplex
Tags
Neighborhood map
What this means for you Summary
Snapshot
- This is a 2-bed/2.0-bath single-family listed at $145k.
Deal economics
- At list price, monthly cash flow is $63 ($752/yr) — positive.
- The deal already cash-flows at list — no discount required.
- To meet the 1% rule (rent ≥ 1% of price), the offer needs to be $138k (5.1% below list).
- Recommended offer: $128k (12.0% below list) — sets the bar for market timing.
- Cap rate 6.8% vs local median 2.3% in Dallas — top-decile yield for the area; either an underpriced asset or a hidden risk that comps aren't pricing in. Stress-test before assuming the spread holds.
Location & tenants
- Location reads 81/100 on livability (#24 in TX, #1,380 nationally) — a professional / high-income tenant draw. Strengths: amenities A+, commute A+, housing A+; Watch: schools C-, crime F.
- Dallas ISD (urban): math 31% / reading 36% proficiency, ranked #559 of 826 in TX (top 68%) — families likely to look elsewhere, expect single-tenant / working-renter base with shorter leases; 83% free/reduced lunch — lower-income household profile, screen leases tightly.
- Market conditions: 80 active listings in the ZIP; 22 comparable units currently listed for rent nearby; rentals leasing fast (median 14d on market — plan ~1-2 weeks tenant-placement turnaround); 12,577 units permitted in Dallas County in 2024 (6,829 in 5+ unit buildings).
Forward outlook
- In year one you build about $3k of equity ($1k loan paydown + $2k appreciation (1.1% local appreciation)).
- Dallas County population projected at +35% by 2050 — long-run rental-demand tailwind backs the buy-and-hold thesis.
- At projected returns (1.1% appreciation + 3.0% rent growth), your $41k cash investment doubles in ~9 years — after that, you're playing with house money.
Negotiation context
- It's been on market 222 days — a 12% lower offer ($128k) is reasonable based on typical stale-listing flexibility.
Risks & watch-outs
- Watch-outs: built in 1938 — expect roof / HVAC / electrical / plumbing capex.
- Climate carrying-cost: moderate flood risk; major wind risk, 27% chance of damaging wind over 30y; extreme-heat days projected 7→25/yr by 2055 (HVAC capex compounding) — expect insurance premiums to compound above CPI over the hold.
Questions for the listing agent
- It's been on market 222 days. Have you received any prior offers? Is the seller open to a 12% concession, seller financing, or rate buy-down credit?
- Built in 1938 — when were the roof, HVAC, electrical panel, plumbing, and water heater last replaced?
- Why hasn't it sold? Are there any deal-killer items the seller is aware of (foundation, flood, title, zoning, code violations)?
- Is there a deadline driving the sale (1031 exchange, divorce, estate, relocation)? That informs how much negotiation room exists.
- Crime grade is F in this area — have there been break-ins, vandalism, or insurance claims at this property in the last 3 years? What carrier currently insures it and at what premium?
- What's the average days-on-market for RENTAL listings here right now (not sales)? A rising rental-DOM trend means longer vacancies and softer asking-rent achievability than the comps imply.
- What's the recent tenant-quality profile in this submarket — average credit score on applications, eviction rate, late-payment / NSF rate, and stable-employment percentage? A property-management company in the area should have these aggregated.
- How much new for-sale + rental construction is in the pipeline within 1–3 miles? Heavy new supply typically softens prices + rents 12–24 months out; constrained supply supports both.
Investment metrics
- 1% rule
- 0.95% ✗
- Cap rate
- 6.81%
- Cash-on-cash
- 1.85%
- DSCR
- 1.08
- GRM
- 8.8
CMA / ARV
- ARV (median comp)
- $151,041
- List price
- $145,000
- Delta
- -4.00%
- Verdict
- FAIR
- Comps
- 3 within 1.0 mi
Show comp detail 12 sales within ~0.75 mi
| Address | Dist | Beds/Ba | Sqft | Sold | Price | $/sf | Match |
|---|---|---|---|---|---|---|---|
| 4300 Canal St | 0.23mi | 2/1.0 | 945 (-2%) | 3mo | $117,089 | $124 | 81 |
| 2912 Frazier St | 0.26mi | 3/2.0 (+1) | 1,010 (+5%) | 2mo | $160,000 | $158 | 72 |
| 4524 Metropolitan Ave | 0.18mi | 3/2.0 (+1) | 888 (-8%) | 10mo | $213,000 | $240 | 66 |
| 2033 Redman Cir | 0.31mi | 3/1.0 (+1) | 1,024 (+7%) | 2mo | $110,000 | $107 | 64 |
| 4103 Copeland St | 0.46mi | 3/1.0 (+1) | 948 (-1%) | 8mo | $90,000 | $95 | 61 |
| 2918 Morning Ave | 0.34mi | 3/1.0 (+1) | 882 (-8%) | 2mo | $115,000 | $130 | 60 |
| 2021 Redman Cir | 0.31mi | 2/1.0 | 880 (-8%) | 11mo | $102,000 | $116 | 58 |
| 3519 Frank St | 0.74mi | 2/1.0 | 924 (-4%) | 4mo | $90,000 | $97 | 52 |
| 3827 Frank St | 0.49mi | 2/1.0 | 816 (-15%) | 2mo | $75,500 | $93 | 46 |
| 4110 Carl | 0.48mi | 2/1.0 | 1,095 (+14%) | 8mo | $115,000 | $105 | 44 |
| 3818 Penelope St | 0.53mi | 1/1.0 (-1) | 822 (-14%) | 6mo | $79,500 | $97 | 37 |
| 3719 Metropolitan Ave | 0.66mi | 3/1.0 (+1) | 1,088 (+13%) | 7mo | $225,000 | $207 | 32 |
Match score weights: distance 35% · size 25% · config 20% · recency 20%. Top-matched comps best support the ARV.
Projected returns pro-forma
1.07% appreciation · 3.0% rent growth · sell at horizon
- IRR
- 3.5%
- Equity multiple
- 1.18×
- Total profit
- $7,212
- Equity at exit
- $50,004
- IRR
- 7.9%
- Equity multiple
- 1.97×
- Total profit
- $39,374
- Equity at exit
- $66,842
Cash invested: $40,600 (down + closing). Projections, not guarantees.
Landlord ↔ Tenant lean methodology
- Overall (STATE)
- 87 Strongly Landlord-Friendly
- State Texas
- 87 Strongly Landlord-Friendly · R+5
- County
- — inherits STATE
- City
- — inherits STATE
ZIP-level market 75210
- Home prices YoY
- 0.6%
- Active inventory
- 80
- Price-to-rent
- 8.8×
Monthly cashflow live
- Estimated rent
- $1,376 high interval (Pro) →
- Mortgage (P&I)
- −$760
- Tax from tax record
- −$204 /mo · $2,443/yr
- Insurance
- −$60
- HOA
- −$0
- Vacancy / Maint / Mgmt
- −$289
- Net cashflow
- $63
Break-even live
UW: 25.0% down · 7.5% · 30yr · 1.5% tax · 5.0% vac · 8.0% maint · 8.0% mgmt
Financing live
Cash to close
- Down payment
- $36,250
- Closing costs
- $4,350
- Reserves months
- —
- Total cash needed
- —
Loan-product check · same deal, 3 products live
Conventional
25% down · 7.5% · 30yr
- Down + closing
- —
- Monthly P&I
- —
- Monthly cashflow
- —
- DSCR
- —
- Eligible?
- —
Personal DTI + credit; lowest rate.
DSCR
20% down · 8.5% · 30yr
- Down + closing
- —
- Monthly P&I
- —
- Monthly cashflow
- —
- DSCR
- —
- Eligible?
- —
No personal income docs; deal must DSCR.
Hard money
10% down · 12.0% · 12mo
- Down + closing
- —
- Monthly P&I
- —
- Monthly cashflow
- —
- DSCR
- —
- Eligible?
- —
Short-term bridge; refi at stabilization.
Rent comps 22 comps
| Address | Beds | Baths | Sqft | Rent | $/sqft | DOM | Units | Dist |
|---|---|---|---|---|---|---|---|---|
| 4525 Metropolitan Ave Dallas, TX | 3.0 | 2.0 | 1090 | $1,490 | $1.37 | 13d | 1 | 0.16mi |
| 4303 Jamaica St Dallas, TX | 3.0 | 2.0 | 1027 | $1,375 | $1.34 | 6d | 1 | 0.26mi |
| 4717 Owenwood Ave Dallas, TX | 3.0 | 2.0 | 1090 | $1,490 | $1.37 | 13d | 1 | 0.30mi |
| 2003 Gorman St Dallas, TX | 1.0 | 1.0 | 540 | $895 | $1.66 | 43d | 1 | 0.32mi |
| 4205 Metropolitan Ave Dallas, TX | 2.0 | 1.0 | 625 | $1,150 | $1.84 | 43d | 1 | 0.37mi |
| 3422 Terrell St Dallas, TX | 1.0 | 1.0 | 820 | $800 | $0.98 | 43d | 1 | 0.52mi |
| 2711 Cross St Dallas, TX | 2.0 | 1.0 | 700 | $1,275 | $1.82 | 6d | 1 | 0.65mi |
| 3639 Pine St Dallas, TX | 3.0 | 2.0 | 1090 | $1,490 | $1.37 | 13d | 1 | 0.69mi |
| 3529 Herrling St Dallas, TX | 2.0 | 1.0 | 632 | $1,200 | $1.90 | 10d | 1 | 0.72mi |
| 1315 S Barry Ave Dallas, TX | 1.0–2.0 | 1.0 | 670 | $1,040 | $1.55 | 10d | 5 | 0.86mi |
| 3408 Spring Ave Dallas, TX | 3.0 | 2.0 | 780 | $1,340 | $1.72 | 6d | 1 | 0.87mi |
| 3910 Polly St Dallas, TX | 2.0 | 1.0 | 550 | $1,100 | $2.00 | 7d | 1 | 0.95mi |
| 3627 Sidney St Dallas, TX | 3.0 | 2.0 | 1090 | $1,614 | $1.48 | 6d | 1 | 0.96mi |
| 3526 Elsie Faye Heggins St Dallas, TX | 3.0 | 2.0 | 1113 | $1,795 | $1.61 | 24d | 1 | 0.99mi |
| 3526 Elsie Faye Heggins St Dallas, TX | 3.0 | 2.0 | 1113 | $1,795 | $1.61 | 7d | 1 | 0.99mi |
| 3907 Roberts Ave Dallas, TX | 3.0 | 1.0 | 908 | $1,395 | $1.54 | 14d | 1 | 1.03mi |
| 5221 Grovewood St Dallas, TX | 3.0 | 1.5 | 840 | $1,400 | $1.67 | 43d | 1 | 1.11mi |
| 4942 Garland Ave Dallas, TX | 3.0 | 1.0 | 1058 | $1,600 | $1.51 | 24d | 1 | 1.30mi |
| 4722 Meadow St Dallas, TX | 2.0–3.0 | 2.0 | 1107 | $1,275 | $1.15 | 11d | 4 | 1.32mi |
| 801 Wayne St Dallas, TX | 1.0 | 1.0 | 702 | $995 | $1.42 | 24d | 1 | 1.43mi |
| 4121 Commerce St Dallas, TX | 1.0 | 1.0–1.5 | 1495 | $3,200 | $2.14 | 7d | 5 | 1.44mi |
| 4024 Myrtle St Dallas, TX | 3.0 | 2.0 | 1106 | $1,595 | $1.44 | 4d | 1 | 1.48mi |
Listing history 14 events
-
2026-06-18days on market $145,000 Active 222 DOM
-
2026-06-17days on market $145,000 Active 221 DOM
-
2026-06-16days on market $145,000 Active 220 DOM
-
2026-06-15days on market $145,000 Active 219 DOM
-
2026-06-13days on market $145,000 Active 217 DOM
-
2026-06-09days on market $145,000 Active 213 DOM
-
2026-06-08days on market $145,000 Active 212 DOM
-
2026-06-07days on market $145,000 Active 211 DOM
-
2026-06-04days on market $145,000 Active 208 DOM
-
2026-06-03days on market $145,000 Active 207 DOM
-
2026-06-02days on market $145,000 Active 206 DOM
-
2026-06-02days on market $145,000 Active 205 DOM
-
2026-05-31days on market $145,000 Active 204 DOM
-
2025-11-08$145,000 Active 201-char remark
Show marketing remark (201 chars)
Great investment opportunity, duplex 1 bedroom 1 bathroom on both sides with long-term tenants. Bonus, the seller is selling the adjacent lot (4521 Canal St) 0.0633 of an acre as a package.
ⓘ Source: listings_history table (triggers on properties + properties_extension) + one-shot
backfill from property_details.listing_events for pre-trigger history.
Tax reassessment forecast TX · Resets to sale price
- Current annual tax
- $2,443 · $204/mo
- Projected year-2 tax
- $2,654 · $221/mo
- Expected delta
- +$210/yr (+$18/mo · 8.6%)
ⓘ Screening estimate from a state-policy table — verify with the county assessor before closing.
Climate risk First Street
- Flood 5/10 Major FEMA zone X (unshaded) · 47% chance over 30 yrs
- Wildfire 3/10 Moderate
- Heat 7/10 Severe 7 d/yr ≥109°F today · 25 d/yr by 30 yrs out
- Wind 6/10 Major 27% chance of damaging wind over 30 yrs
- Air quality 2/10 Low 2 unhealthy d/yr today · 2 by 30 yrs out
Nearby sold comps map
Loading sold comps map…
Walkable amenities ~0.75 mi
Loading nearby amenities…
Taxation est. · year 1
- Rental income
- $16,513
- − Mortgage interest
- −$8,122
- − Property taxes
- −$2,443
- − Insurance
- −$725
- − Repairs & maintenance
- −$1,321
- − Management
- −$1,321
- − Depreciation
- −$4,218
- Taxable loss
- −$1,638
- Est. tax savings @ 24.0%
- +$393
- After-tax cash flow
- $1,145/yr
For passive investors: Depreciation is non-cash, so a rental often shows a tax loss while cash-flowing — sheltering income. Rental losses are passive: they offset passive income freely, and up to $25,000/yr can offset ordinary (W-2) income if you actively participate and your MAGI is under $100k (phasing out to $0 by $150k); unused losses carry forward. On sale, claimed depreciation is recaptured at up to 25%, and gains may owe capital-gains tax (a 1031 exchange can defer both). Figures are a year-1 estimate at your 24.0% rate — not tax advice; consult a CPA.
Schools (NCES district)
- District
- Dallas ISD
- NCES district ID
- 4816230
- Math proficiency
- 31% ▼ -16.00%
- Reading proficiency
- 36% ▼ -4.00%
- Median HH income
- $42,881
- Composite
- 28.41/100
- National rank
- #6763
- State rank
- #559 of 826 in TX
Livability — Dallas
- Score
- 81/100
- State rank
- #24
- US rank
- #1380
Category grades
Schools grade is shown separately in the Schools card above.
Census & demographics
- Census place
- Dallas, TX
- City population
- 1,168,437
- Population (ZIP)
- 7,458
Population outlook (Dallas County) Hauer SSP2
- Today (2025)
- 2,979,839 people
- By 2030
- 3,191,823 · +7.1%
- By 2040
- 3,619,611 · +21.5%
- By 2050
- 4,026,915 · +35.1%
- By 2075
- 4,957,073 · +66.4%
- By 2100
- 5,508,725 · +84.9%
Race, ethnicity, and origin ACS 2023
- Neighborhood character
- Majority Black (56%)
- Race & ethnicity
- Black 56% Hispanic / Latino 39% Two or more races 12% White 3% Asian 2%
- Hispanic origin (detail)
- Mexican 17%
- Foreign-born
- 23% · Canada, Vietnam
- Languages at home
- 66% English-only · Spanish 32% Vietnamese 2%
Political lean MEDSL · Dallas
- 2024 margin
- Strong D (+22.2) · D 60.2% · R 38.0% · Other 1.8%
- 2008→2024 swing
- +6.9pp toward D · 2008: 15.3pp · 2024: 22.2pp
- All cycles
- 2024: D+22.2 2020: D+31.6 2016: D+26.2 2012: D+15.4 2008: D+15.3
Not yet ingested
- Civics
- —
Market trends
- HPI YoY
- ▲ 1.07%
- Current HPI
- 177.2281
- Rent YoY
- —
- Metro
- —
- State GDP YoY
- ▲ 3.95%
- F500 in state
- 110
Industry mix (Fortune 500 HQ in TX)
| Industry | F500 HQs | Revenue |
|---|---|---|
| Energy | 16 | $1,198B |
|
||
| Technology | 5 | $198B |
|
||
| Engineering / Construction | 4 | $72B |
|
||
| Energy Services | 3 | $60B |
|
||
| Utilities | 3 | $41B |
|
||
| Healthcare | 2 | $330B |
|
||
Price history
1 event — show timeline
- 2025-11-08 Listed $145,000 NTREIS
Property tax history
+8.2%/yrLatest (2025): $2,443 · -0.4% YoY. Source: county tax records.
Cash-flow waterfall
monthlySold comps — $/sqft
last 12 mo · ≤1 miLoading sold comps…