6010 Indian · Burtchville, MI
Flood risk No data
- FEMA flood zone
- —
- Chance of flooding over 30 yrs
- —
- Est. flood insurance / yr
- —
Fire risk No data
- Est. fire insurance / yr
- —
Heat risk No data
- Hot days now (above threshold)
- —
- Hot days in 30 yrs
- —
Wind risk No data
- Chance of severe wind over 30 yrs
- —
Air-quality risk No data
- Unhealthy air days now
- —
- Unhealthy air days in 30 yrs
- —
Risk factors via First Street. Map © Google.
Why this score? — see what drove the D+ grade
The composite is a weighted blend of 9 inputs, each scored 0–100. Each bar is that input's sub-score; the figure is the points it added to the 100-point composite (weight × sub-score).
- Cash flow +16.0/30.0
- 1% rule +10.0/10.0
- ARV discount +7.5/15.0
- DSCR +4.9/10.0
- Rent growth +2.5/5.0
- Schools +2.5/10.0
- Livability +2.5/5.0
- Condition / age +2.5/5.0
- Appreciation +0.0/10.0
$40,000
🖨 Deal sheet 📄 Offer letter ✓ Due diligence
Listing remarks MLS
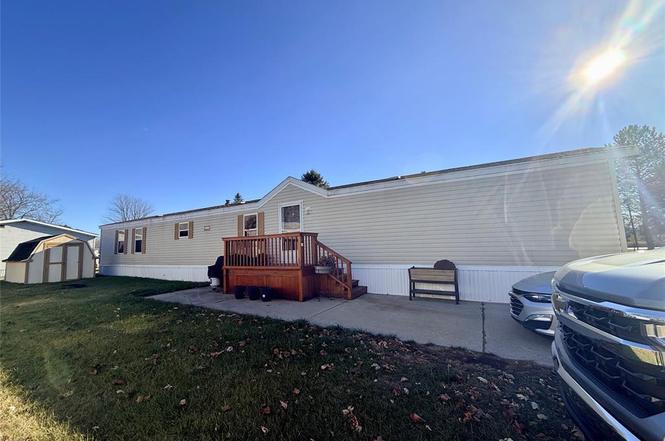
Discover the perfect blend of comfort and community in this 3 bedroom, 2 full bath trailer located in the well known Indian Trails community in Burtchville, MI. This home features an open-concept layout, perfect for modern living and entertaining. The spacious master suite offers a luxurious retreat with its own garden tub in the full private bath. You'll also appreciate the appeal of recent updates throughout the home, making it move-in ready! Immediate occupancy and New carpet!
Key facts
- Master suite
- Recent updates
- Open-concept layout
Tags
Property features AI
Finance
- Other: Community amenities include pool and clubhouse
- HOA & community: Homeowners association with monthly fee of $603; HOA fee includes water, sewer, and trash
Exterior
- Parking: Driveway; No garage; Assigned parking
- Utilities: Public water; Public sewer
- Home design: Single-family residence; One level; Ground-level entry with steps; Vinyl siding
- Construction: Vinyl siding construction; Pillar/post/pier foundation; Built as one-story (above grade finished area listed)
- Exterior features: Deck; Porch; Community pool; Community clubhouse; Private maintained road; Private road frontage; Irregular lot shape
Interior
- Kitchen: Dishwasher; Gas oven; Refrigerator; Microwave; Range hood
- Bathrooms: 2 full bathrooms
- Heating & cooling: Forced air heating (natural gas); No central cooling
- Interior features: Dishwasher; Free-standing gas oven; Free-standing refrigerator; Microwave; Range hood; 6 total rooms
- Laundry & utility: Laundry room with washer hookup and electric dryer hookup
Neighborhood map
What this means for you Summary
Snapshot
- This is a 3-bed/2.0-bath single-family listed at $40k.
Deal economics
- At list price, monthly cash flow is $20 ($237/yr) — positive.
- The deal already cash-flows at list — no discount required.
- Meets the 1% rule at list price ($1k rent vs $40k).
- Recommended offer: $35k (12.0% below list) — sets the bar for market timing.
Location & tenants
- Location reads: area grade D — affects rentability + tenant quality, not the cash-flow math above.
- Port Huron Area School District (suburban): math 23% / reading 37% proficiency, ranked #368 of 540 in MI (top 68%) — families likely to look elsewhere, expect single-tenant / working-renter base with shorter leases.
- Market conditions: 101 active listings in the ZIP; 232 units permitted in St. Clair County in 2024 (0 in 5+ unit buildings).
Forward outlook
- Local home prices are declining (-3.0%/yr); year-one equity from $277 of loan paydown is wiped out by about $1k of value loss. Plan a longer hold.
- St. Clair County population projected at -20% by 2050 — secular population decline; favor cash flow + early exit over multi-decade hold.
Negotiation context
- It's been on market 173 days — a 12% lower offer ($35k) is reasonable based on typical stale-listing flexibility.
- 4 sale attempts; this cycle's ask has dropped $10k (20%) from the opening price — seller is motivated, your offer sets the floor, not the list.
Risks & watch-outs
- Watch-outs: HOA is 53% of rent.
Questions for the listing agent
- It's been on market 173 days. Have you received any prior offers? Is the seller open to a 12% concession, seller financing, or rate buy-down credit?
- What does the HOA fee cover, when was the last increase, and are there any pending special assessments or reserve-fund shortfalls?
- Why hasn't it sold? Are there any deal-killer items the seller is aware of (foundation, flood, title, zoning, code violations)?
- Is there a deadline driving the sale (1031 exchange, divorce, estate, relocation)? That informs how much negotiation room exists.
- The area grade is low — what's the realistic commute time and amenity access for the typical tenant pool here? Any planned neighborhood developments (good or bad) we should know about?
- What's the average days-on-market for RENTAL listings here right now (not sales)? A rising rental-DOM trend means longer vacancies and softer asking-rent achievability than the comps imply.
- What's the recent tenant-quality profile in this submarket — average credit score on applications, eviction rate, late-payment / NSF rate, and stable-employment percentage? A property-management company in the area should have these aggregated.
- How much new for-sale + rental construction is in the pipeline within 1–3 miles? Heavy new supply typically softens prices + rents 12–24 months out; constrained supply supports both.
Investment metrics
- 1% rule
- 2.85% ✓
- Cap rate
- 6.89%
- Cash-on-cash
- 2.11%
- DSCR
- 1.09
- GRM
- 2.9
CMA / ARV
- ARV (on-the-fly)
- $208,800
- Comps found
- 2
Show comp detail 2 sales within ~0.75 mi
| Address | Dist | Beds/Ba | Sqft | Sold | Price | $/sf | Match |
|---|---|---|---|---|---|---|---|
| 5972 E Montevista Dr | 0.48mi | 3/1.0 | 1,306 (+9%) | 7mo | $220,000 | $168 | 53 |
| 3167 Washington St | 0.51mi | 3/2.0 | 1,354 (+13%) | 19mo | $235,000 | $174 | 39 |
Match score weights: distance 35% · size 25% · config 20% · recency 20%. Top-matched comps best support the ARV.
Projected returns pro-forma
-3.0% appreciation · 3.0% rent growth · sell at horizon
- IRR
- -11.8%
- Equity multiple
- 0.57×
- Total profit
- $-4,837
- Equity at exit
- $5,964
- IRR
- -1.3%
- Equity multiple
- 0.91×
- Total profit
- $-1,018
- Equity at exit
- $3,458
Cash invested: $11,200 (down + closing). Projections, not guarantees.
Landlord ↔ Tenant lean methodology
- Overall (STATE)
- 62 Landlord-Friendly
- State Michigan
- 62 Landlord-Friendly · EVEN
- County
- — inherits STATE
- City
- — inherits STATE
ZIP-level market 48059
- Active inventory
- 101
- Price-to-rent
- 2.9×
Monthly cashflow live
- Estimated rent
- $1,138 medium interval (Pro) →
- Mortgage (P&I)
- −$210
- Tax est. 1.5%
- −$50 /mo · $600/yr
- Insurance
- −$17
- HOA
- −$603
- Vacancy / Maint / Mgmt
- −$239
- Net cashflow
- $20
Break-even live
UW: 25.0% down · 7.5% · 30yr · 1.5% tax · 5.0% vac · 8.0% maint · 8.0% mgmt
Financing live
Cash to close
- Down payment
- $10,000
- Closing costs
- $1,200
- Reserves months
- —
- Total cash needed
- —
Loan-product check · same deal, 3 products live
Conventional
25% down · 7.5% · 30yr
- Down + closing
- —
- Monthly P&I
- —
- Monthly cashflow
- —
- DSCR
- —
- Eligible?
- —
Personal DTI + credit; lowest rate.
DSCR
20% down · 8.5% · 30yr
- Down + closing
- —
- Monthly P&I
- —
- Monthly cashflow
- —
- DSCR
- —
- Eligible?
- —
No personal income docs; deal must DSCR.
Hard money
10% down · 12.0% · 12mo
- Down + closing
- —
- Monthly P&I
- —
- Monthly cashflow
- —
- DSCR
- —
- Eligible?
- —
Short-term bridge; refi at stabilization.
HOA detail
- Monthly dues
- $603 · $7,236/yr
Listing history 12 events
-
2026-06-18days on market $40,000 Active 173 DOM
-
2026-06-17days on market $40,000 Active 172 DOM
-
2026-06-16days on market $40,000 Active 171 DOM
-
2026-06-15days on market $40,000 Active 170 DOM
-
2026-06-13days on market $40,000 Active 168 DOM
-
2026-06-13days on market $40,000 Active 167 DOM
-
2026-06-09days on market $40,000 Active 164 DOM
-
2026-06-08days on market $40,000 Active 163 DOM
-
2026-06-07days on market $40,000 Active 162 DOM
-
2026-06-04days on market $40,000 Active 159 DOM
-
2026-06-03remarks 484-char remark
-
2026-06-03$40,000 Active 158 DOM
ⓘ Source: listings_history table (triggers on properties + properties_extension) + one-shot
backfill from property_details.listing_events for pre-trigger history.
Nearby sold comps map
Loading sold comps map…
Walkable amenities ~0.75 mi
Loading nearby amenities…
Taxation est. · year 1
- Rental income
- $13,658
- − Mortgage interest
- −$2,241
- − Property taxes
- −$600
- − Insurance
- −$200
- − Repairs & maintenance
- −$1,093
- − Management
- −$1,093
- − HOA
- −$7,236
- − Depreciation
- −$1,164
- Taxable income
- $33
- Est. tax owed @ 24.0%
- −$8
- After-tax cash flow
- $229/yr
For passive investors: Depreciation is non-cash, so a rental often shows a tax loss while cash-flowing — sheltering income. Rental losses are passive: they offset passive income freely, and up to $25,000/yr can offset ordinary (W-2) income if you actively participate and your MAGI is under $100k (phasing out to $0 by $150k); unused losses carry forward. On sale, claimed depreciation is recaptured at up to 25%, and gains may owe capital-gains tax (a 1031 exchange can defer both). Figures are a year-1 estimate at your 24.0% rate — not tax advice; consult a CPA.
Schools (NCES district)
- District
- Port Huron Area School District
- NCES district ID
- 2628830
- Math proficiency
- 23% ▼ -5.00%
- Reading proficiency
- 37% ▼ -2.00%
- Median HH income
- $42,093
- Composite
- 25.4/100
- National rank
- #7462
- State rank
- #368 of 540 in MI
Livability — Burtchville
No livability data for this city. (Only ~50 U.S. cities are tracked.)
Census & demographics
- Population (ZIP)
- 15,371
Population outlook (St. Clair County) Hauer SSP2
- Today (2025)
- 154,587 people
- By 2030
- 150,031 · -2.9%
- By 2040
- 138,177 · -10.6%
- By 2050
- 124,390 · -19.5%
- By 2075
- 95,825 · -38.0%
- By 2100
- 68,672 · -55.6%
Race, ethnicity, and origin ACS 2023
- Neighborhood character
- Predominantly White (90%)
- Race & ethnicity
- White 90% Hispanic / Latino 5% Two or more races 3% Black 1%
- Hispanic origin (detail)
- Mexican 4%
- Common ancestry
- Romanian 11% Lithuanian 5% Slovak 4%
- Foreign-born
- 2% · Canada
- Languages at home
- 98% English-only · Spanish 1%
Political lean MEDSL · St. Clair
- 2024 margin
- Solid R (+34.6) · D 32.0% · R 66.6% · Other 1.4%
- 2008→2024 swing
- -37.3pp toward R · 2008: 2.6pp · 2024: -34.6pp
- All cycles
- 2024: R+34.6 2020: R+30.2 2016: R+31.4 2012: R+7.1 2008: D+2.6
Not yet ingested
- Civics
- —
Market trends
- HPI YoY
- ▼ -133.89%
- Current HPI
- 151.0184
- Rent YoY
- —
- Metro
- —
- State GDP YoY
- ▲ 1.37%
- F500 in state
- 28
Industry mix (Fortune 500 HQ in MI)
| Industry | F500 HQs | Revenue |
|---|---|---|
| Automotive Parts | 3 | $48B |
|
||
| Automotive | 2 | $372B |
|
||
| Chemicals | 1 | $45B |
|
||
| Automotive Retail | 1 | $29B |
|
||
| Healthcare / Medical Devices | 1 | $23B |
|
||
| Automotive Technology | 1 | $20B |
|
||
Price history
-20.0% since first listed9 events — show timeline
- 2026-06-02 Relisted — MiRealSource-MiMLS
- 2026-06-02 Relisted — REALCOMP
- 2026-04-29 Listing Removed — MiRealSource-MiMLS
- 2026-01-16 Price Changed $40,000 MiRealSource-MiMLS
- 2026-01-16 Price Changed $40,000 REALCOMP
- 2025-12-29 Price Changed $45,000 MiRealSource-MiMLS
- 2025-12-28 Price Changed $45,000 REALCOMP
- 2025-11-24 Listed $50,000 REALCOMP
- 2025-11-23 Listed $50,000 MiRealSource-MiMLS
Cash-flow waterfall
monthlySold comps — $/sqft
last 12 mo · ≤1 miLoading sold comps…